Jefferies Industrials Conference August 9, 2017

Filed by Huntsman Corporation
pursuant to Rule 425 under the Securities Act of 1933
and deemed filed pursuant to Rule 14a-12 under
the Securities Exchange Act of 1934
Subject Company: Huntsman Corporation
Commission File No. 1-32427
Jefferies Industrials Conference August 9, 2017

General Disclosure Forward Looking Statements This presentation includes “forward-looking statements” within the meaning of Section 27A of the Securities Act of 1933 and Section 21E of the Securities Exchange Act of 1934. These forward-looking statements include statements concerning our plans, objectives, goals, strategies, future events, future revenue or performance, capital expenditures, financing needs, plans or intentions relating to acquisitions, business trends and other information that is not historical information. When used in this presentation, the words “estimates,” “expects,” “anticipates,” “projects,” “plans,” “intends,” “believes,” “forecasts,” or future or conditional verbs, such as “will,” “should,” “could” or “may,” and variations of such words or similar expressions are intended to identify forward-looking statements. All forward-looking statements, including, without limitation, management’s examination of historical operating trends and data, are based upon our current expectations and various assumptions. Our expectations, beliefs and projections are expressed in good faith, and we believe there is a reasonable basis for them. However, there can be no assurance that management’s expectations, beliefs and projections will be achieved. We assume no obligation to provide revisions to any forward-looking statements should circumstances change, except as required by applicable laws. The forward-looking statements in this release are subject to uncertainty and changes in circumstances and involve risks and uncertainties that may affect the company's operations, markets, products, services, prices and other factors as discussed in the Huntsman companies' filings with the U.S. Securities and Exchange Commission. Significant risks and uncertainties may relate to, but are not limited to, volatile global economic conditions, cyclical and volatile product markets, disruptions in production at manufacturing facilities, reorganization or restructuring of Huntsman’s operations, including any delay of, or other negative developments affecting, our merger with Clariant, the ability to implement cost reductions and manufacturing optimization improvements in Huntsman businesses and realize anticipated cost savings, and other financial, economic, competitive, environmental, political, legal, regulatory and technological factors. All forward-looking statements attributable to us or persons acting on our behalf apply only as of the date made and are expressly qualified in their entirety by the cautionary statements included in this presentation. We undertake no obligation to update or revise forward-looking statements which may be made to reflect events or circumstances that arise after the date made or to reflect the occurrence of unanticipated events. Supplemental Information This presentation contains financial measures that are not in accordance with generally accepted accounting principles in the U.S. ("GAAP"), including EBITDA, adjusted EBITDA, adjusted EBITDA from discontinued operations, normalized EBITDA, adjusted net income (loss), adjusted diluted income (loss) per share and net debt. The Company has provided reconciliations of non-GAAP financial measures to the most directly comparable GAAP financial measures in the Appendix to this presentation. Our financial statements and tax returns are prepared with certain components of inventory stated on the LIFO method for inventory valuation, and supplemental information is not intended to replace the primary published financial statements which include these inventories on a LIFO basis. Please refer to the primary published financial statements in our most recently filed Form 10-K and Forms 10-Q. 1
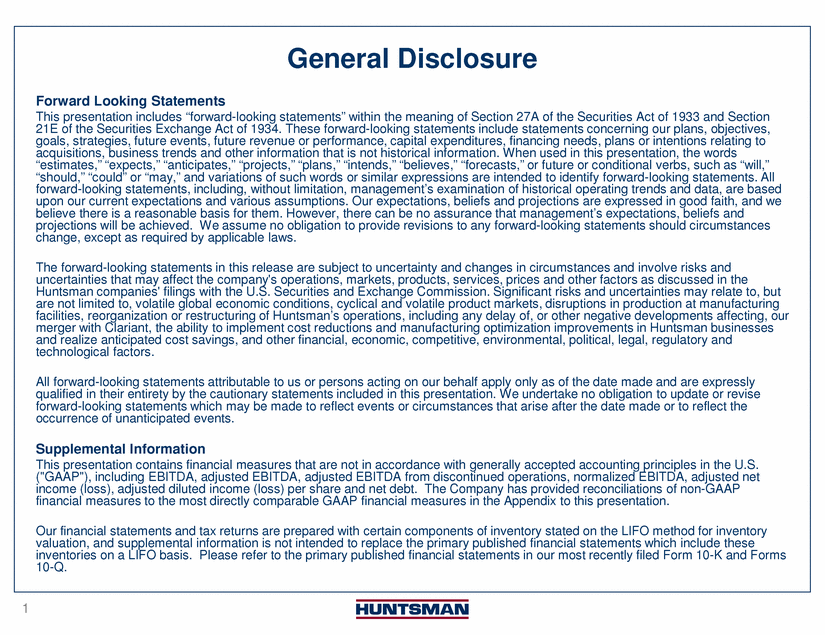
Near Term Priorities - Greater than $450 million FCF expected in 2017 on a pre-Venator basis. Second half 2017 targeted to be greater than $150mm, without Venator Repaid $265 million of debt in 2017 as of the end of July 2017 Since January 2016, including approximately $1.2 billion of Venator net proceeds excluding tax, we will have repaid over $2 billion of debt - - - - Venator IPO is completed and shares began trading August 3rd under the ticker VNTR Intend to use the over $1.2 billion in net proceeds excluding tax, from Venator to reduce Huntsman debt, which will reduce annual cash interest expense by ~$45 million Monetize remaining 75.4% ownership through secondary offerings in an orderly manner and dependent upon market conditions - - Cost synergy targets in excess of $400 million confirmed, creating in excess of $3.5 billion in value for shareholders Additional organic sales revenues of ~2% p.a. at ~ 20% adjusted EBITDA margin from complementary product portfolios in Performance Products / Care Chemicals / Natural Resources Antitrust filings and regulatory reviews are underway Shareholder meetings and closing targeted for December ‘17/January ‘18 - - - 2 Preparation for Merger of Equals with Clariant Separate the Pigments & Additives Business (Venator) Focused on free cash flow generation and debt reduction
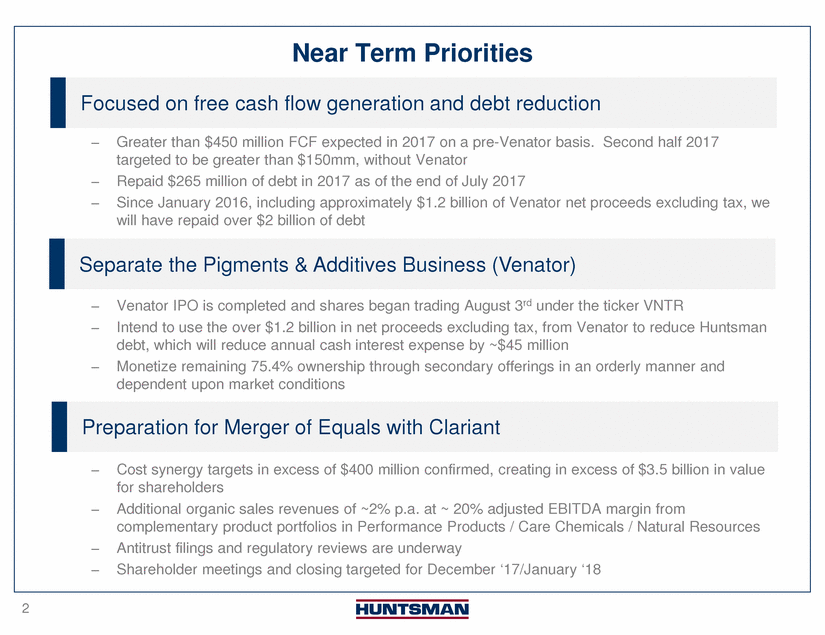
Composition(1) Portfolio Textile Effects Textile Effects 7% Advanced Materials 18% 10% Advanced Materials 13% Polyurethanes 51% Polyurethanes 49% Performance Products 26% Performance Products 26% 2016 Revenues Source: Management estimates $ in millions Adj. EBITDA Margin Paints & Coatings 3% $1,262 Agrochemicals 3% Aerospace 3% $1,139 Adhesives, Coatings & Elastomers 5% Construction Materials 6% Intermediate Chemicals 9% Industrial Applications 11% $1,098 $1,056 $990 $969 Other 1% Consumer 30% 14% $717 13% 13% 13% Apparel 10% Automotive & Marine 8% Home Furnishings 7% Household Products 5% $664 12% 11% 9% 8% Energy & Fuel Additives 14% Insulation 15% 2010(4) 2011(4) 2012(4) 2013(4) 2014(4) 2015(4) 2016(4)2Q17 LTM(4) (1) Pro forma to exclude the Pigments & Additives business, which is treated as discontinued operations after the completion of Venator’s IPO on August 8, 2017. (2) Segment allocation is before Corporate and other unallocated items (3) See Appendix for a reconciliation (4) Excludes European surfactants business, which was sold to Innospec on December 30, 2016 3 Adjusted EBITDA(3) End Markets(4) 2Q17 LTM(4) Revenues $7.6 billion Adjusted EBITDA $1.0 billion Revenue(2) Adjusted EBITDA(2)(3)
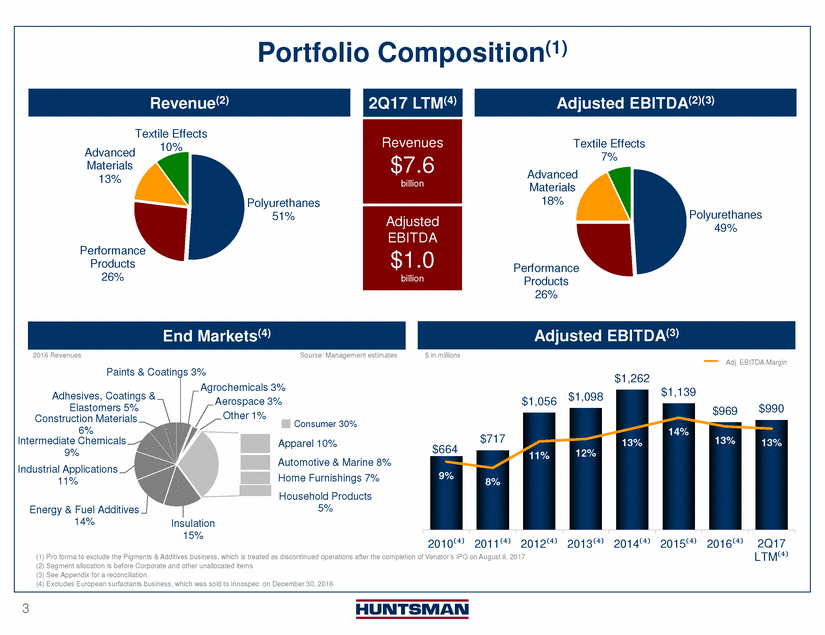
HUN EBITDA Growth in Key Specialty Markets ~46% E 600 0.4 0.38 9% Differentiated 10% CAGR 500 0.36 0.34 Component 400 17% 0.32 300 0.3 0.28 200 0.26 0.24 100 0.22 0 0.2 2010 2011 2012 2013 2014 2015 2016 MDI EBITDA % Component MDI Sales 19% Advanced Materials EBITDA EBITDA E 30% 300 14% CAGR 250 200 20% 150 100 10% 50 0 0% 2011 2012 2013 2014 2015 2016 2012 2013 2014 2015 2016 EBITDA % Revenue from Base Resin APAC ROW 4 % of Sales % of Revenue % of Sales EBITDA EBITDA Contribution Margin cpp EBITDA Volatility(1) 17% CAGR 10% Amines EBITDA BITDA MDI Urethanes Contr. Margin and Volatility BITDAMDI EBITDA
Polyurethanes 2016 Revenues Furniture 6% Appliances 4% Footwear 6% 2016 Revenues Source: Management Estimates Apparel 3% Rest of World 18% US & Canada 34% Insulation 36% Automotive 18% Intermediate Chemicals 2% Industrial Applications 3% Consumer 37% Asia Pacific 22% Adhesives, Coatings & Elastomers 12% Composite Wood Products 10% Europe 26% $ in millions Adj. EBITDA Margin $793 $746 $728 $578 $573 $569 $495 $337 16% 16% 15% 15% 15% 14% 11% 9% 2010 2011 2012 2013 2014 2015 2016 2Q17LTM Wanhua MDI Urethanes MTBE Crude MDI Capacity Size 5 Degree of Differentiation Adjusted EBITDA History MDI Competitive Intensity BASF Covestro Dow Top 5 MDI Producers = 90% Adjusted EBITDA $578 million 2Q17 LTM Revenues $3.8 billion Revenues MDI Urethanes End Markets
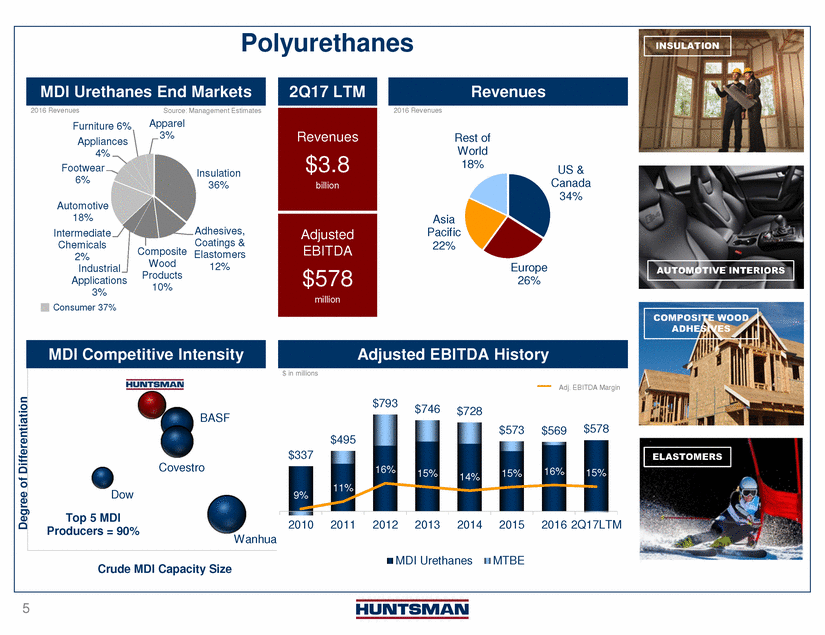
Polyurethanes – Focus on Driving Differentiation 75% of Sales 23% PORTFOLIO* • • • System sales or specialized MDI Technical solutions Lower volatility, less utilization dependent • • • Higher cost to serve Higher long term average EBITDA ~10c/lb higher long term average unit contribution margins Downstream proximity ‘Bolt on’ acquisitions providing market access & technology platforms • * % of 2016 MDI EBITDA 6 Global Reach, Local Proximity Differentiated Characteristics
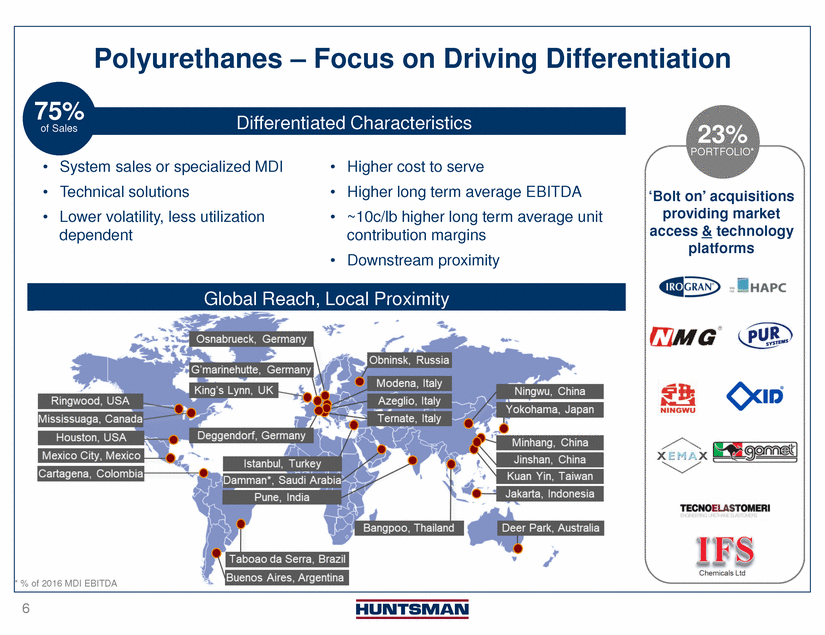
Performance Products 2016 Revenues Other 2% Paints & Coatings 2% Source: Management Estimates 2016 Revenues Rest of World 8% Household Products 11% Personal Care 4% Asia Pacific 20% Industrial Applications 29% Construction Materials 2% US & Canada 55% Fuel Additives & Lubricants Energy 11% Agrochemicals Europe 17% 8% Intermediate Chemicals 10% 11% Polymers 10% Consumer 15% (1) Excludes European surfactants business, which was sold to Innospec in 2016 $ in millions Adj. EBITDA Margin $465 $439 $393 $365 $356 $353 16 (Global) $311 20% $288 15% 14% 14% 6% Oxiteno (Americas) (Americas & EMEA) 40% Catalysts (Global) Momentive 2010 2011 2012 2013 2014 2015 2016 2Q17 LTM (Americas & EMEA) 7 FAUX MARBLE Adjusted EBITDA History(1) Huntsman Market Share Product Market Share Peers Amines Polyetheramines>60%BASF EthyleneaminesDow, Tosoh, (Global) 45%Delamine Ethanolamines20%Dow, Ineos, Morpholine/DGA50%BASF Specialty PUBASF, Evonik, Lanxess, Flint Maleic Anhydride40%Hills, Polynt, Bartek Adjusted EBITDA(1) $311 million 2Q17 LTM Revenues(1) $2.0 billion Revenues(1) End Markets(1)
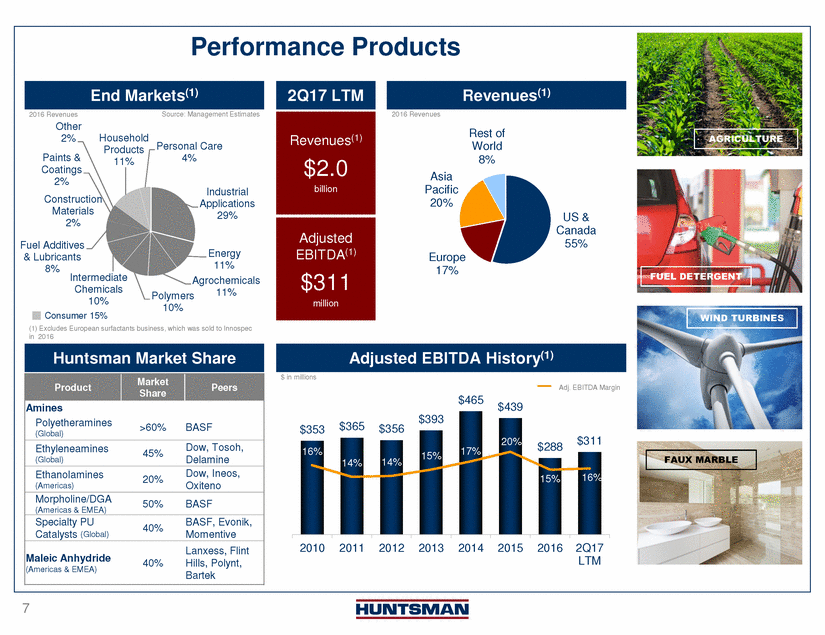
Three Key Businesses in Performance Products ~40% Amines EBITDA Other 17% DGA/Morpholine 9% LTM Q117 Revenues • • • Broadest product offering of any producer Fast growing markets (5-8%) Continued investment in capacity expansion to meet market growth Polyetheramines 30% Ethanolamines 14% Ethyleneamines 30% ~20% Maleic Anhydride EBITDA Inks & Pigments Other 5% • World’s largest Maleic Anhydride producer with 12% of world capacity Global technology leader, lowest cost producer in NA and Europe 3% Copolymers 3% Food 7% Paper & WT Chem 14% Lubricants 15% • Unsaturated Polyester Resin 53% - - 75% share of licensing projects Lowest cost butane-based process, benzene losing out ~15% Surfactants EBITDA • • • Assets in North America, Australia and India Backward integrated to EO in the US and Australia Only integrated player in specialty markets of agriculture, oilfield, fuel and lubes Home/Personal Care 36% Other Specialties 34% Crop Protection 30% 8
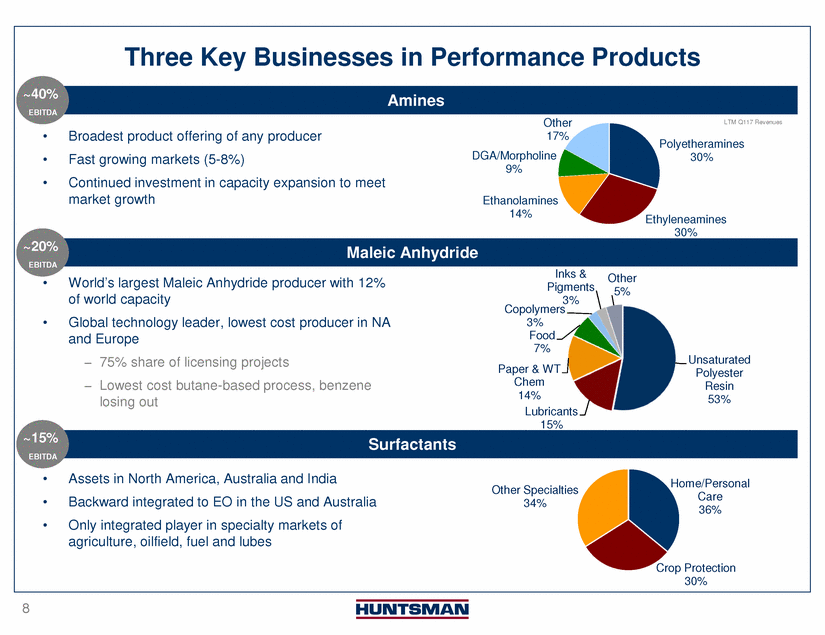
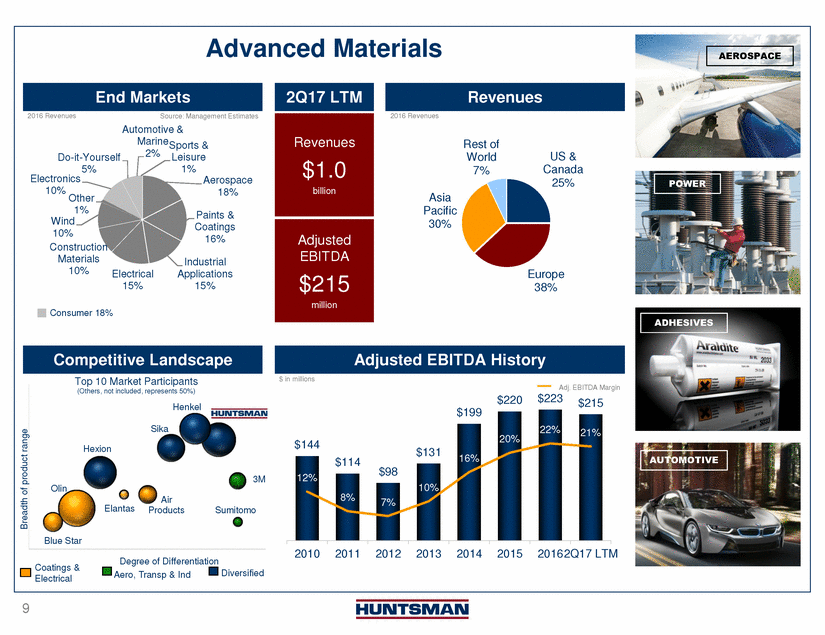
Advanced Materials 2016 Revenues Source: Management Estimates Automotive & MarineSports & 1% Aerospace 18% 2016 Revenues Rest of World 7% 2% US & Canada 25% Do-it-Yourself Leisure 5% Electronics 10% Other 1% Wind 10% Construction Materials 10% Asia Pacific 30% Paints & Coatings 16% Industrial Applications 15% Electrical 15% Europe 38% Consumer 18% $ in millions Top 10 Market Participants Adj. EBITDA Margin $223 $220 $215 $199 22% 21% $144 $131 16% $114 $98 1 % 10% 8% 7% Elantas Products Sumitomo 2010 2011 2012 2013 2014 2015 20162Q17 LTM Degree of Differentiation Coatings & Electrical Diversified Aero, Transp & Ind 9 Breadth of product range (Others, not included, represents 50%) Henkel Sika Hexion 3M Olin Air Blue Star Adjusted EBITDA History Competitive Landscape Adjusted EBITDA $215 million 2Q17 LTM Revenues $1.0 billion Revenues End Markets AEROSPACE
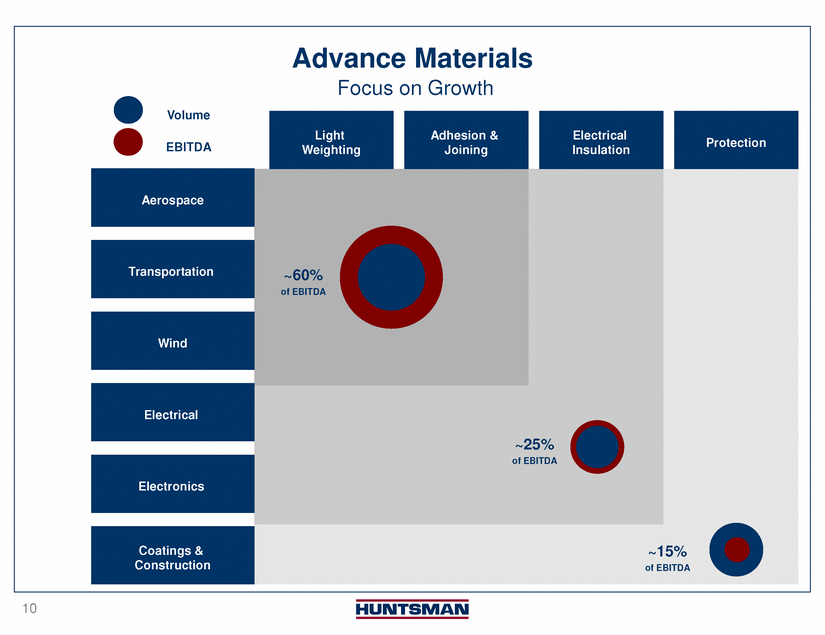
Advance Materials Focus on Growth 10 Volume EBITDA Light Weighting Adhesion & Joining Electrical Insulation Protection Aerospace ~60% of EBITDA Transportation Wind Electrical ~25% of EBITDA Electronics Coatings & Construction ~15% of EBITDA
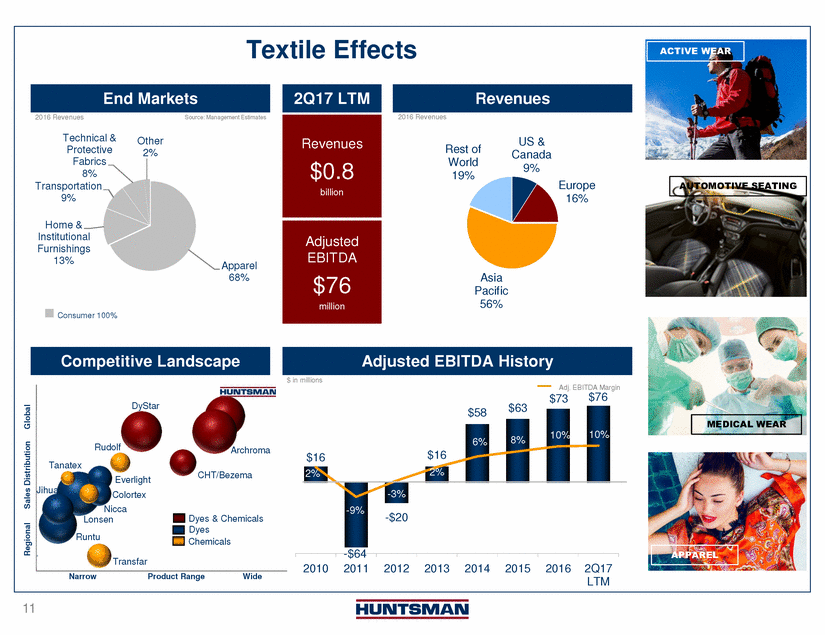
Textile Effects 2016 Revenues 2016 Revenues Source: Management Estimates Technical & Protective Fabrics 8% Transportation 9% Other 2% US & Canada 9% Rest of World 19% Europe 16% Home & Institutional Furnishings 13% Apparel 68% Asia Pacific 56% Consumer 100% $ in millions Adj. EBITDA Margin $76 $73 $63 $58 10% 10% 8% Archroma $16 2% $16 2 Everlight -3% -9% -$20 Runtu Chemicals -$64 2010 2011 2012 2013 2014 2015 2016 2Q17 LTM Narrow Product Range Wide 11 Regional Sales Distribution Global DyStar Rudolf Tanatex CHT/Bezema Jihua Colortex Nicca Lonsen Dyes & Chemicals Dyes Transfar MEDICAL WEAR Adjusted EBITDA History Competitive Landscape Adjusted EBITDA $76 million AUTOMOTIVE SEATING 2Q17 LTM Revenues $0.8 billion Revenues End Markets
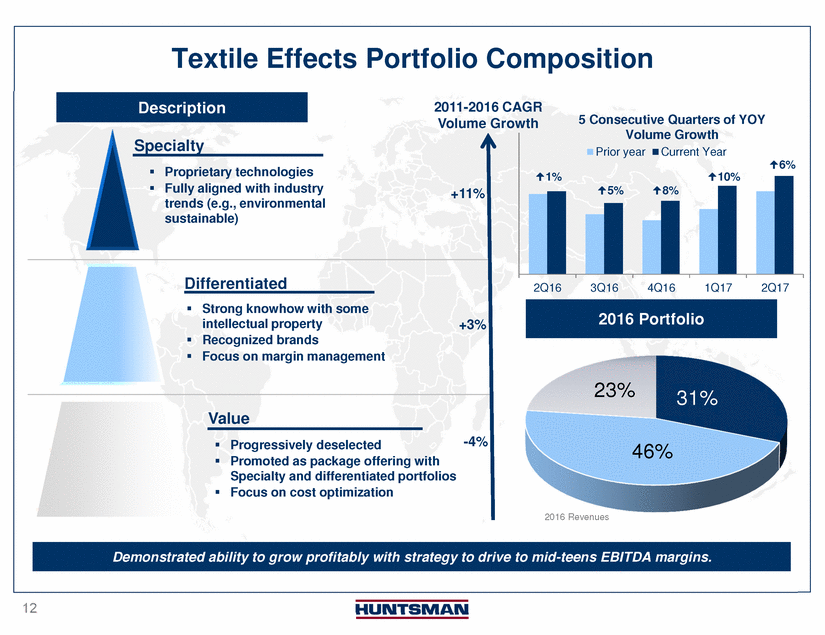
Textile Effects Portfolio Composition 2011-2016 CAGR Volume Growth 5 Consecutive Quarters of YOY Specialty • • Proprietary technologies Fully aligned with industry trends (e.g., environmental sustainable) 1% 10% 5% 8% +11% Differentiated 2Q16 3Q16 4Q16 1Q17 2Q17 • Strong knowhow with some intellectual property Recognized brands Focus on margin management +3% • • 23% 31% Value -4% • • Progressively deselected Promoted as package offering with Specialty and differentiated portfolios Focus on cost optimization 46% • 2016 Revenues 12 Demonstrated ability to grow profitably with strategy to drive to mid-teens EBITDA margins. 2016 Portfolio Volume Growth Prior yearCurrent Year 6% Description
Creating a Global Specialty Chemical Leader Select slides from the merger update and transaction overview presentation
General Disclosure Cautionary Statement Regarding Forward-Looking Statements This communication contains certain statements that are “forward-looking statements” within the meaning of Section 27A of the Securities Act of 1933, as amended (the “Securities Act”), and Section 21E of the Securities Exchange Act of 1934, as amended. Clariant Ltd (“Clariant”) and Huntsman Corporation (“Huntsman”) have identified some of these forward-looking statements with words like “believe,” “may,” “could,” “would,” “might,” “possible,” “will,” “should,” “expect,” “intend,” “plan,” “anticipate,” “estimate,” “potential,” “outlook” or “continue,” the negative of these words, other terms of similar meaning or the use of future dates. Forward-looking statements in this communication include, without limitation, statements about the anticipated benefits of the contemplated transaction, including future financial and operating results and expected synergies and cost savings related to the contemplated transaction, the plans, objectives, expectations and intentions of Clariant, Huntsman or the combined company and the expected timing of the completion of the contemplated transaction. Such statements are based on the current expectations of the management of Clariant or Huntsman, as applicable, are qualified by the inherent risks and uncertainties surrounding future expectations generally, and actual results could differ materially from those currently anticipated due to a number of risks and uncertainties. Neither Clariant nor Huntsman, nor any of their respective directors, executive officers or advisors, provide any representation, assurance or guarantee that the occurrence of the events expressed or implied in any forward-looking statements will actually occur. Risks and uncertainties that could cause results to differ from expectations include: uncertainties as to the timing of the contemplated transaction; uncertainties as to the approval of Huntsman’s stockholders and Clariant’s shareholders required in connection with the contemplated transaction; the possibility that a competing proposal will be made; the possibility that the closing conditions to the contemplated transaction may not be satisfied or waived, including that a governmental entity may prohibit, delay or refuse to grant a necessary regulatory approval; the effects of disruption caused by the announcement of the contemplated transaction making it more difficult to maintain relationships with employees, customers, vendors and other business partners; the risk that stockholder litigation in connection with the contemplated transaction may affect the timing or occurrence of the contemplated transaction or result in significant costs of defense, indemnification and liability; ability to refinance existing indebtedness of Clariant or Huntsman in connection with the contemplated transaction; other business effects, including the effects of industry, economic or political conditions outside of the control of the parties to the contemplated transaction; transaction costs; actual or contingent liabilities; disruptions to the financial or capital markets, including financing activities related to the contemplated transaction; and other risks and uncertainties discussed in Huntsman’s filings with the U.S. Securities and Exchange Commission (the “SEC”), including the “Risk Factors” section of Huntsman’s annual report on Form 10-K for the fiscal year ended December 31, 2016 and quarterly report on Form 10-Q for the six months ended June 30,2017. You can obtain copies of Huntsman’s filings with the SEC for free at the SEC’s website (www.sec.gov). Forward-looking statements included herein are made only as of the date hereof and neither Clariant nor Huntsman undertakes any obligation to update any forward-looking statements as a result of new information, future developments or otherwise, except as expressly required by law. All forward-looking statements in this communication are qualified in their entirety by this cautionary statement.
General Disclosure (Cont’d) Important Additional Information and Where to Find It NO OFFER OR SOLICITATION This communication is not intended to and does not constitute an offer to sell or the solicitation of an offer to subscribe for or buy or an invitation to purchase or subscribe for any securities or the solicitation of any vote or approval in any jurisdiction, nor shall there be any sale, issuance or transfer of securities in any jurisdiction in contravention of applicable law. No offer of securities will be made except by means of a prospectus meeting the requirements of Section 10 of the Securities Act. IMPORTANT ADDITIONAL INFORMATION WILL BE FILED WITH THE SEC In connection with the contemplated transaction, Clariant intends to file a registration statement on Form F-4 with the SEC that will include the Proxy Statement/Prospectus of Huntsman. The Proxy Statement/Prospectus will also be sent or given to Huntsman stockholders and will contain important information about the contemplated transaction. INVESTORS AND SHAREHOLDERS ARE URGED TO READ THE PROXY STATEMENT/PROSPECTUS AND OTHER RELEVANT DOCUMENTS FILED OR TO BE FILED WITH THE SEC CAREFULLY WHEN THEY BECOME AVAILABLE BECAUSE THEY WILL CONTAIN IMPORTANT INFORMATION ABOUT CLARIANT, HUNTSMAN, THE CONTEMPLATED TRANSACTION AND RELATED MATTERS. Investors and shareholders will be able to obtain free copies of the Proxy Statement/Prospectus (when available) and other documents filed with the SEC by Clariant and Huntsman through the website maintained by the SEC at www.sec.gov. PARTICIPANTS IN THE SOLICITATION Huntsman and its directors and executive officers may be deemed to be participants in the solicitation of proxies from Huntsman investors and shareholders in connection with the contemplated transaction. Information about Huntsman’s directors and executive officers is set forth in its proxy statement for its 2017 Annual Meeting of Stockholders and its annual report on Form 10-K for the fiscal year ended December 31, 2016. These documents may be obtained for free at the SEC’s website at www.sec.gov. Additional information regarding the interests of participants in the solicitation of proxies in connection with the contemplated transactions will be included in the Proxy Statement/ Prospectus that Huntsman intends to file with the SEC.
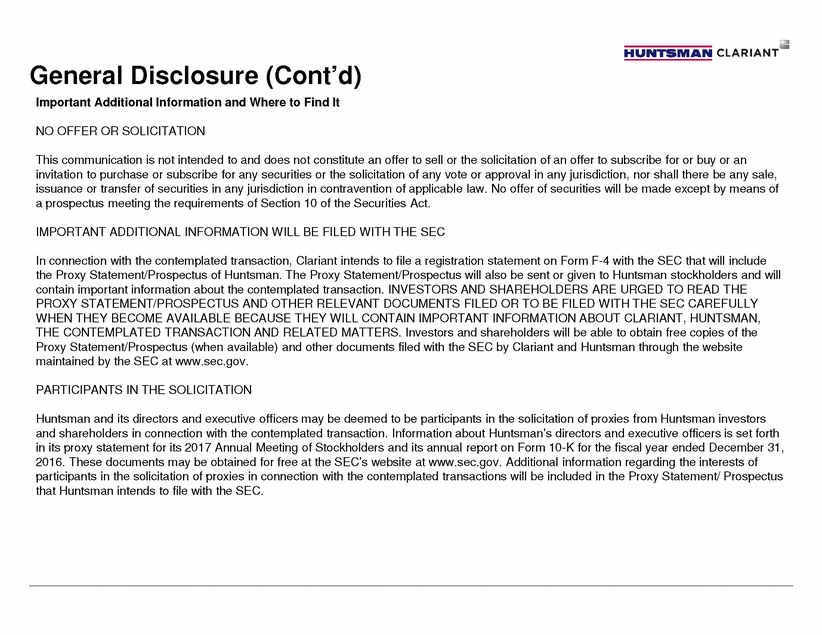
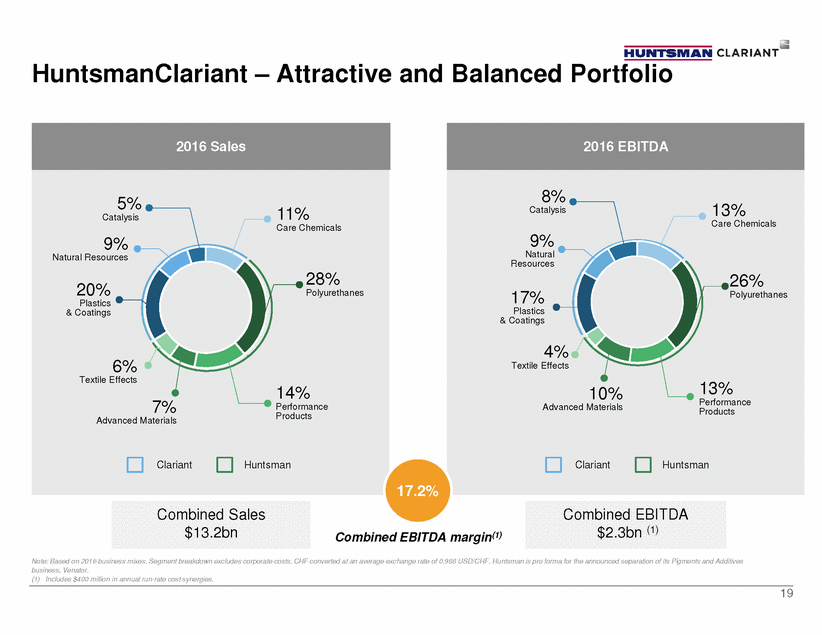
Merger Creates Substantial Long-Term Value Natural Resources 16 Financial rationale • High confidence in meeting synergy target in excess of $400m + $25m tax saving target, creating in excess of $3.5 billion in value for shareholders • Additional organic sales revenues of ~2% p.a. at ~ 20% adjusted EBITDA margin from complementary product portfolios in Performance Products / Care Chemicals / • Stronger balance sheet with pro forma leverage of under 1.5x, consistent higher cash flow, and lower financing costs • More capital for organic growth, value creating add-on acquisitions and capital return Strategic rationale • Highly complementary product portfolios creating production set up and supply chain benefit opportunities in specific overlapping businesses. Performance Products / Care Chemicals / Natural Resources represent approx. 35% of overall sales • Meaningful opportunities for growth including cross-selling potential and new product applications • Complementary asset and geographic fit provides significant commercial opportunities and more global reach within established routes to market • Continuing to move downstream into specialties and more differentiated applications while taking advantage of a broad asset base • Two strong specialty chemicals businesses with similar adjusted EBITDA margins at 17.2% including synergies when combined • Unique opportunity by combining the best of two cultures – Huntsman’s entrepreneurship and efficiency and Clariant’s innovation and business excellence
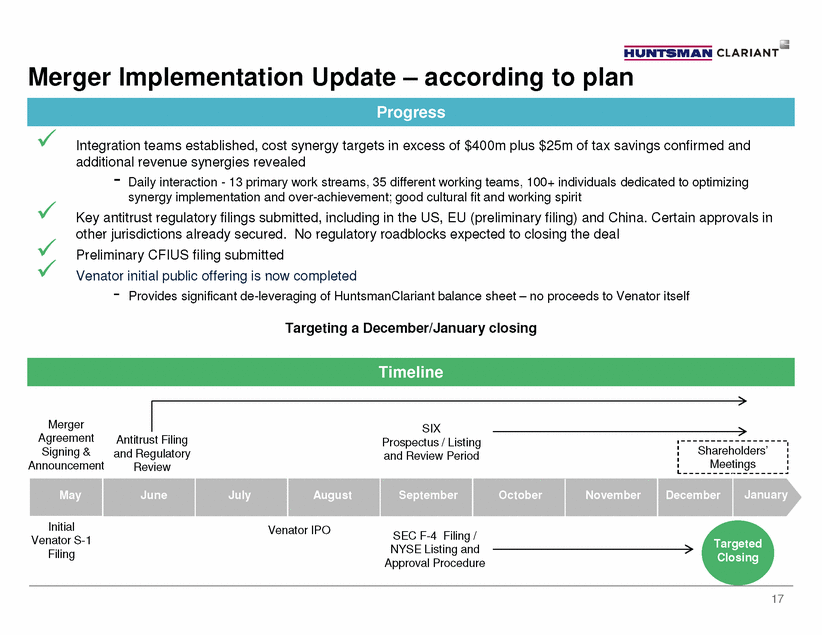
Merger Implementation Update – according to plan ./ Integration teams established, cost synergy targets in excess of $400m plus $25m of tax savings confirmed and additional revenue synergies revealed - Daily interaction - 13 primary work streams, 35 different working teams, 100+ individuals dedicated to optimizing synergy implementation and over-achievement; good cultural fit and working spirit Key antitrust regulatory filings submitted, including in the US, EU (preliminary filing) and China. Certain approvals in other jurisdictions already secured. No regulatory roadblocks expected to closing the deal Preliminary CFIUS filing submitted Venator initial public offering is now completed - Provides significant de-leveraging of HuntsmanClariant balance sheet – no proceeds to Venator itself Targeting a December/January closing ./ ./ ./ Merger Agreement Signing & Announcement SIX Prospectus / Listing and Review Period Antitrust Filing and Regulatory Review Shareholders’ Meetings May June July August September October November December y Initial Venator S-1 Filing Venator IPO SEC F-4 Filing / NYSE Listing and Approval Procedure Targeted Closing 17 Januar Timeline Progress
Appendix
HuntsmanClariant – Attractive and Balanced Portfolio 13% Catalysis Catalysis Natural 17% & Coatings Polyurethanes Textile Effects Performance Advanced Materials Products Advanced Materials Combined Sales $13.2bn Combined EBITDA $2.3bn (1) Combined EBITDA margin(1) Note: Based on 2016 business mixes. Segment breakdown excludes corporate costs. CHF converted at an average exchange rate of 0.988 USD/CHF. Huntsman is pro forma for the announced separation of its Pigments and Additives business, Venator. (1) Includes $400 million in annual run-rate cost synergies. 19 2016 EBITDA 8% Care Chemicals 9% Resources 26% Plastics 4% 10%13% Products ClariantHuntsman 2016 Sales 5%11% Care Chemicals 9% Natural Resources 28% 20%Polyurethanes Plastics & Coatings 6% Textile Effects 14% 7%Performance ClariantHuntsman
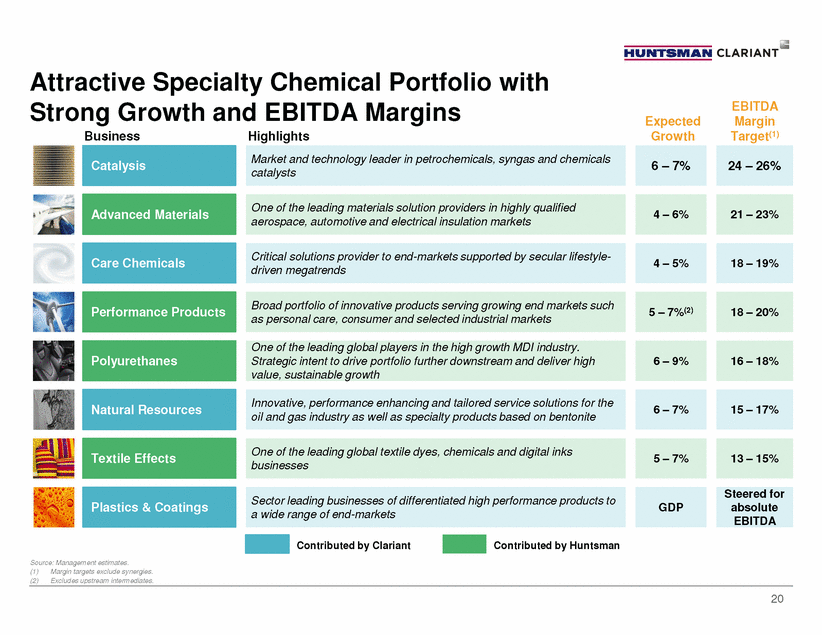
Attractive Specialty Chemical Portfolio with EBITDA Margin Target(1) Strong Growth Business and EBITDA Highlights Margins Expected Growth absolute Contributed by Clariant Contributed by Huntsman Source: Management estimates. (1) Margin targets exclude synergies. (2) Excludes upstream intermediates. 20 Steered for EBITDA GDP Sector leading businesses of differentiated high performance products to a wide range of end-markets Plastics & Coatings 13 – 15% 5 – 7% One of the leading global textile dyes, chemicals and digital inks businesses Textile Effects 15 – 17% 6 – 7% Innovative, performance enhancing and tailored service solutions for the oil and gas industry as well as specialty products based on bentonite Natural Resources 16 – 18% 6 – 9% One of the leading global players in the high growth MDI industry. Strategic intent to drive portfolio further downstream and deliver high value, sustainable growth Polyurethanes 18 – 20% 5 – 7%(2) Broad portfolio of innovative products serving growing end markets such as personal care, consumer and selected industrial markets Performance Products 18 – 19% 4 – 5% Critical solutions provider to end-markets supported by secular lifestyle-driven megatrends Care Chemicals 21 – 23% 4 – 6% One of the leading materials solution providers in highly qualified aerospace, automotive and electrical insulation markets Advanced Materials 24 – 26% 6 – 7% Market and technology leader in petrochemicals, syngas and chemicals catalysts Catalysis
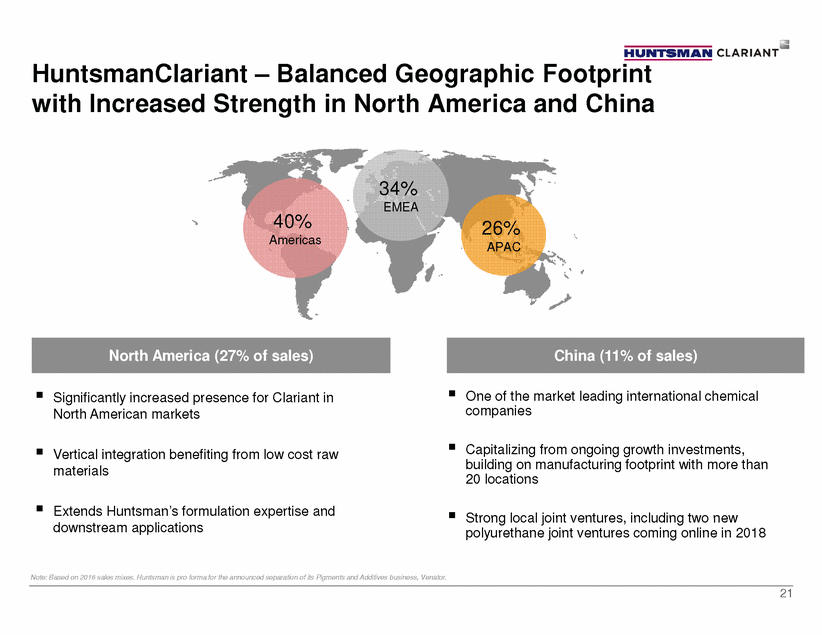
HuntsmanClariant – Balanced Geographic Footprint with Increased Strength in North America and China 34% EMEA 40% 26% Americas APAC North America (27% of sales) China (11% of sales) • • One of the market leading international chemical companies Significantly increased presence for Clariant in North American markets • • Capitalizing from ongoing growth investments, building on manufacturing footprint with more than 20 locations Vertical integration benefiting from low cost raw materials • Extends Huntsman’s formulation expertise and downstream applications • Strong local joint ventures, including two new polyurethane joint ventures coming online in 2018 Note: Based on 2016 sales mixes. Huntsman is pro forma for the announced separation of its Pigments and Additives business, Venator. 21
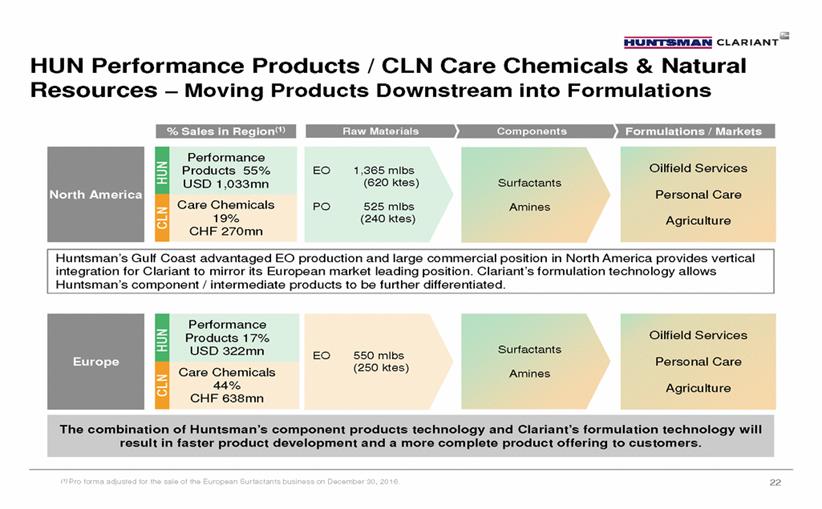
HUN Performance Products / CLN Care Chemicals & Natural Resources – Moving Products Downstream into Formulations Oilfield Services EO 1,365 mlbs (620 ktes) Surfactants Personal Care PO 525 mlbs (240 ktes) Amines Agriculture Oilfield Services Surfactants EO 550 mlbs (250 ktes) Personal Care Amines Agriculture (1) Pro forma adjusted for the sale of the European Surfactants business on December 30, 2016. 22 The combination of Huntsman’s component products technology and Clariant’s formulation technology will result in faster product development and a more complete product offering to customers. Europe HUN Performance Products 17% USD 322mn CLN Care Chemicals 44% CHF 638mn Huntsman’s Gulf Coast advantaged EO production and large commercial position in North America provides vertical integration for Clariant to mirror its European market leading position. Clariant’s formulation technology allows Huntsman’s component / intermediate products to be further differentiated. North America HUN Performance Products 55% USD 1,033mn CLN Care Chemicals 19% CHF 270mn
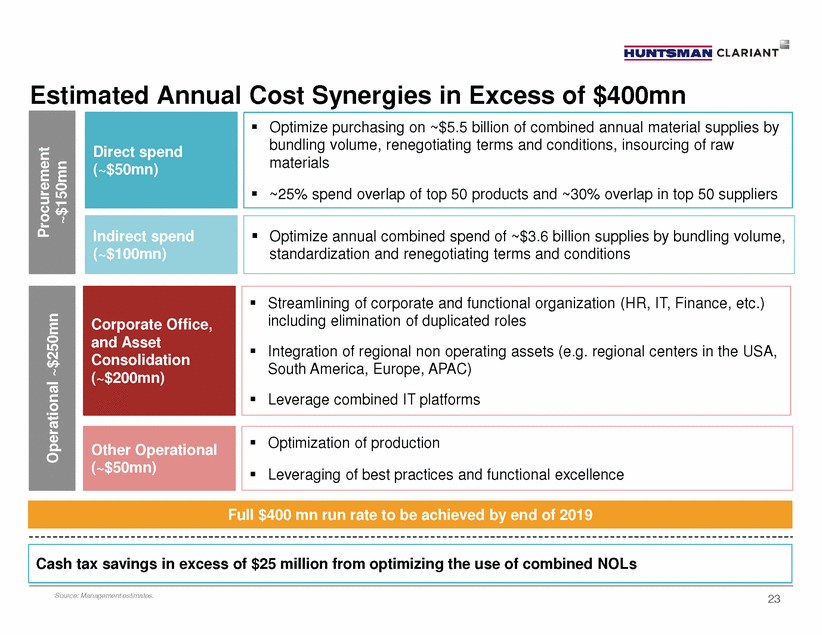
Estimated Annual Cost Synergies in Excess of $400mn materials Source: Management estimates. 23 Cash tax savings in excess of $25 million from optimizing the use of combined NOLs Full $400 mn run rate to be achieved by end of 2019 •Optimization of production •Leveraging of best practices and functional excellence Other Operational (~$50mn) •Streamlining of corporate and functional organization (HR, IT, Finance, etc.) including elimination of duplicated roles •Integration of regional non operating assets (e.g. regional centers in the USA, South America, Europe, APAC) •Leverage combined IT platforms Operational ~$250mn Corporate Office, and Asset Consolidation (~$200mn) •Optimize annual combined spend of ~$3.6 billion supplies by bundling volume, standardization and renegotiating terms and conditions Indirect spend (~$100mn) •Optimize purchasing on ~$5.5 billion of combined annual material supplies by bundling volume, renegotiating terms and conditions, insourcing of raw •~25% spend overlap of top 50 products and ~30% overlap in top 50 suppliers Procurement ~$150mn Direct spend (~$50mn)
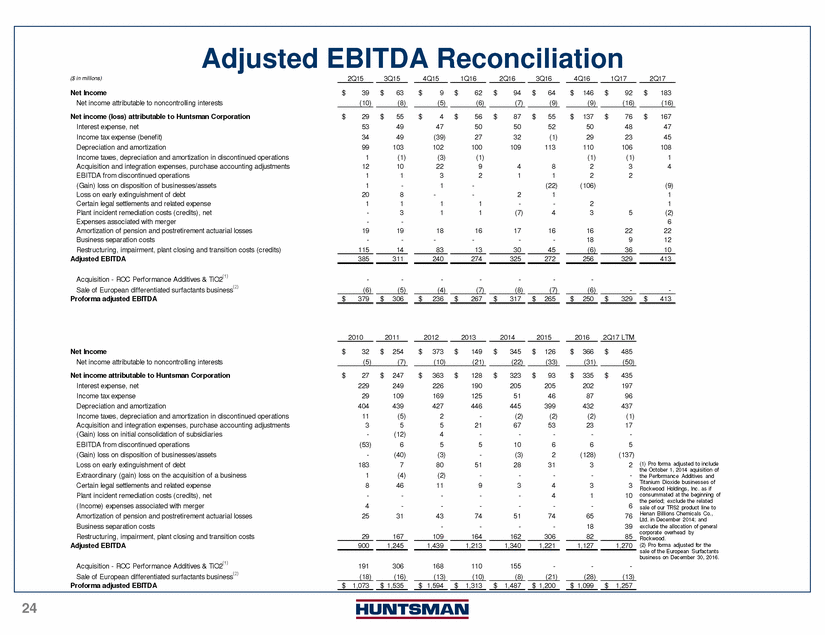
Adjusted EBITDA Reconciliation ($ in millions) 2Q15 3Q15 4Q15 1Q16 2Q16 3Q16 4Q16 1Q17 2Q17 Net Income Net income attributable to noncontrolling interests Net income (loss) attributable to Huntsman Corporation Interest expense, net Income tax expense (benefit) Depreciation and amortization Income taxes, depreciation and amortization in discontinued operations $ 39 $ 63 $ 9 (5) $ 62 $ 94 $ 64 $ 146 (9) $ 92 $ 183 (10) (8) (6) (7) (9) (16) (16) $ 29 53 34 99 1 12 1 1 20 1 - - 19 - $ 55 49 49 103 (1) 10 1 - 8 1 3 - 19 - $ 4 47 (39) 102 (3) 22 3 1 - 1 1 $ 56 50 27 100 (1) 9 2 - - 1 1 $ 87 50 32 109 $ 55 52 (1) 113 $ 137 50 29 110 (1) 2 2 (106) $ 76 $ 167 47 45 108 1 4 48 23 106 (1) 3 2 Acquisition and integration expenses, purchase accounting adjustments 4 1 8 1 (22) 1 - 4 EBITDA from discontinued operations (Gain) loss on disposition of businesses/assets Loss on early extinguishment of debt Certain legal settlements and related expense Plant incident remediation costs (credits), net Expenses associated with merger Amortization of pension and postretirement actuarial losses Business separation costs Restructuring, impairment, plant closing and transition costs (credits) Adjusted EBITDA (9) 1 1 (2) 6 22 12 10 2 - (7) 2 3 5 18 16 17 - 16 - 16 18 (6) 22 9 36 - - 115 14 83 13 30 45 385 311 240 274 325 272 256 329 413 Acquisition - ROC Performance Additives & TiO2(1) Sale of European differentiated surfactants business(2) Proforma adjusted EBITDA - - - - - - - (6) - - (6) (5) (4) (7) (8) (7) $ 379 $ 306 $ 236 $ 267 $ 317 $ 265 $ 250 $ 329 $ 413 2010 2011 2012 2013 2014 2015 2016 2Q17 LTM Net Income Net income attributable to noncontrolling interests Net income attributable to Huntsman Corporation Interest expense, net Income tax expense Depreciation and amortization Income taxes, depreciation and amortization in discontinued operations Acquisition and integration expenses, purchase accounting adjustments (Gain) loss on initial consolidation of subsidiaries EBITDA from discontinued operations (Gain) loss on disposition of businesses/assets Loss on early extinguishment of debt Extraordinary (gain) loss on the acquisition of a business Certain legal settlements and related expense Plant incident remediation costs (credits), net (Income) expenses associated with merger Amortization of pension and postretirement actuarial losses Business separation costs Restructuring, impairment, plant closing and transition costs Adjusted EBITDA $ 32 $ 254 $ 373 $ 149 $ 345 $ 126 $ 366 $ 485 (5) (7) (10) (21) (22) (33) (31) (50) $ 27 229 29 404 11 3 - (53) - 183 1 8 - 4 25 $ 247 249 109 439 (5) 5 (12) 6 (40) 7 (4) 46 - - 31 $ 363 226 169 427 2 5 4 5 (3) 80 (2) 11 - - 43 - $ 128 190 125 446 - 21 - 5 - 51 - 9 - - 74 - $ 323 205 51 445 (2) 67 - 10 (3) 28 - 3 - - 51 - $ 93 205 46 399 (2) 53 - 6 2 31 - 4 4 - 74 - $ 335 202 87 432 (2) 23 - $ 435 197 96 437 (1) 17 - 6 (128) 3 5 (137) 2 (1) Pro forma adjusted to include the October 1, 2014 aquisition of the Performance Additives and Titanium Dioxide businesses of Rockwood Holdings, Inc. as if consummated at the beginning of the period; exclude the related sale of our TR52 product line to Henan Billions Chemicals Co., Ltd. in December 2014; and exclude the allocation of general - 3 1 - 65 18 - 3 10 6 76 39 corporate overhead by 29 167 109 164 162 306 82 85 Rockwood. 900 1,245 1,439 1,213 1,340 1,221 1,127 1,270 (2) Pro forma adjusted for the sale of the European Surfactants business on December 30, 2016. Acquisition - ROC Performance Additives & TiO2(1) Sale of European differentiated surfactants business(2) 191 (18) 306 (16) 168 (13) 110 (10) 155 (8) - (21) - (28) - (13) Proforma adjusted EBITDA $ 1,073 $ 1,535 $ 1,594 $ 1,313 $ 1,487 $ 1,200 $ 1,099 $ 1,257 24
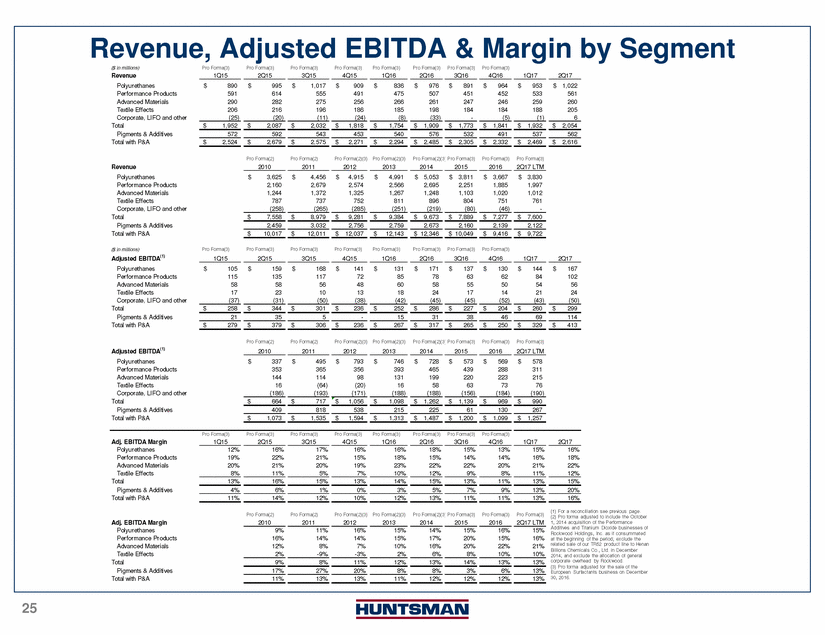
Revenue, Adjusted EBITDA & Margin by Pro Forma(3) Segment Pro Forma(3) 1Q15 Pro Forma(3) 2Q15 Pro Forma(3) 3Q15 Pro Forma(3) 4Q15 Pro Forma(3) 1Q16 Pro Forma(3) 2Q16 Pro Forma(3) 3Q16 ($ in millions) Revenue Polyurethanes Performance Products Advanced Materials Textile Effects Corporate, LIFO and other Total Pigments & Additives Total with P&A 4Q16 1Q17 2Q17 $ 890 591 290 206 $ 995 614 282 216 (20) $ 1,017 555 275 196 (11) $ 909 491 256 186 $ 836 475 266 185 $ 976 507 261 198 (33) $ 891 451 247 184 - $ 964 452 246 184 (5) $ 953 533 259 188 $ 1,022 561 260 205 (25) (24) (8) (1) 6 $ 1,952 $ 2,087 $ 2,032 $ 1,818 $ 1,754 $ 1,909 $ 1,773 $ 1,841 $ 1,932 $ 2,054 572 592 543 453 540 576532 491 537 562 $ 2,524 $ 2,679 $ 2,575 $ 2,271 $2,294 $ 2,485 $ 2,305 $ 2,332 $ 2,469 $ 2,616 Pro Forma(2) 2010 Pro Forma(2) 2011 Pro Forma(2)(3) Pro Forma(2)(3) Pro Forma(2)(3 Pro Forma(3) Pro Forma(3) 2016 Pro Forma(3) 2Q17 LTM Revenue Polyurethanes Performance Products Advanced Materials Textile Effects Corporate, LIFO and other Total Pigments & Additives Total with P&A 2012 2013 2014 2015 $ 3,625 2,160 1,244 787 (258) $ 4,456 2,679 1,372 737 (265) $ 4,915 2,574 1,325 752 $ 4,991 2,566 1,267 811 $ 5,053 2,695 1,248 896 (219) $ 3,811 2,251 1,103 804 (80) $ 3,667 1,885 1,020 751 (46) $ 3,830 1,997 1,012 761 - (285) (251) $ 7,558 $ 8,979 $ 9,281 $ 9,384 $ 9,673 $ 7,889 $ 7,277 $ 7,600 2,459 3,032 2,756 2,759 2,673 2,160 2,139 2,122 $ 10,017 $ 12,011 $ 12,037 $ 12,143 $ 12,346 $ 10,049 $ 9,416 $ 9,722 Pro Forma(3) 1Q15 Pro Forma(3) 2Q15 Pro Forma(3) 3Q15 Pro Forma(3) 4Q15 Pro Forma(3) 1Q16 Pro Forma(3) 2Q16 Pro Forma(3) 3Q16 Pro Forma(3) 4Q16 ($ in millions) Adjusted EBITDA(1) Polyurethanes Performance Products Advanced Materials Textile Effects Corporate, LIFO and other Total Pigments & Additives Total with P&A 1Q17 2Q17 $ 105 115 58 17 $ 159 135 58 23 (31) $ 168 117 56 10 (50) $ 141 72 48 13 $ 131 85 60 18 $ 171 78 58 24 (45) $ 137 63 55 17 (45) $ 130 62 50 14 (52) $ 144 84 54 21 $ 167 102 56 24 (37) (38) (42) (43) (50) $ 258 $ 344 $ 301 $ 236 $ 252 $ 286 $ 227 $ 204 $ 260 $ 299 21 35 5 - 15 31 38 46 69 114 $ 279 $ 379 $ 306 $ 236 $ 267 $ 317 $ 265 $ 250 $ 329 $ 413 Pro Forma(2) 2010 Pro Forma(2) 2011 Pro Forma(2)(3) Pro Forma(2)(3) Pro Forma(2)(3 Pro Forma(3) Pro Forma(3) 2016 Pro Forma(3) 2Q17 LTM Adjusted EBITDA(1) Polyurethanes Performance Products Advanced Materials Textile Effects Corporate, LIFO and other Total Pigments & Additives Total with P&A 2012 2013 2014 2015 $ 337 353 144 16 (186) $ 495 365 114 (64) (193) $ 793 356 98 (20) $ 746 393 131 16 $ 728 465 199 58 (188) $ 573 439 220 63 (156) $ 569 288 223 73 (184) $ 578 311 215 76 (190) (171) (188) $ 664 $ 717 $ 1,056 $ 1,098 $ 1,262 $ 1,139 $ 969 $ 990 409 818 538 215 225 61 130 267 $ 1,073 $ 1,535 $ 1,594 $ 1,313 $ 1,487 $ 1,200 $ 1,099 $ 1,257 Pro Forma(3) 1Q15 Pro Forma(3) 2Q15 Pro Forma(3) 3Q15 Pro Forma(3)Pro Forma(3) Pro Forma(3) 2Q16 Pro Forma(3) 3Q16 Pro Forma(3) 4Q16 Adj. EBITDA Margin Polyurethanes Performance Products Advanced Materials Textile Effects Total Pigments & Additives Total with P&A 4Q15 1Q16 1Q17 2Q17 12% 19% 20% 8% 16% 22% 21% 11% 17% 21% 20% 5% 16% 15% 19% 16% 18% 23% 18% 15% 22% 12% 15% 14% 22% 9% 13% 14% 20% 8% 15% 16% 21% 16% 18% 22% 7% 10% 11% 12% 13% 16% 15% 13% 14% 15% 13% 11% 13% 15% 4% 6% 1% 0% 3% 5% 7% 9% 13% 20% 11% 14% 12% 10% 12% 13% 11% 11% 13% 16% (1) For a reconciliation see previous page. (2) Pro forma adjusted to include the October 1, 2014 acquisition of the Performance Additives and Titanium Dioxide businesses of Rockwood Holdings, Inc. as if consummated at the beginning of the period; exclude the related sale of our TR52 product line to Henan Billions Chemicals Co., Ltd. in December 2014; and exclude the allocation of general corporate overhead by Rockwood. (3) Pro forma adjusted for the sale of the European Surfactants business on December 30, 2016. Pro Forma(2) 2010 Pro Forma(2) 2011 Pro Forma(2)(3) Pro Forma(2)(3) Pro Forma(2)(3 Pro Forma(3) Pro Forma(3) 2016 Pro Forma(3) 2Q17 LTM Adj. EBITDA Margin Polyurethanes Performance Products Advanced Materials Textile Effects Total Pigments & Additives Total with P&A 2012 2013 2014 2015 9% 16% 12% 2% 11% 14% 8% -9% 16% 14% 7% 15% 15% 10% 14% 17% 16% 6% 15% 20% 20% 8% 16% 15% 22% 10% 15% 16% 21% 10% -3% 2% 9% 8% 11% 12% 13% 14% 13% 13% 17% 27% 20% 8% 8% 3% 6% 13% 11% 13% 13% 11% 12% 12% 12% 13% 25
HUNTSMAN Enriching lives through innovation
