Creating a Global Specialty Chemical Leader May 30, 2017 25th Vontobel Summer Conference 8th of June 2017
Filing pursuant to Rule 425 under the
Securities Act of 1933, as amended
Filer: Clariant Ltd
Subject Company: Huntsman Corporation
Commission File Number: 001-32427
Creating a Global Specialty Chemical Leader May 30, 2017 25th Vontobel Summer Conference 8th of June 2017

Cautionary Statement Regarding Forward-Looking Statements This communication contains certain statements that are “forward-looking statements” within the meaning of Section 27A of the Securities Act of 1933, as amended (the “Securities Act”), and Section 21E of the Securities Exchange Act of 1934, as amended. Clariant Ltd (“Clariant”) and Huntsman Corporation (“Huntsman”) have identified some of these forward-looking statements with words like “believe,” “may,” “could,” “would,” “might,” “possible,” “will,” “should,” “expect,” “intend,” “plan,” “anticipate,” “estimate,” “potential,” “outlook” or “continue,” the negative of these words, other terms of similar meaning or the use of future dates. Forward-looking statements in this communication include, without limitation, statements about the anticipated benefits of the contemplated transaction, including future financial and operating results and expected synergies and cost savings related to the contemplated transaction, the plans, objectives, expectations and intentions of Clariant, Huntsman or the combined company, the expected timing of the completion of the contemplated transaction and information relating to the proposed initial public offering of ordinary shares of Venator Materials PLC. Such statements are based on the current expectations of the management of Clariant or Huntsman, as applicable, are qualified by the inherent risks and uncertainties surrounding future expectations generally, and actual results could differ materially from those currently anticipated due to a number of risks and uncertainties. Neither Clariant nor Huntsman, nor any of their respective directors, executive officers or advisors, provide any representation, assurance or guarantee that the occurrence of the events expressed or implied in any forward-looking statements will actually occur. Risks and uncertainties that could cause results to differ from expectations include: uncertainties as to the timing of the contemplated transaction; uncertainties as to the approval of Huntsman’s stockholders and Clariant’s shareholders required in connection with the contemplated transaction; the possibility that a competing proposal will be made; the possibility that the closing conditions to the contemplated transaction may not be satisfied or waived, including that a governmental entity may prohibit, delay or refuse to grant a necessary regulatory approval; the effects of disruption caused by the announcement of the contemplated transaction making it more difficult to maintain relationships with employees, customers, vendors and other business partners; the risk that stockholder litigation in connection with the contemplated transaction may affect the timing or occurrence of the contemplated transaction or result in significant costs of defense, indemnification and liability; ability to refinance existing indebtedness of Clariant or Huntsman in connection with the contemplated transaction; other business effects, including the effects of industry, economic or political conditions outside of the control of the parties to the contemplated transaction; transaction costs; actual or contingent liabilities; disruptions to the financial or capital markets, including with respect to the initial public offering of ordinary shares by Venator Materials PLC or financing activities related to the contemplated transaction; and other risks and uncertainties discussed in Huntsman’s filings with the U.S. Securities and Exchange Commission (the “SEC”), including the “Risk Factors” section of Huntsman’s annual report on Form 10-K for the fiscal year ended December 31, 2016. You can obtain copies of Huntsman’s filings with the SEC for free at the SEC’s website (www.sec.gov). Forward-looking statements included herein are made only as of the date hereof and neither Clariant nor Huntsman undertakes any obligation to update any forward-looking statements as a result of new information, future developments or otherwise, except as expressly required by law. All forward-looking statements in this communication are qualified in their entirety by this cautionary statement. General Disclosure
General Disclosure (Cont’d) Important Additional Information and Where to Find It NO OFFER OR SOLICITATION This communication is not intended to and does not constitute an offer to sell or the solicitation of an offer to subscribe for or buy or an invitation to purchase or subscribe for any securities or the solicitation of any vote or approval in any jurisdiction, nor shall there be any sale, issuance or transfer of securities in any jurisdiction in contravention of applicable law. No offer of securities will be made except by means of a prospectus meeting the requirements of Section 10 of the Securities Act. IMPORTANT ADDITIONAL INFORMATION WILL BE FILED WITH THE SEC In connection with the contemplated transaction, Clariant intends to file a registration statement on Form F-4 with the SEC that will include the Proxy Statement/Prospectus of Huntsman. The Proxy Statement/Prospectus will also be sent or given to Huntsman stockholders and will contain important information about the contemplated transaction. INVESTORS AND SHAREHOLDERS ARE URGED TO READ THE PROXY STATEMENT/PROSPECTUS AND OTHER RELEVANT DOCUMENTS FILED OR TO BE FILED WITH THE SEC CAREFULLY WHEN THEY BECOME AVAILABLE BECAUSE THEY WILL CONTAIN IMPORTANT INFORMATION ABOUT CLARIANT, HUNTSMAN, THE CONTEMPLATED TRANSACTION AND RELATED MATTERS. Investors and shareholders will be able to obtain free copies of the Proxy Statement/Prospectus (when available) and other documents filed with the SEC by Clariant and Huntsman through the website maintained by the SEC at www.sec.gov. PARTICIPANTS IN THE SOLICITATION Huntsman and its directors and executive officers may be deemed to be participants in the solicitation of proxies from Huntsman investors and shareholders in connection with the contemplated transaction. Information about Huntsman’s directors and executive officers is set forth in its proxy statement for its 2017 Annual Meeting of Stockholders and its annual report on Form 10-K for the fiscal year ended December 31, 2016. These documents may be obtained for free at the SEC’s website at www.sec.gov. Additional information regarding the interests of participants in the solicitation of proxies in connection with the contemplated transactions will be included in the Proxy Statement/ Prospectus that Huntsman intends to file with the SEC.
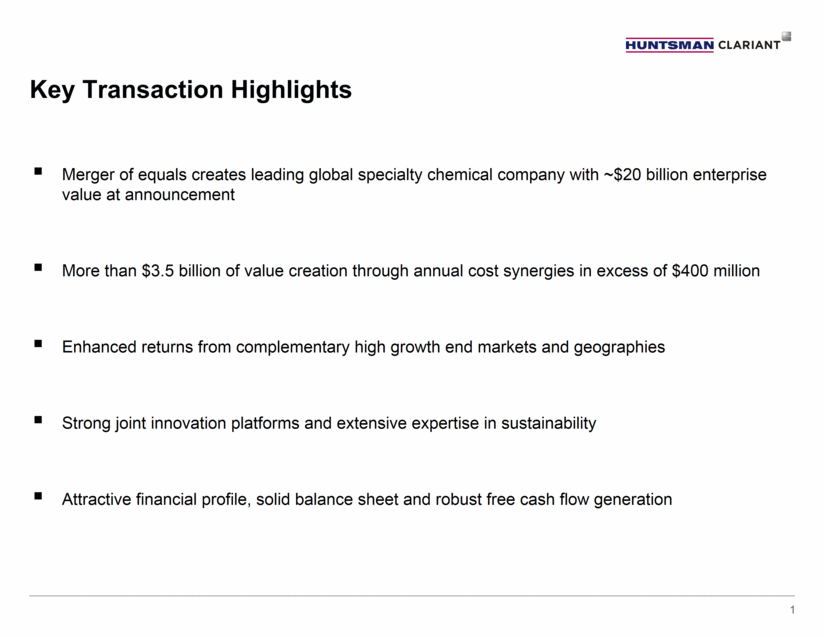
Key Transaction Highlights Merger of equals creates leading global specialty chemical company with ~$20 billion enterprise value at announcement More than $3.5 billion of value creation through annual cost synergies in excess of $400 million Enhanced returns from complementary high growth end markets and geographies Strong joint innovation platforms and extensive expertise in sustainability Attractive financial profile, solid balance sheet and robust free cash flow generation 1
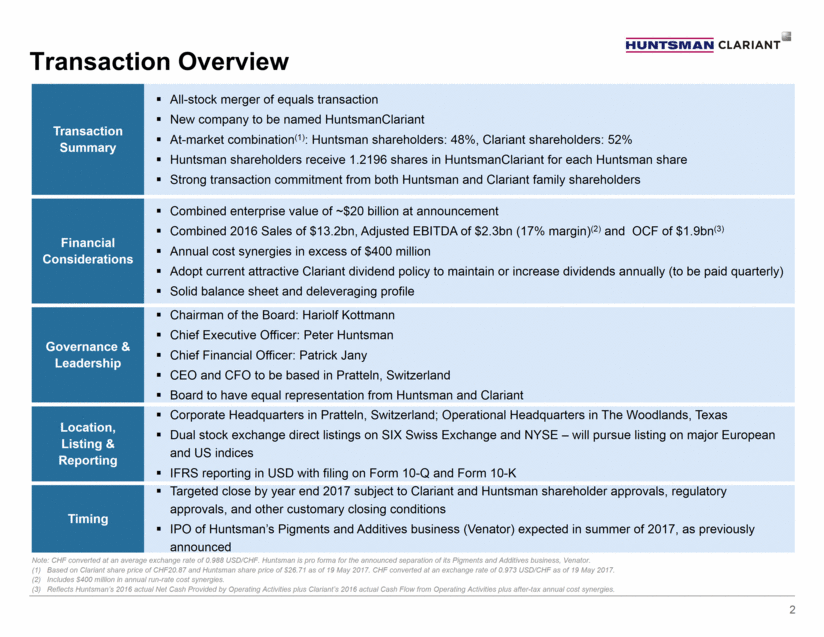
Transaction Overview All-stock merger of equals transaction New company to be named HuntsmanClariant At-market combination(1): Huntsman shareholders: 48%, Clariant shareholders: 52% Huntsman shareholders receive 1.2196 shares in HuntsmanClariant for each Huntsman share Strong transaction commitment from both Huntsman and Clariant family shareholders Transaction Summary Targeted close by year end 2017 subject to Clariant and Huntsman shareholder approvals, regulatory approvals, and other customary closing conditions IPO of Huntsman’s Pigments and Additives business (Venator) expected in summer of 2017, as previously announced Timing Chairman of the Board: Hariolf Kottmann Chief Executive Officer: Peter Huntsman Chief Financial Officer: Patrick Jany CEO and CFO to be based in Pratteln, Switzerland Board to have equal representation from Huntsman and Clariant Governance & Leadership Corporate Headquarters in Pratteln, Switzerland; Operational Headquarters in The Woodlands, Texas Dual stock exchange direct listings on SIX Swiss Exchange and NYSE – will pursue listing on major European and US indices IFRS reporting in USD with filing on Form 10-Q and Form 10-K Location, Listing & Reporting Combined enterprise value of ~$20 billion at announcement Combined 2016 Sales of $13.2bn, Adjusted EBITDA of $2.3bn (17% margin)(2) and OCF of $1.9bn(3) Annual cost synergies in excess of $400 million Adopt current attractive Clariant dividend policy to maintain or increase dividends annually (to be paid quarterly) Solid balance sheet and deleveraging profile Financial Considerations Note: CHF converted at an average exchange rate of 0.988 USD/CHF. Huntsman is pro forma for the announced separation of its Pigments and Additives business, Venator. (1) Based on Clariant share price of CHF20.87 and Huntsman share price of $26.71 as of 19 May 2017. CHF converted at an exchange rate of 0.973 USD/CHF as of 19 May 2017. (2) Includes $400 million in annual run-rate cost synergies. (3) Reflects Huntsman’s 2016 actual Net Cash Provided by Operating Activities plus Clariant’s 2016 actual Cash Flow from Operating Activities plus after-tax annual cost synergies. 2
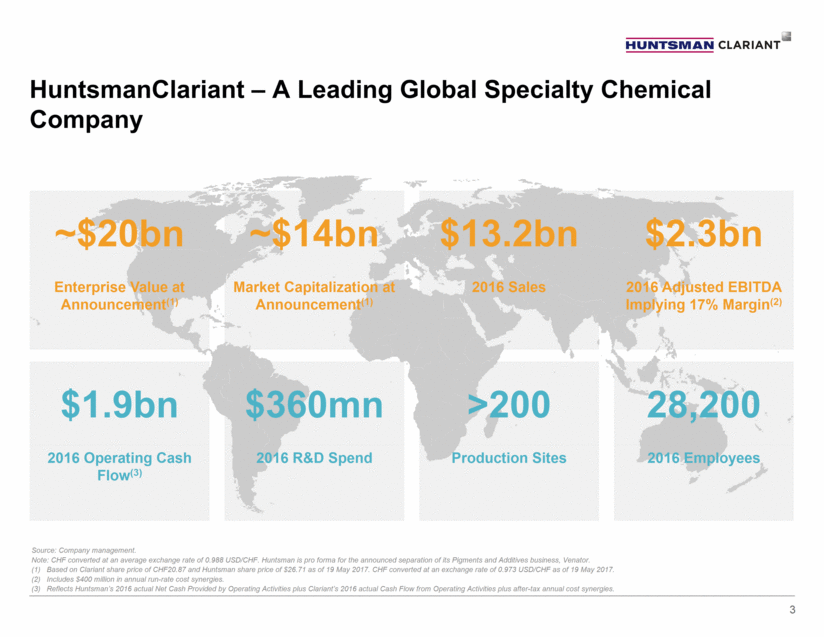
HuntsmanClariant – A Leading Global Specialty Chemical Company ~$20bn Enterprise Value at Announcement(1) ~$14bn Market Capitalization at Announcement(1) $13.2bn 2016 Sales $2.3bn 2016 Adjusted EBITDA Implying 17% Margin(2) $1.9bn 2016 Operating Cash Flow(3) $360mn 2016 R&D Spend 28,200 2016 Employees >200 Production Sites Source: Company management. Note: CHF converted at an average exchange rate of 0.988 USD/CHF. Huntsman is pro forma for the announced separation of its Pigments and Additives business, Venator. (1) Based on Clariant share price of CHF20.87 and Huntsman share price of $26.71 as of 19 May 2017. CHF converted at an exchange rate of 0.973 USD/CHF as of 19 May 2017. (2) Includes $400 million in annual run-rate cost synergies. (3) Reflects Huntsman’s 2016 actual Net Cash Provided by Operating Activities plus Clariant’s 2016 actual Cash Flow from Operating Activities plus after-tax annual cost synergies. 3
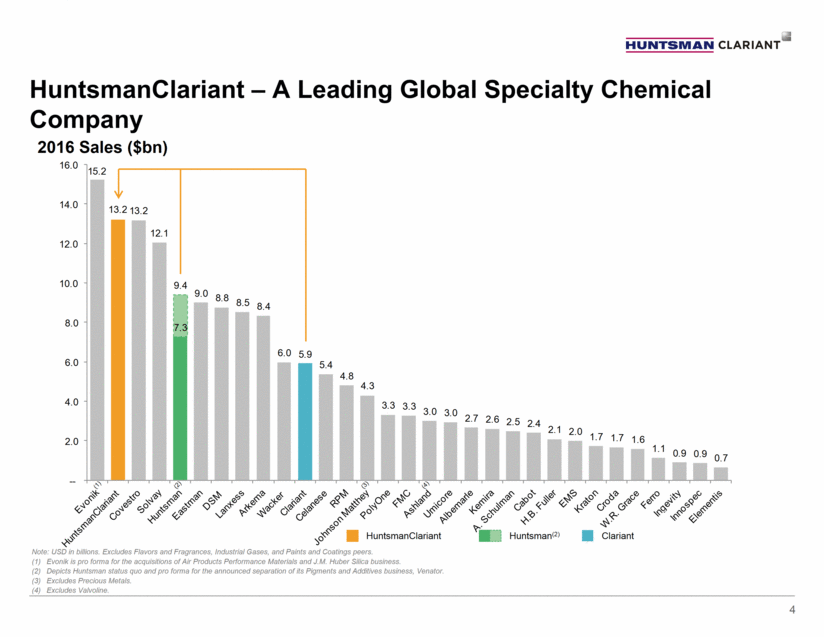
HuntsmanClariant – A Leading Global Specialty Chemical Company 2016 Sales ($bn) Note: USD in billions. Excludes Flavors and Fragrances, Industrial Gases, and Paints and Coatings peers. Evonik is pro forma for the acquisitions of Air Products Performance Materials and J.M. Huber Silica business. Depicts Huntsman status quo and pro forma for the announced separation of its Pigments and Additives business, Venator. Excludes Precious Metals. Excludes Valvoline. (2) (3) (1) (4) HuntsmanClariant Huntsman(2) Clariant 4 13.2 7.3 15.2 13.2 12.1 9.4 9.0 8.8 8.5 8.4 6.0 5.9 5.4 4.8 4.3 3.3 3.3 3.0 3.0 2.7 2.6 2.5 2.4 2.1 2.0 1.7 1.7 1.6 1.1 0.9 0.9 0.7 -- 2.0 4.0 6.0 8.0 10.0 12.0 14.0 16.0
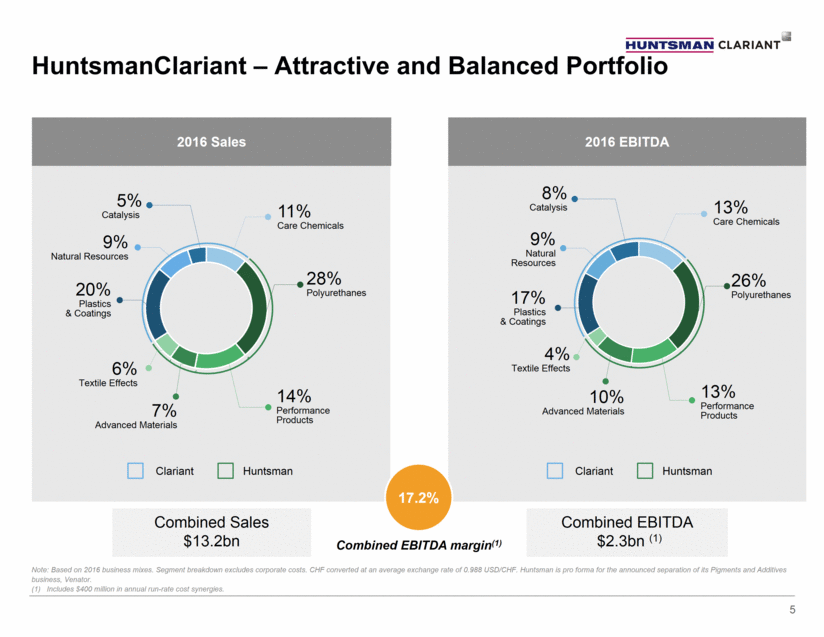
Combined EBITDA margin(1) HuntsmanClariant – Attractive and Balanced Portfolio 2016 Sales 2016 EBITDA 11% Care Chemicals 14% Performance Products 28% Polyurethanes 7% Advanced Materials 9% Natural Resources 5% Catalysis 6% Textile Effects 20% Plastics & Coatings 13% Care Chemicals 13% Performance Products 26% Polyurethanes 10% Advanced Materials 9% Natural Resources 8% Catalysis 4% Textile Effects 17% Plastics & Coatings Combined EBITDA $2.3bn (1) Combined Sales $13.2bn Note: Based on 2016 business mixes. Segment breakdown excludes corporate costs. CHF converted at an average exchange rate of 0.988 USD/CHF. Huntsman is pro forma for the announced separation of its Pigments and Additives business, Venator. (1) Includes $400 million in annual run-rate cost synergies. 17.2% Clariant Huntsman 5 Clariant Huntsman
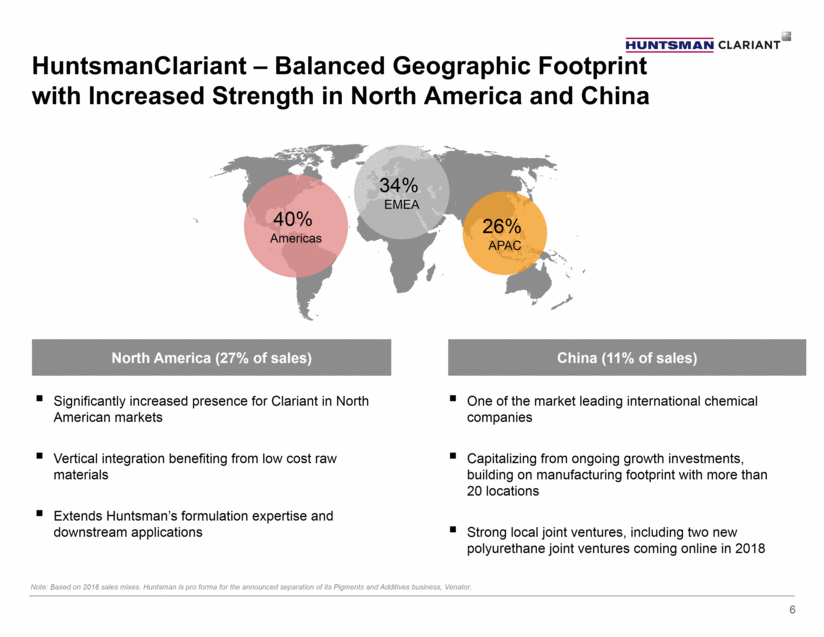
HuntsmanClariant – Balanced Geographic Footprint with Increased Strength in North America and China North America (27% of sales) China (11% of sales) Note: Based on 2016 sales mixes. Huntsman is pro forma for the announced separation of its Pigments and Additives business, Venator. Significantly increased presence for Clariant in North American markets Vertical integration benefiting from low cost raw materials Extends Huntsman’s formulation expertise and downstream applications 40% Americas 34% EMEA 26% APAC 6 One of the market leading international chemical companies Capitalizing from ongoing growth investments, building on manufacturing footprint with more than 20 locations Strong local joint ventures, including two new polyurethane joint ventures coming online in 2018
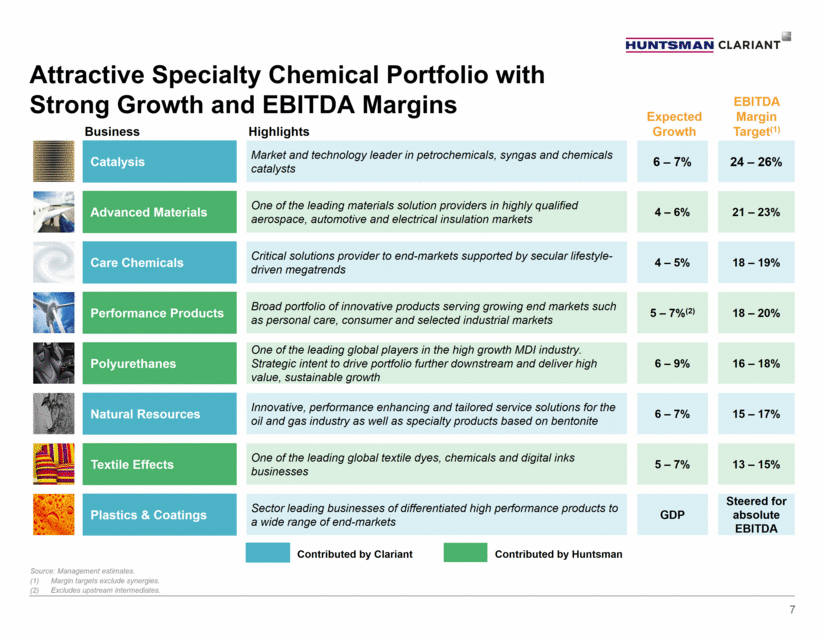
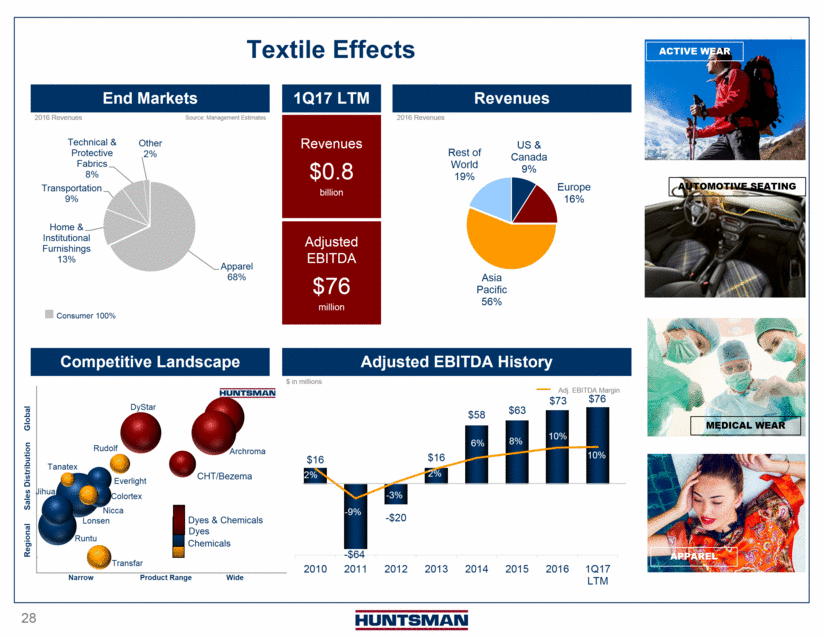
Focused on Key Growth Markets Contributed by Huntsman Business Contributed by Clariant Highlights Care Chemicals Critical solutions provider to end-markets supported by secular lifestyle-driven megatrends 4 – 5% 18 – 19% Natural Resources Innovative, performance enhancing and tailored service solutions for the oil and gas industry as well as specialty products based on bentonite 6 – 7% 15 – 17% Catalysis Market and technology leader in petrochemicals, syngas and chemicals catalysts 6 – 7% 24 – 26% Source: Management estimates. Margin targets exclude synergies. Excludes upstream intermediates. EBITDA Margin Target(1) Expected Growth Attractive Specialty Chemical Portfolio with Strong Growth and EBITDA Margins Polyurethanes One of the leading global players in the high growth MDI industry. Strategic intent to drive portfolio further downstream and deliver high value, sustainable growth 6 – 9% 16 – 18% Textile Effects One of the leading global textile dyes, chemicals and digital inks businesses 5 – 7% 13 – 15% Advanced Materials One of the leading materials solution providers in highly qualified aerospace, automotive and electrical insulation markets 4 – 6% 21 – 23% Plastics & Coatings Sector leading businesses of differentiated high performance products to a wide range of end-markets GDP Steered for absolute EBITDA Performance Products Broad portfolio of innovative products serving growing end markets such as personal care, consumer and selected industrial markets 5 – 7%(2) 18 – 20% 7
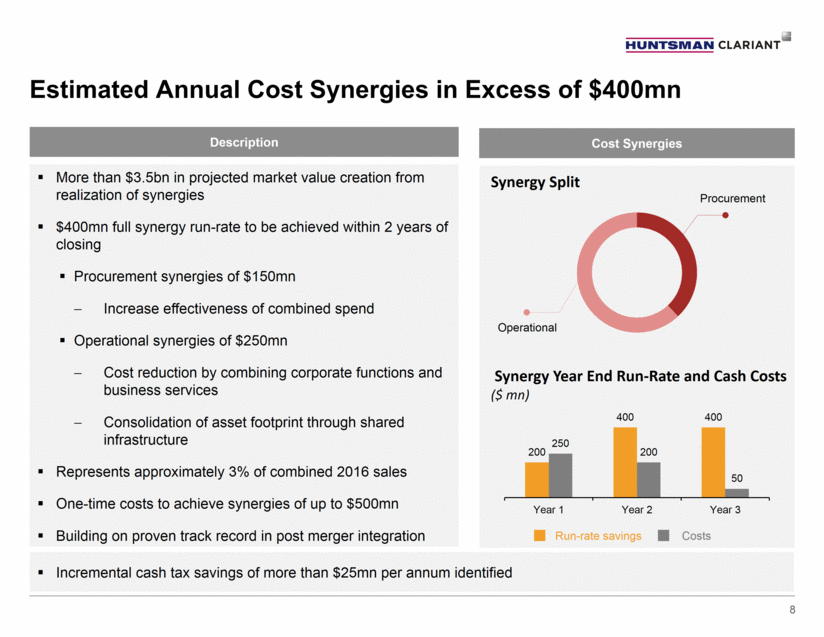
Estimated Annual Cost Synergies in Excess of $400mn Description Cost Synergies More than $3.5bn in projected market value creation from realization of synergies $400mn full synergy run-rate to be achieved within 2 years of closing Procurement synergies of $150mn Increase effectiveness of combined spend Operational synergies of $250mn Cost reduction by combining corporate functions and business services Consolidation of asset footprint through shared infrastructure Represents approximately 3% of combined 2016 sales One-time costs to achieve synergies of up to $500mn Building on proven track record in post merger integration Synergy Year End Run-Rate and Cash Costs ($ mn) Run-rate savings Costs Synergy Split Operational Procurement Incremental cash tax savings of more than $25mn per annum identified 8 200 400 400 250 200 50 Year 1 Year 2 Year 3
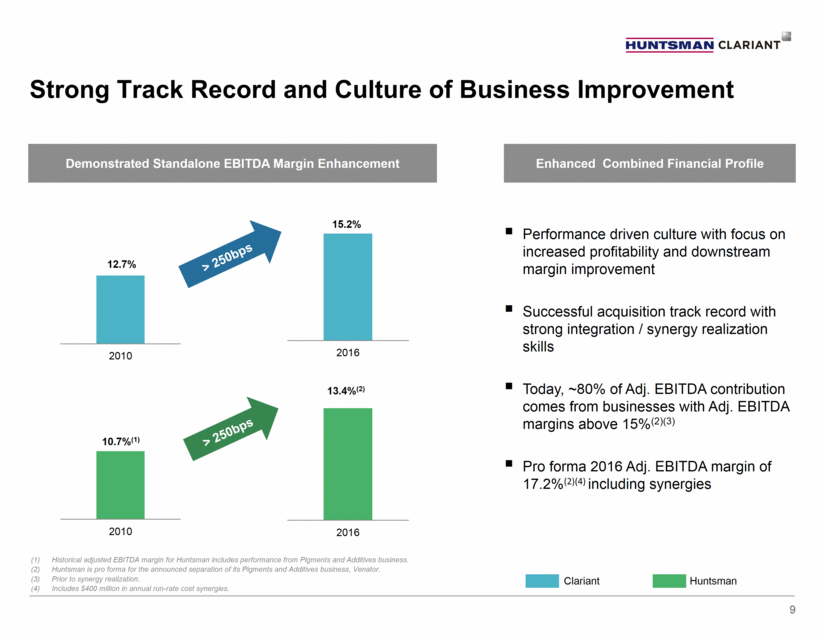
Strong Track Record and Culture of Business Improvement Demonstrated Standalone EBITDA Margin Enhancement Enhanced Combined Financial Profile Performance driven culture with focus on increased profitability and downstream margin improvement Successful acquisition track record with strong integration / synergy realization skills Today, ~80% of Adj. EBITDA contribution comes from businesses with Adj. EBITDA margins above 15%(2)(3) Pro forma 2016 Adj. EBITDA margin of 17.2%(2)(4) including synergies (1) Historical adjusted EBITDA margin for Huntsman includes performance from Pigments and Additives business. Huntsman is pro forma for the announced separation of its Pigments and Additives business, Venator. Prior to synergy realization. (4) Includes $400 million in annual run-rate cost synergies. Clariant Huntsman 15.2% > 250bps > 250bps 12.7% 10.7%(1) 13.4%(2) 9 2016 2016 2010 2010
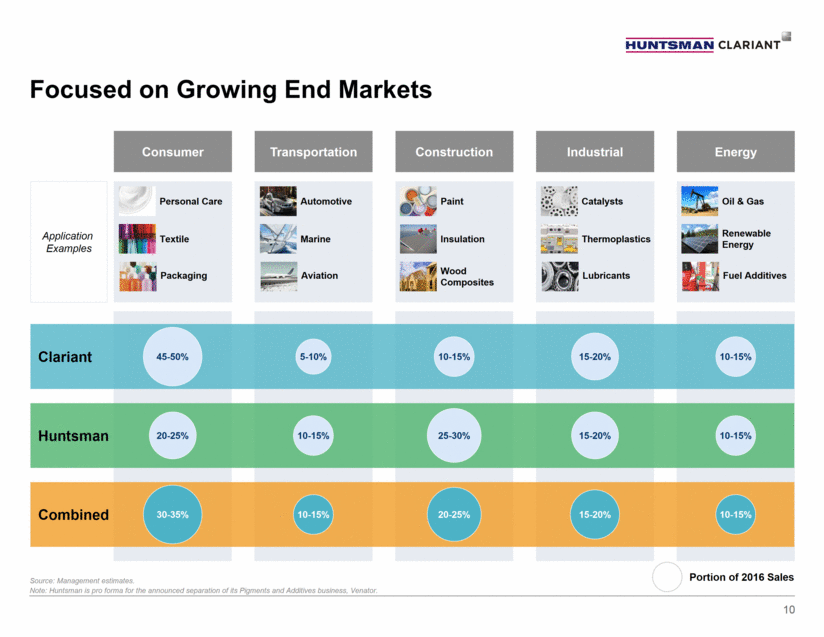
Focused on Growing End Markets Consumer Transportation Construction Industrial Energy Portion of 2016 Sales Application Examples Source: Management estimates. Note: Huntsman is pro forma for the announced separation of its Pigments and Additives business, Venator. Personal Care Textile Packaging Thermoplastics Catalysts Lubricants Oil & Gas Renewable Energy Fuel Additives Aviation Marine Automotive Paint Insulation Wood Composites Growth Outlook [4 – 5%] [4 – 5%] [4 – 5%] [4 – 5%] [4 – 5%] Huntsman Combined Clariant 20-25% 30-35% 25-30% 10-15% 45-50% 5-10% 10-15% 15-20% 10-15% 15-20% 20-25% 10-15% 10-15% 15-20% 10-15% 10
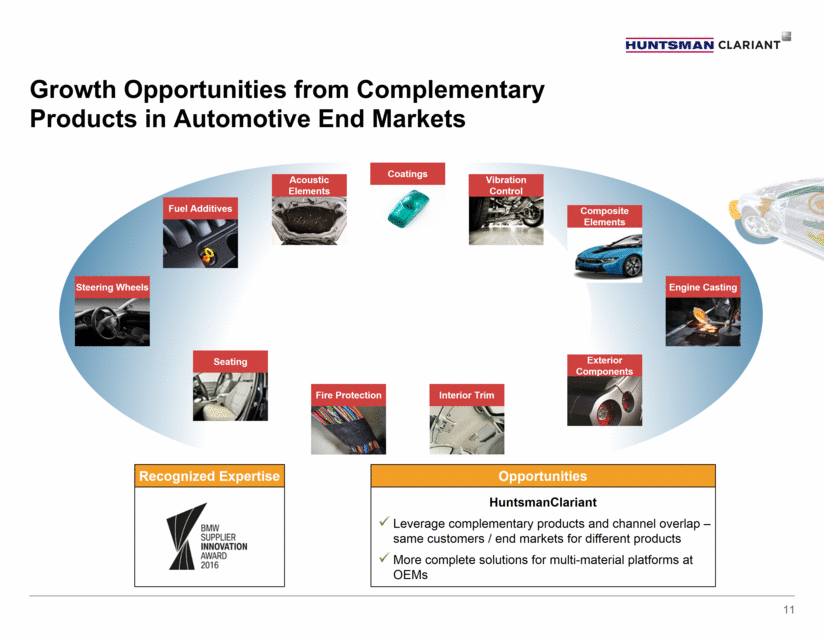
Focused on Key Growth Markets HuntsmanClariant Leverage complementary products and channel overlap – same customers / end markets for different products More complete solutions for multi-material platforms at OEMs Vibration Control Steering Wheels Interior Trim Growth Opportunities from Complementary Products in Automotive End Markets Seating Recognized Expertise Opportunities Acoustic Elements Fuel Additives Fire Protection Coatings Engine Casting Composite Elements 11 Exterior Components
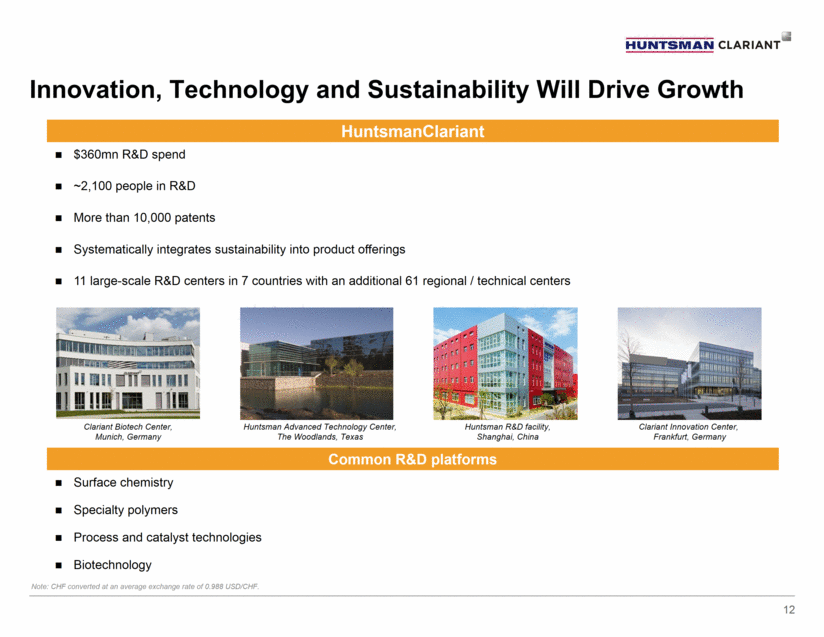
Innovation, Technology and Sustainability Will Drive Growth Note: CHF converted at an average exchange rate of 0.988 USD/CHF. HuntsmanClariant Clariant Biotech Center, Munich, Germany Clariant Innovation Center, Frankfurt, Germany Huntsman R&D facility, Shanghai, China Huntsman Advanced Technology Center, The Woodlands, Texas $360mn R&D spend ~2,100 people in R&D More than 10,000 patents Systematically integrates sustainability into product offerings 11 large-scale R&D centers in 7 countries with an additional 61 regional / technical centers Common R&D platforms Surface chemistry Specialty polymers Process and catalyst technologies Biotechnology 12
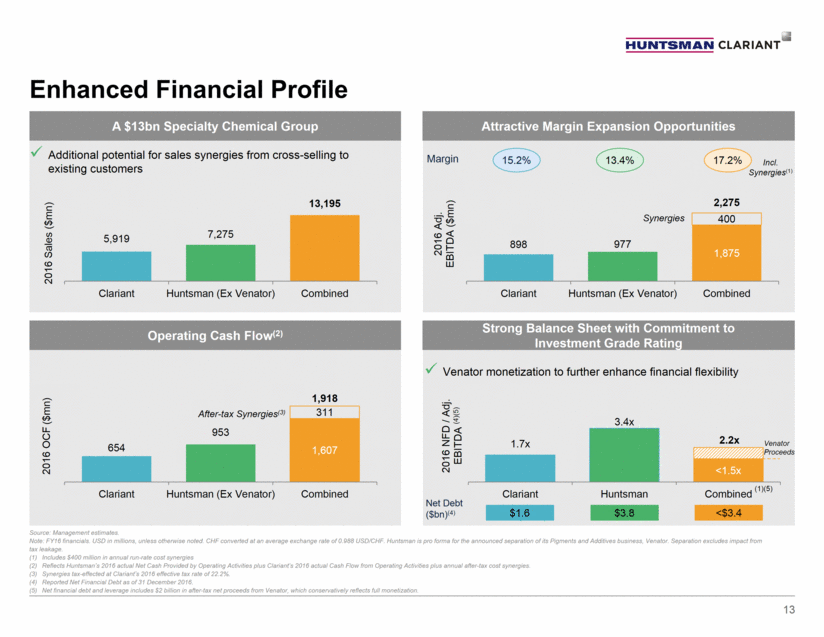
Enhanced Financial Profile A $13bn Specialty Chemical Group Attractive Margin Expansion Opportunities Operating Cash Flow(2) Strong Balance Sheet with Commitment to Investment Grade Rating Additional potential for sales synergies from cross-selling to existing customers Margin 15.2% 13.4% 17.2% Synergies After-tax Synergies(3) Venator monetization to further enhance financial flexibility Source: Management estimates. Note: FY16 financials. USD in millions, unless otherwise noted. CHF converted at an average exchange rate of 0.988 USD/CHF. Huntsman is pro forma for the announced separation of its Pigments and Additives business, Venator. Separation excludes impact from tax leakage. (1) Includes $400 million in annual run-rate cost synergies (2) Reflects Huntsman’s 2016 actual Net Cash Provided by Operating Activities plus Clariant’s 2016 actual Cash Flow from Operating Activities plus annual after-tax cost synergies. (3) Synergies tax-effected at Clariant’s 2016 effective tax rate of 22.2%. (4) Reported Net Financial Debt as of 31 December 2016. (5) Net financial debt and leverage includes $2 billion in after-tax net proceeds from Venator, which conservatively reflects full monetization. Venator Proceeds $1.6 $3.8 <$3.4 Net Debt ($bn)(4) Incl. Synergies(1) (1)(5) 13 898 977 1,875 400 2,275 Clariant Huntsman (Ex Venator) Combined 2016 Adj. EBITDA ($ mn ) 1.7x 3.4x <1.5x 2.2x Clariant Huntsman Combined 2016 NFD / Adj. EBITDA (4)(5) 654 953 1,607 311 1,918 Clariant Huntsman (Ex Venator) Combined 2016 OCF ($ mn ) 5,919 7,275 13,195 Clariant Huntsman (Ex Venator) Combined 2016 Sales ($ mn )
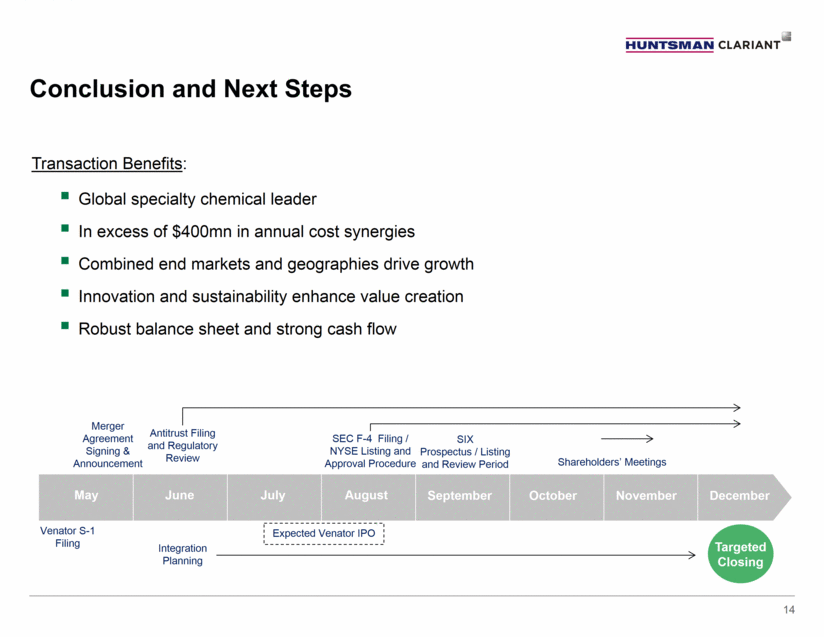
Shareholders’ Meetings Key Investment Highlights Conclusion and Next Steps Transaction Benefits: Global specialty chemical leader In excess of $400mn in annual cost synergies Combined end markets and geographies drive growth Innovation and sustainability enhance value creation Robust balance sheet and strong cash flow SEC F-4 Filing / NYSE Listing and Approval Procedure Antitrust Filing and Regulatory Review Venator S-1 Filing Expected Venator IPO SIX Prospectus / Listing and Review Period Merger Agreement Signing & Announcement Targeted Closing May June July August September December November October Integration Planning 14
Appendix 15
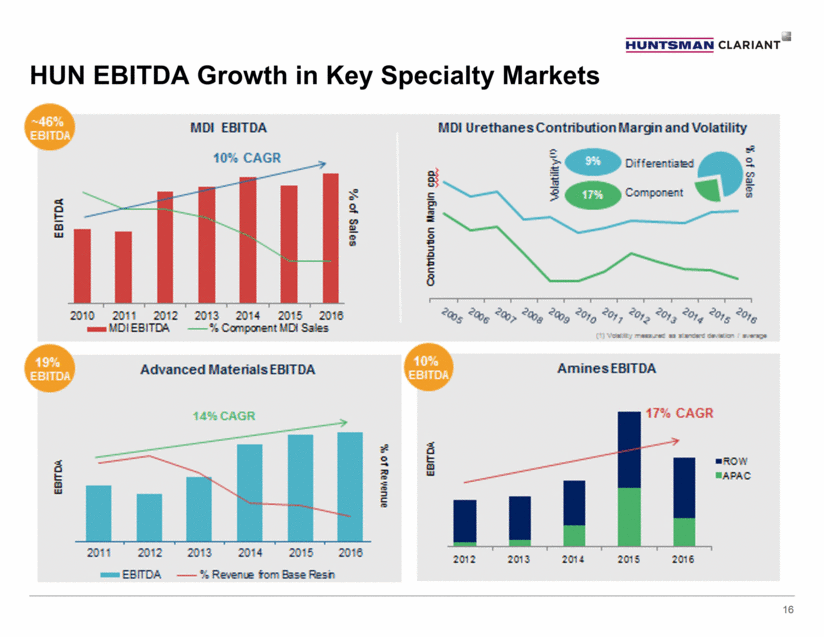
Focused on Key Growth Markets HUN EBITDA Growth in Key Specialty Markets 16
Formulations / Markets Focused on Key Growth Markets HUN Performance Products / CLN Care Chemicals & Natural Resources – Moving Products Downstream into Formulations North America 17 Oilfield Services Personal Care Agriculture Europe Oilfield Services Personal Care Agriculture Care Chemicals 19% CHF 270mn Performance Products 55% USD 1,033mn HUN CLN Huntsman’s Gulf Coast advantaged EO production and large commercial position in North America provides vertical integration for Clariant to mirror its European market leading position. Clariant’s formulation technology allows Huntsman’s component / intermediate products to be further differentiated. The combination of Huntsman’s component products technology and Clariant’s formulation technology will result in faster product development and a more complete product offering to customers. Care Chemicals 44% CHF 638mn Performance Products 17% USD 322mn HUN CLN Components Raw Materials EO 1,365 mlbs (620 ktes) PO 525 mlbs (240 ktes) EO 550 mlbs (250 ktes) % Sales in Region(1) Surfactants Amines Surfactants Amines (1) Pro forma adjusted for the sale of the European Surfactants business on December 30, 2016.
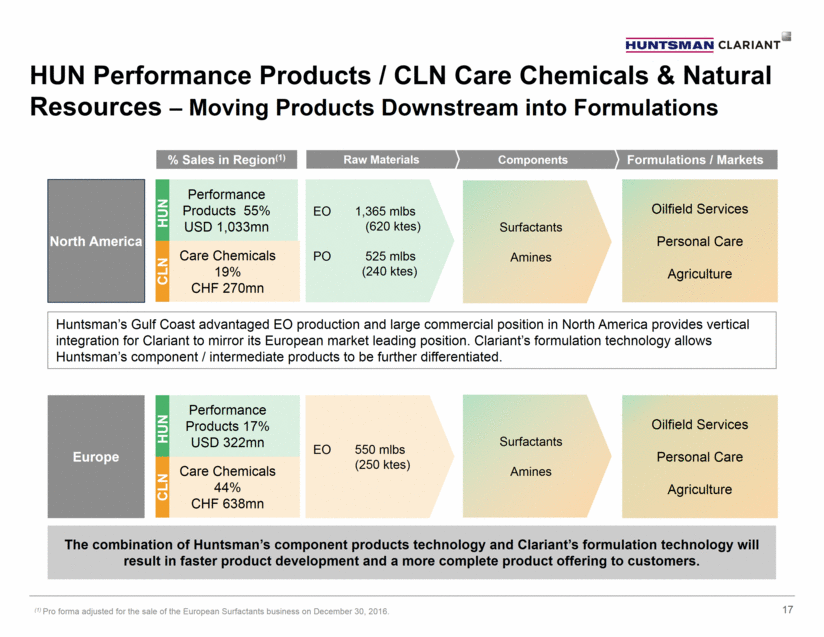
Steam cracker Propylene glycols Propylene carbonates Ethylene glycols Ethylene carbonates EO Ethylene Specialized products Raw Materials & Intermediates Propylene Huntsman’s Performance Products Ethoxylates PO Amines EO Ethoyxlates Externally sourced Clariant’s Care Chemicals Propoxylates Amines Ethylene glycols Glycol ethers EO Ethylene Amines Ethoxylates Betaines PO Strong complementary EO based footprint in the US Gulf Coast and Europe Huntsman is backward integrated into EO in the US, Clariant buys EO as raw material Clariant is backward integrated into EO in Europe, Huntsman buys EO as raw material Additional potential for asset utilization in China, India, Australia Glycol ethers Huntsman’s and Clariant’s Complementary Production Value Chain Will Drive Synergies Highlights Production Value Chain US Specialized products Raw Materials & Intermediates Production Value Chain Europe 18 Source: Management
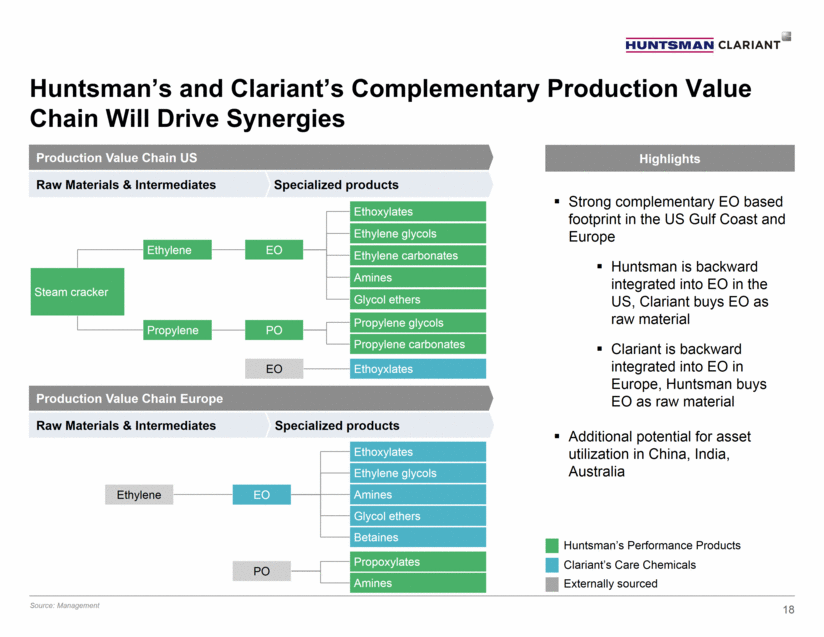
Estimated Annual Cost Synergies in Excess of $400mn 19 Procurement ~$150mn Corporate Office, and Asset Consolidation (~$200mn) Other Operational (~$50mn) Cash tax savings in excess of $25 million from optimizing the use of combined NOLs Source: Management estimates. Operational ~$250mn Optimization of production Leveraging of best practices and functional excellence Streamlining of corporate and functional organization (HR, IT, Finance, etc.) including elimination of duplicated roles Integration of regional non operating assets (e.g. regional centers in the USA, South America, Europe, APAC) Leverage combined IT platforms Full $400 mn run rate to be achieved by end of 2019 Direct spend (~$50mn) Indirect spend (~$100mn) Optimize annual combined spend of ~$3.6 billion supplies by bundling volume, standardization and renegotiating terms and conditions Optimize purchasing on ~$5.5 billion of combined annual material supplies by bundling volume, renegotiating terms and conditions, insourcing of raw materials ~25% spend overlap of top 50 products and ~30% overlap in top 50 suppliers
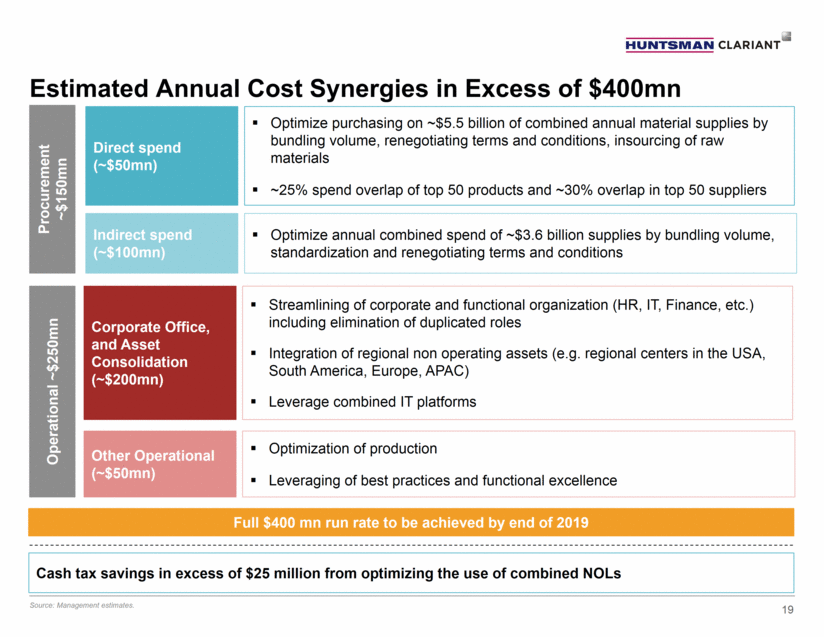
Integration Case Studies: CLN / Süd-Chemie & HUN / Rockwood Clariant / Süd-Chemie Integration Highlights Announced synergies ~6% of Süd-Chemie sales(3) with little/no business overlap Realized ~20% more cost savings compared to announced cost savings Integration ~10% below budget Integration and synergies realization achieved faster than originally planned Source: Company filings and management estimates. Synergies and costs as announced in February 2011 As of December 2013 Süd-Chemie 2010 sales of EUR 1,225mn Approximate EBITDA impact from fire at Pori, Finland in 1Q17 was ~$15mn. 20 Operational Excellence (1) (2) + ~20% G&A Operational Excellence G&A Cost Savings (CHF mn) Huntsman / Rockwood +>60% Announced synergies of ~10% of Rockwood sales Cost savings delivered with in 21 months of deal completion, ahead of schedule Reduced working capital by ~20% 1Q17 vs. 1Q15 Pigments & Additives EBITDA clearly demonstrates cost reduction (+63mn PF(4)) notwithstanding lower commodity TiO2 pricing 96 Announced Synergies 115 Implemented Synergies 130 Announced Synergies >205 Implemented Synergies
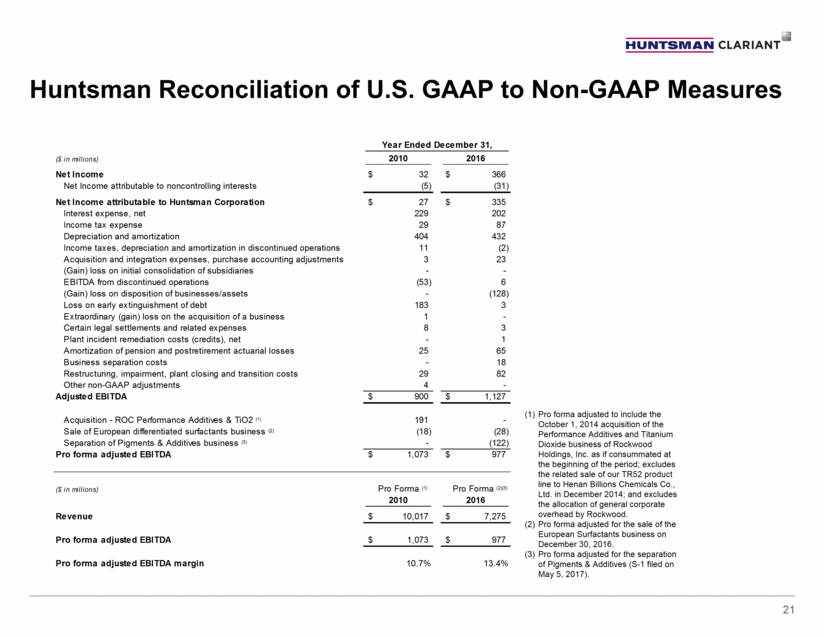
Huntsman Reconciliation of U.S. GAAP to Non-GAAP Measures Pro forma adjusted to include the October 1, 2014 acquisition of the Performance Additives and Titanium Dioxide business of Rockwood Holdings, Inc. as if consummated at the beginning of the period; excludes the related sale of our TR52 product line to Henan Billions Chemicals Co., Ltd. in December 2014; and excludes the allocation of general corporate overhead by Rockwood. Pro forma adjusted for the sale of the European Surfactants business on December 30, 2016. Pro forma adjusted for the separation of Pigments & Additives (S-1 filed on May 5, 2017). 21 Year Ended December 31, ($ in millions) 2010 2016 Net Income 32 $ 366 $ Net Income attributable to noncontrolling interests (5) (31) Net Income attributable to Huntsman Corporation 27 $ 335 $ Interest expense, net 229 202 Income tax expense 29 87 Depreciation and amortization 404 432 Income taxes, depreciation and amortization in discontinued operations 11 (2) Acquisition and integration expenses, purchase accounting adjustments 3 23 (Gain) loss on initial consolidation of subsidiaries - - EBITDA from discontinued operations (53) 6 (Gain) loss on disposition of businesses/assets - (128) Loss on early extinguishment of debt 183 3 Extraordinary (gain) loss on the acquisition of a business 1 - Certain legal settlements and related expenses 8 3 Plant incident remediation costs (credits), net - 1 Amortization of pension and postretirement actuarial losses 25 65 Business separation costs - 18 Restructuring, impairment, plant closing and transition costs 29 82 Other non-GAAP adjustments 4 - Adjusted EBITDA 900 $ 1,127 $ Acquisition - ROC Performance Additives & TiO2 (1) 191 - Sale of European differentiated surfactants business (2) (18) (28) Separation of Pigments & Additives business (3) - (122) Pro forma adjusted EBITDA 1,073 $ 977 $ ($ in millions) Pro Forma (1) Pro Forma (2)(3) 2010 2016 Revenue 10,017 $ 7,275 $ Pro forma adjusted EBITDA 1,073 $ 977 $ Pro forma adjusted EBITDA margin 10.7% 13.4%
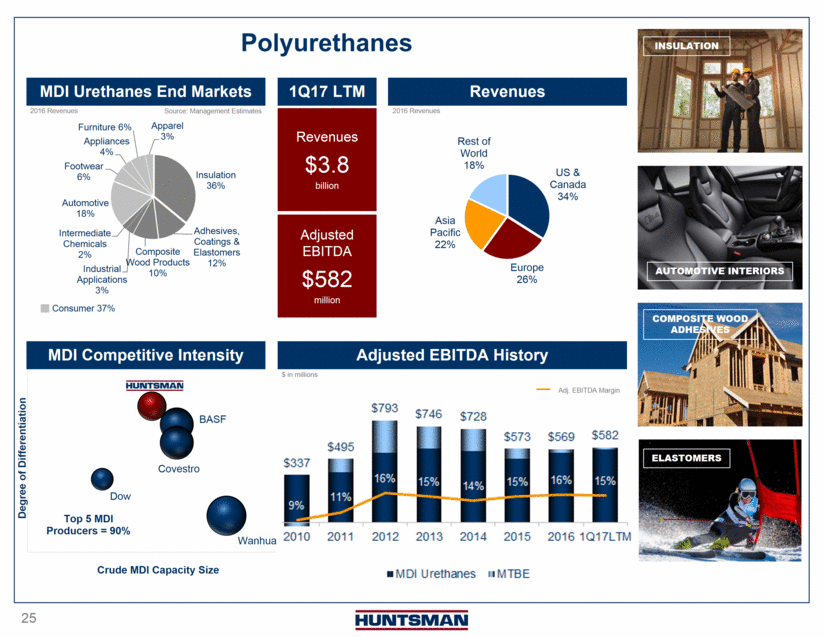
Polyurethanes MDI Urethanes End Markets Revenues MDI Competitive Intensity Adjusted EBITDA History 1Q17 LTM Revenues $3.8 billion Adjusted EBITDA $582 million 2016 Revenues 2016 Revenues $ in millions Source: Management Estimates Consumer 37% INSULATION ELASTOMERS AUTOMOTIVE INTERIORS COMPOSITE WOOD ADHESIVES
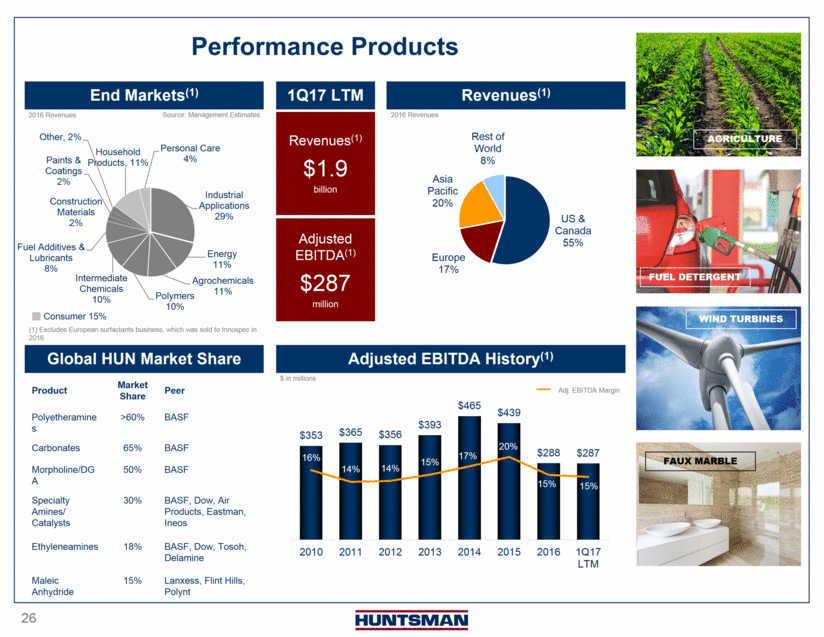
Performance Products End Markets(1) Revenues(1) Global HUN Market Share Adjusted EBITDA History(1) 1Q17 LTM Revenues(1) $1.9 billion Adjusted EBITDA(1) $287 million 2016 Revenues 2016 Revenues $ in millions Source: Management Estimates Consumer 15% Product Market Share Peer Polyetheramines >60% BASF Carbonates 65% BASF Morpholine/DGA 50% BASF Specialty Amines/ Catalysts 30% BASF, Dow, Air Products, Eastman, Ineos Ethyleneamines 18% BASF, Dow, Tosoh, Delamine Maleic Anhydride 15% Lanxess, Flint Hills, Polynt FUEL DETERGENT AGRICULTURE FAUX MARBLE WIND TURBINES (1) Excludes European surfactants business, which was sold to Innospec in 2016
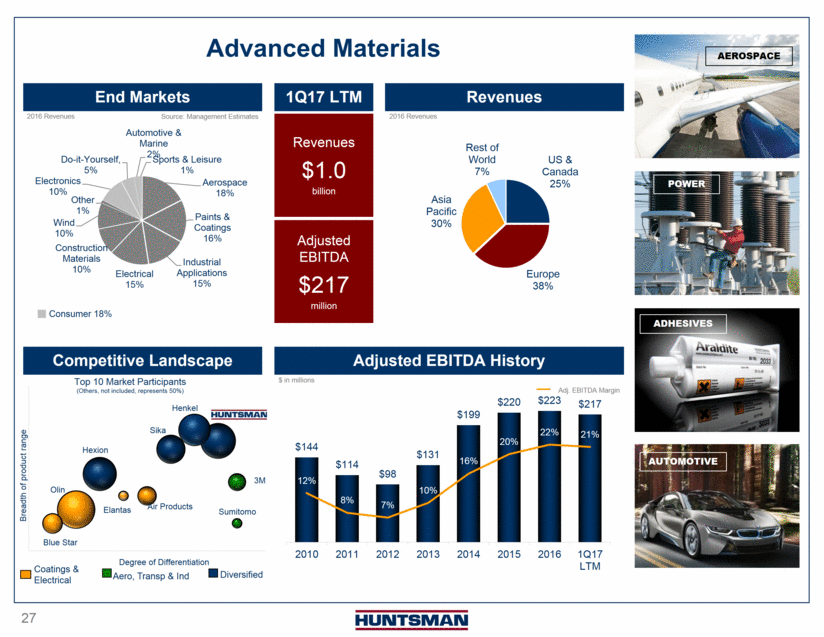
Aero, Transp & Ind Advanced Materials End Markets Revenues Competitive Landscape Adjusted EBITDA History 1Q17 LTM Revenues $1.0 billion Adjusted EBITDA $217 million 2016 Revenues 2016 Revenues $ in millions Source: Management Estimates Consumer 18% Coatings & Electrical Diversified AUTOMOTIVE ADHESIVES AEROSPACE POWER Hexion Sika Henkel 3M Sumitomo Elantas Air Products Olin Blue Star Breadth of product range Degree of Differentiation Top 10 Market Participants (Others, not included, represents 50%)
Textile Effects End Markets Revenues Competitive Landscape Adjusted EBITDA History 1Q17 LTM Revenues $0.8 billion Adjusted EBITDA $76 million 2016 Revenues 2016 Revenues $ in millions Source: Management Estimates Consumer 100% AUTOMOTIVE SEATING APPAREL Dyes & Chemicals Chemicals Dyes Regional Sales Distribution Global CHT/Bezema ACTIVE WEAR AUTOMOTIVE SEATING MEDICAL WEAR APPAREL DyStar Archroma Lonsen Everlight Runtu Colortex Rudolf Nicca Transfar Tanatex Jihua Narrow Product Range Wide
Clariant Equity Story 2017
Disclaimer Equity Story Clariant 2017 30 This presentation contains certain statements that are neither reported financial results nor other historical information. This presentation also includes forward-looking statements. Because these forward-looking statements are subject to risks and uncertainties, actual future results may differ materially from those expressed in or implied by the statements. Many of these risks and uncertainties relate to factors that are beyond Clariant’s ability to control or estimate precisely, such as future market conditions, currency fluctuations, the behaviour of other market participants, the actions of governmental regulators and other risk factors such as: the timing and strength of new product offerings; pricing strategies of competitors; the Company's ability to continue to receive adequate products from its vendors on acceptable terms, or at all, and to continue to obtain sufficient financing to meet its liquidity needs; and changes in the political, social and regulatory framework in which the Company operates or in economic or technological trends or conditions, including currency fluctuations, inflation and consumer confidence, on a global, regional or national basis. Readers are cautioned not to place undue reliance on these forward-looking statements, which apply only as of the date of this document. Clariant does not undertake any obligation to publicly release any revisions to these forward-looking statements to reflect events or circumstances after the date of these materials.
Table of Contents Equity Story Clariant 2017 31 Who we are Objectives and Strategy Innovation and Sustainability Financial Excellence Highly Experienced Management Summary Outlook
Who we are
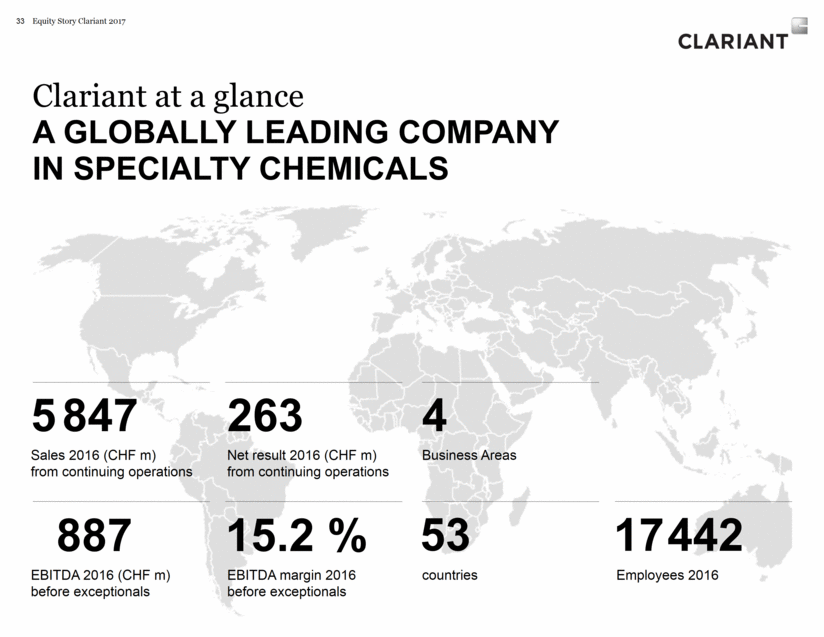
Clariant at a glance A GLOBALLY LEADING COMPANY IN SPECIALTY CHEMICALS Equity Story Clariant 2017 33 Business Areas Net result 2016 (CHF m) from continuing operations Sales 2016 (CHF m) from continuing operations 5 847 263 4 17 442 EBITDA 2016 (CHF m) before exceptionals 15.2 % 887 EBITDA margin 2016 before exceptionals 53 countries Employees 2016
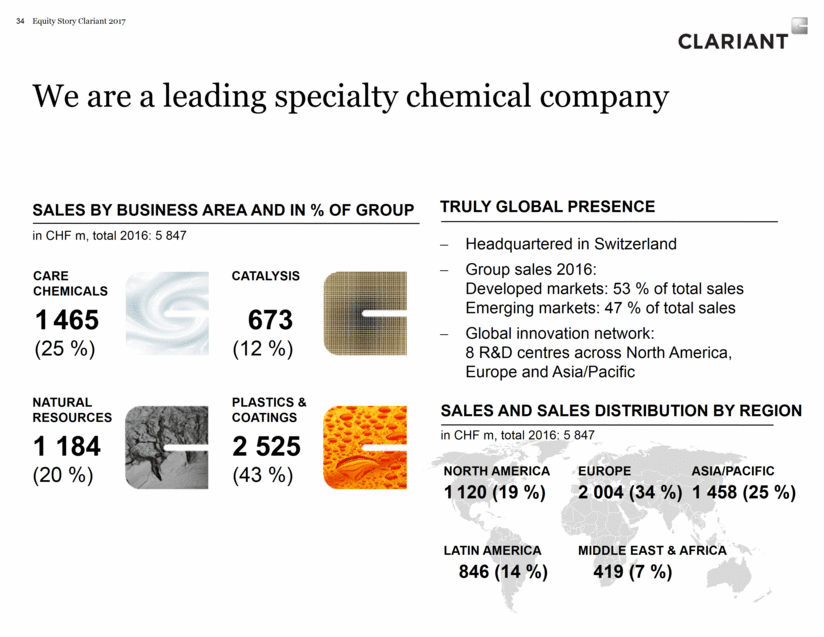
We are a leading specialty chemical company 34 Sales by business area and in % of group in CHF m, total 2016: 5 847 Truly Global Presence Sales and Sales Distribution by region in CHF m, total 2016: 5 847 419 (7 %) Middle East & Africa 846 (14 %) Latin America 2 004 (34 %) europe 1 458 (25 %) Asia/Pacific 1 120 (19 %) North america 1 465 (25 %) 673 (12 %) 1 184 (20 %) 2 525 (43 %) Care Chemicals Catalysis Natural Resources Plastics & Coatings Headquartered in Switzerland Group sales 2016: Developed markets: 53 % of total sales Emerging markets: 47 % of total sales Global innovation network: 8 R&D centres across North America, Europe and Asia/Pacific Equity Story Clariant 2017
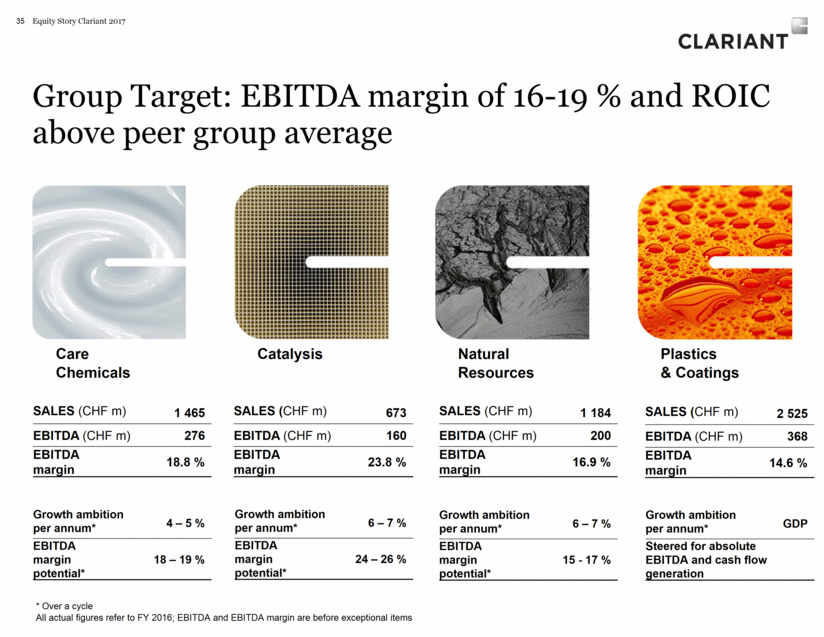
Group Target: EBITDA margin of 16-19 % and ROIC above peer group average Equity Story Clariant 2017 35 Care Chemicals Catalysis Natural Resources Plastics & Coatings SALES (CHF m) 1 465 EBITDA (CHF m) 276 EBITDA margin 18.8 % * Over a cycle All actual figures refer to FY 2016; EBITDA and EBITDA margin are before exceptional items SALES (CHF m) 673 EBITDA (CHF m) 160 EBITDA margin 23.8 % SALES (CHF m) 1 184 EBITDA (CHF m) 200 EBITDA margin 16.9 % SALES (CHF m) 2 525 EBITDA (CHF m) 368 EBITDA margin 14.6 % Growth ambition per annum* 4 – 5 % EBITDA margin potential* 18 – 19 % Growth ambition per annum* 6 – 7 % EBITDA margin potential* 24 – 26 % Growth ambition per annum* 6 – 7 % EBITDA margin potential* 15 - 17 % Growth ambition per annum* GDP Steered for absolute EBITDA and cash flow generation
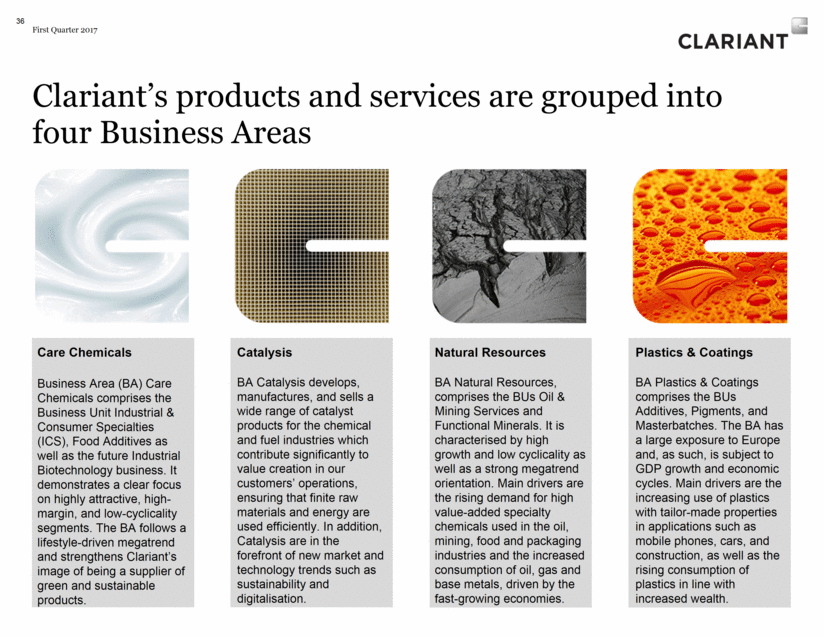
Clariant’s products and services are grouped into four Business Areas First Quarter 2017 36 Natural Resources BA Natural Resources, comprises the BUs Oil & Mining Services and Functional Minerals. It is characterised by high growth and low cyclicality as well as a strong megatrend orientation. Main drivers are the rising demand for high value-added specialty chemicals used in the oil, mining, food and packaging industries and the increased consumption of oil, gas and base metals, driven by the fast-growing economies. Plastics & Coatings BA Plastics & Coatings comprises the BUs Additives, Pigments, and Masterbatches. The BA has a large exposure to Europe and, as such, is subject to GDP growth and economic cycles. Main drivers are the increasing use of plastics with tailor-made properties in applications such as mobile phones, cars, and construction, as well as the rising consumption of plastics in line with increased wealth. Care Chemicals Business Area (BA) Care Chemicals comprises the Business Unit Industrial & Consumer Specialties (ICS), Food Additives as well as the future Industrial Biotechnology business. It demonstrates a clear focus on highly attractive, high- margin, and low-cyclicality segments. The BA follows a lifestyle-driven megatrend and strengthens Clariant’s image of being a supplier of green and sustainable products. Catalysis BA Catalysis develops, manufactures, and sells a wide range of catalyst products for the chemical and fuel industries which contribute significantly to value creation in our customers’ operations, ensuring that finite raw materials and energy are used efficiently. In addition, Catalysis are in the forefront of new market and technology trends such as sustainability and digitalisation.
Objectives and Strategy
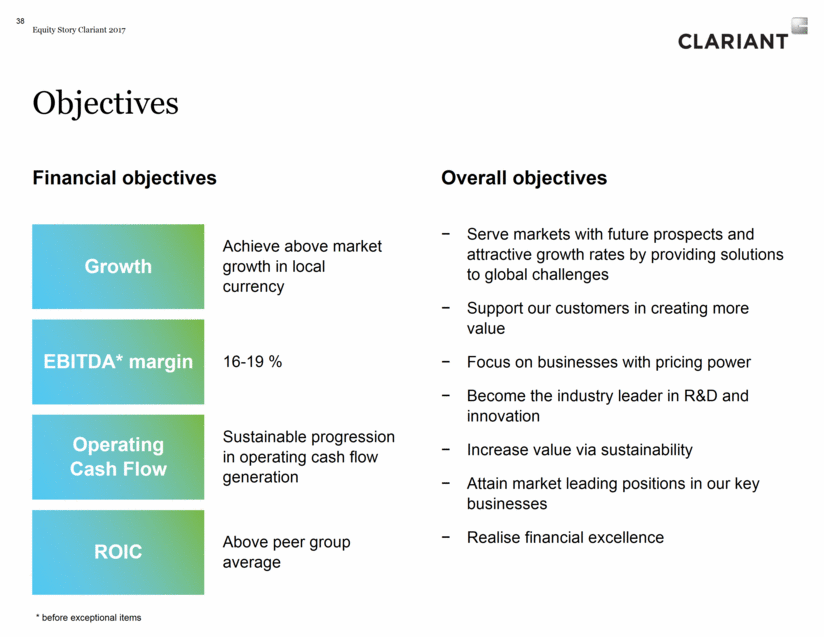
Financial objectives Growth EBITDA* margin Operating Cash Flow Achieve above market growth in local currency 16-19 % Sustainable progression in operating cash flow generation 38 ROIC Above peer group average Objectives Overall objectives Serve markets with future prospects and attractive growth rates by providing solutions to global challenges Support our customers in creating more value Focus on businesses with pricing power Become the industry leader in R&D and innovation Increase value via sustainability Attain market leading positions in our key businesses Realise financial excellence * before exceptional items Equity Story Clariant 2017
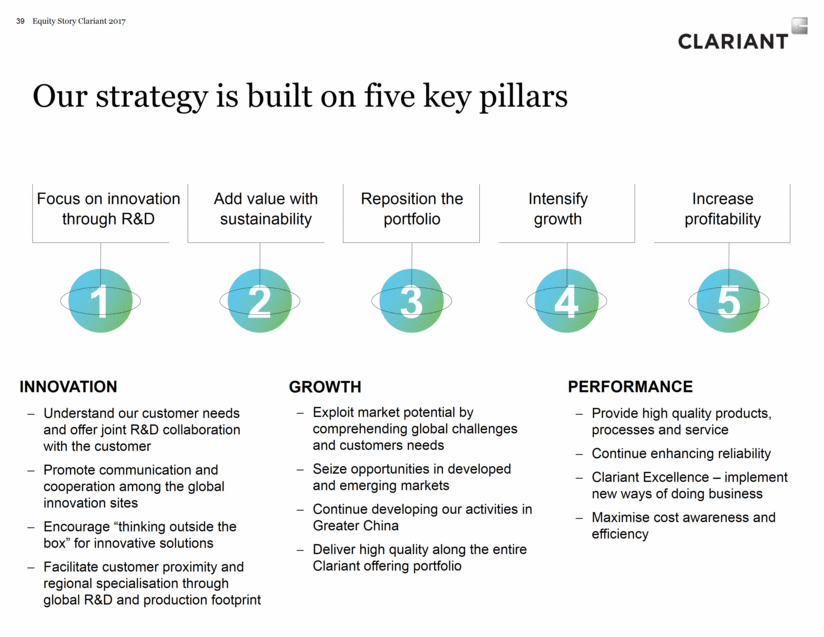
Equity Story Clariant 2017 39 Focus on innovation through R&D Add value with sustainability Reposition the portfolio Intensify growth Increase profitability 1 2 3 4 5 Our strategy is built on five key pillars INNOVATION Understand our customer needs and offer joint R&D collaboration with the customer Promote communication and cooperation among the global innovation sites Encourage “thinking outside the box” for innovative solutions Facilitate customer proximity and regional specialisation through global R&D and production footprint GROWTH Exploit market potential by comprehending global challenges and customers needs Seize opportunities in developed and emerging markets Continue developing our activities in Greater China Deliver high quality along the entire Clariant offering portfolio PERFORMANCE Provide high quality products, processes and service Continue enhancing reliability Clariant Excellence – implement new ways of doing business Maximise cost awareness and efficiency
Innovation & Sustainability
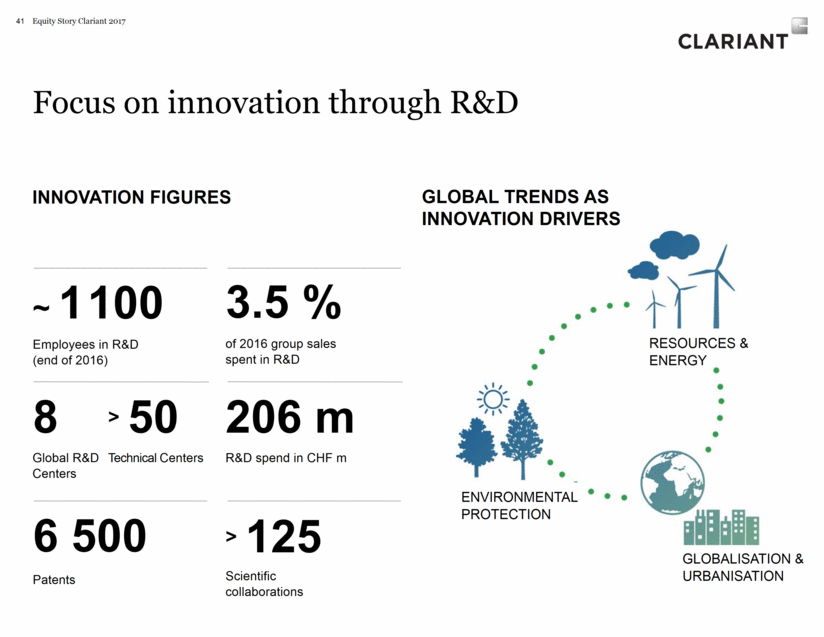
Focus on innovation through R&D Equity Story Clariant 2017 41 Innovation figures ~ 1 100 6 500 3.5 % of 2016 group sales spent in R&D 206 m R&D spend in CHF m > 125 Employees in R&D (end of 2016) Patents Scientific collaborations Global R&D Centers 8 Technical Centers > 50 GLOBAL TRENDS as innovation drivers EnvironmentAL protection GlobaliSation & UrbaniSation resources & energy
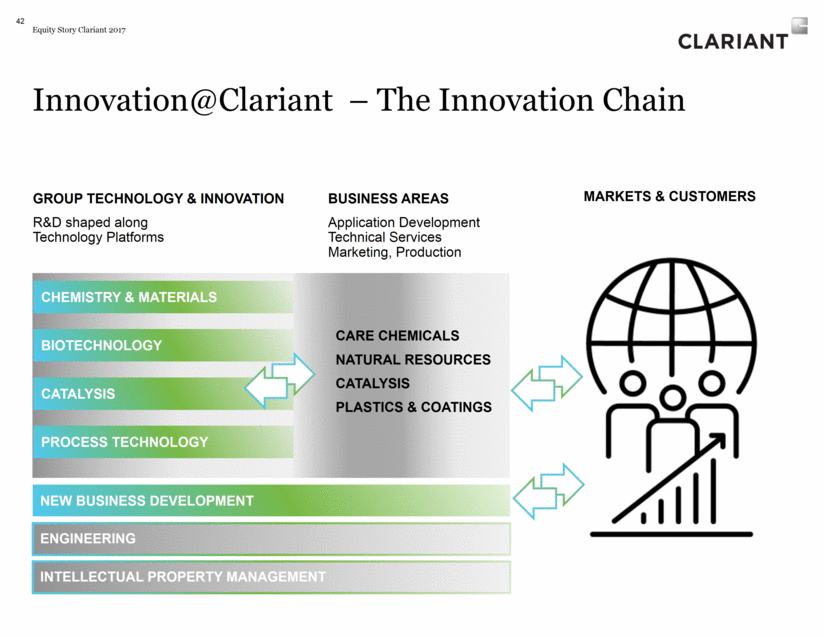
Equity Story Clariant 2017 42 Application Development Technical Services Marketing, Production R&D shaped along Technology Platforms Innovation@Clariant – The Innovation Chain Group Technology & Innovation Business AREAS Markets & Customers Engineering Intellectual Property Management New Business Development Chemistry & Materials Biotechnology Catalysis Process Technology Care Chemicals Natural Resources Catalysis Plastics & Coatings
Targeting sustainable standards and solutions Increasing customer and market awareness of and sensitivity to sustainability Striving for sustainable standards and supporting customers to create value by applying our expertise and knowledge in chemistry, technology and service enhancing customer’s sustainability and thus competitiveness Our promise is to offer innovative products and technologies maintain an ethical and responsible business culture We enhance value along the value chain e.g. our Catofin® catalyst for on-purpose propylene and butylene production further reduces energy input requirements, lessens by-products and in turn amplifies the product’s yield more than any other competing technology Targeting a portfolio of products and solutions that helps protect the environment Equity Story Clariant 2017 43
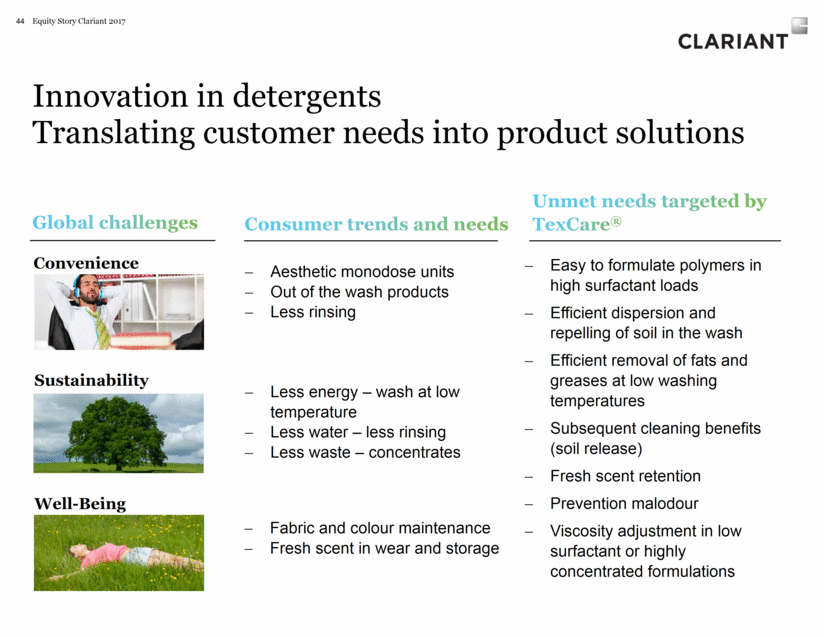
Innovation in detergents Translating customer needs into product solutions Equity Story Clariant 2017 44 Aesthetic monodose units Out of the wash products Less rinsing Less energy – wash at low temperature Less water – less rinsing Less waste – concentrates Fabric and colour maintenance Fresh scent in wear and storage Easy to formulate polymers in high surfactant loads Efficient dispersion and repelling of soil in the wash Efficient removal of fats and greases at low washing temperatures Subsequent cleaning benefits (soil release) Fresh scent retention Prevention malodour Viscosity adjustment in low surfactant or highly concentrated formulations Convenience Sustainability Well-Being Global challenges Consumer trends and needs Unmet needs targeted by TexCare®
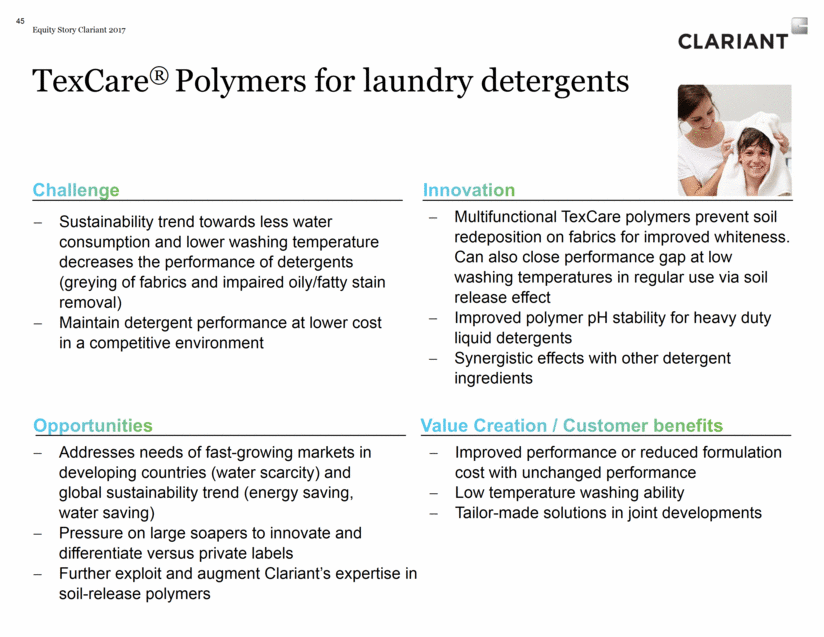
45 TexCare® Polymers for laundry detergents Multifunctional TexCare polymers prevent soil redeposition on fabrics for improved whiteness. Can also close performance gap at low washing temperatures in regular use via soil release effect Improved polymer pH stability for heavy duty liquid detergents Synergistic effects with other detergent ingredients Challenge Opportunities Addresses needs of fast-growing markets in developing countries (water scarcity) and global sustainability trend (energy saving, water saving) Pressure on large soapers to innovate and differentiate versus private labels Further exploit and augment Clariant’s expertise in soil-release polymers Innovation Improved performance or reduced formulation cost with unchanged performance Low temperature washing ability Tailor-made solutions in joint developments Value Creation / Customer benefits Sustainability trend towards less water consumption and lower washing temperature decreases the performance of detergents (greying of fabrics and impaired oily/fatty stain removal) Maintain detergent performance at lower cost in a competitive environment Equity Story Clariant 2017
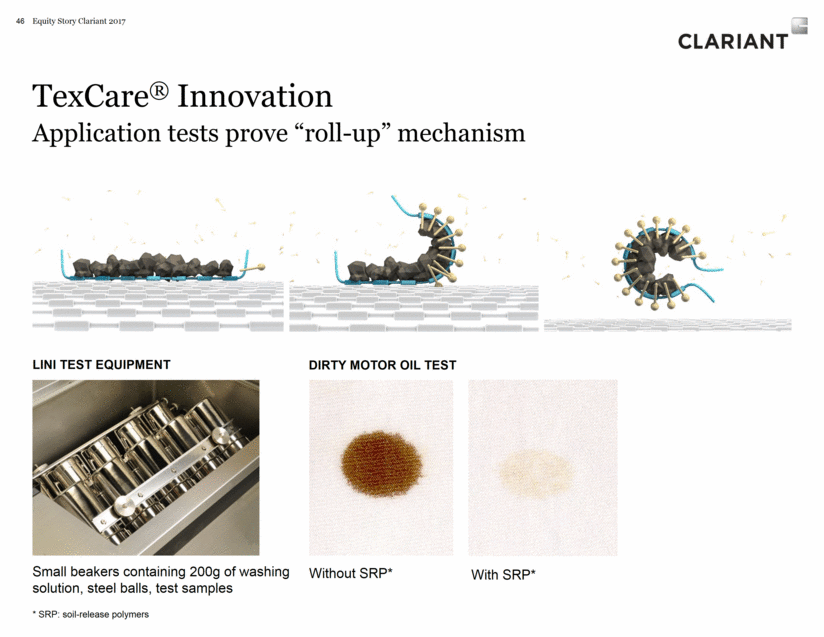
TexCare® Innovation Application tests prove “roll-up” mechanism Equity Story Clariant 2017 46 Small beakers containing 200g of washing solution, steel balls, test samples Without SRP* With SRP* DIRTY MOTOR OIL TEST LINI TEST EQUIPMENT * SRP: soil-release polymers
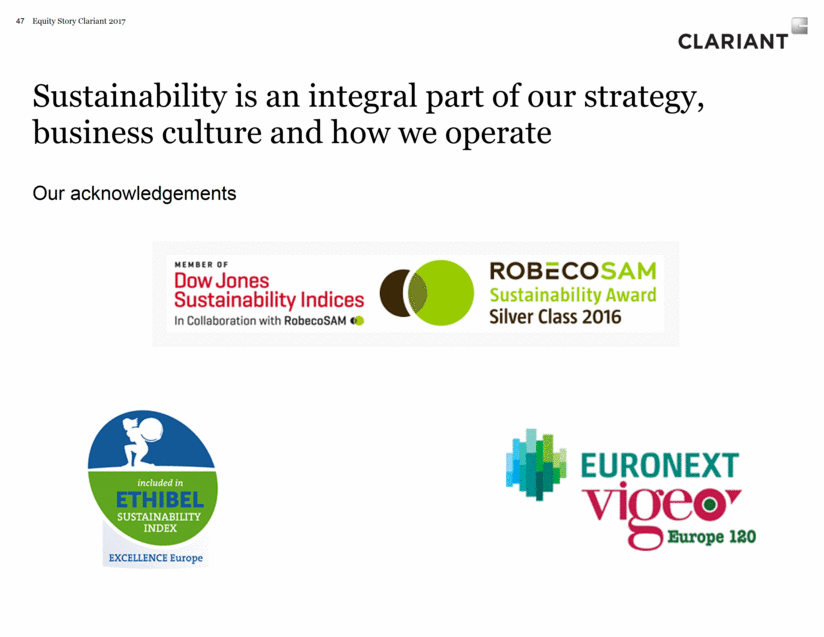
Sustainability is an integral part of our strategy, business culture and how we operate Equity Story Clariant 2017 47 Our acknowledgements
Financial Excellence
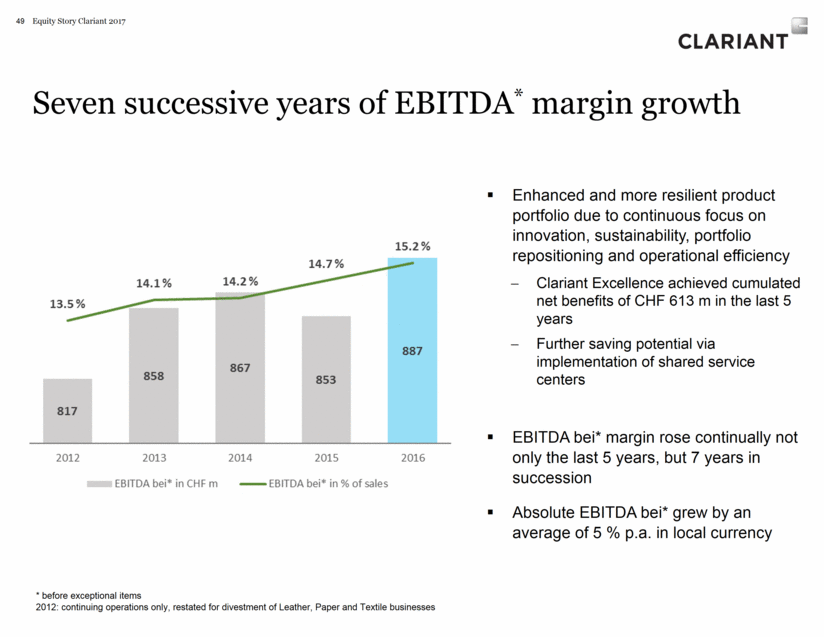
Seven successive years of EBITDA* margin growth Equity Story Clariant 2017 49 Enhanced and more resilient product portfolio due to continuous focus on innovation, sustainability, portfolio repositioning and operational efficiency Clariant Excellence achieved cumulated net benefits of CHF 613 m in the last 5 years Further saving potential via implementation of shared service centers EBITDA bei* margin rose continually not only the last 5 years, but 7 years in succession Absolute EBITDA bei* grew by an average of 5 % p.a. in local currency * before exceptional items 2012: continuing operations only, restated for divestment of Leather, Paper and Textile businesses
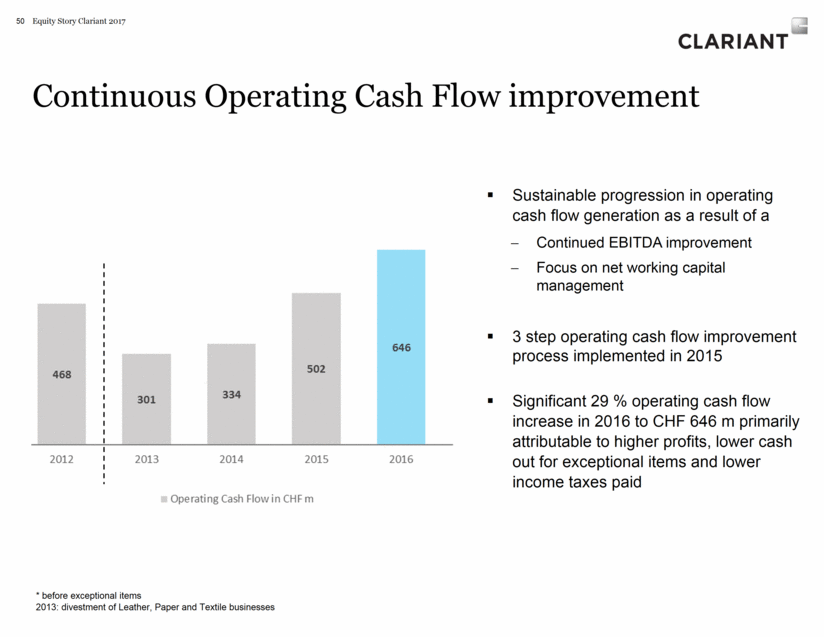
Continuous Operating Cash Flow improvement Equity Story Clariant 2017 50 Sustainable progression in operating cash flow generation as a result of a Continued EBITDA improvement Focus on net working capital management 3 step operating cash flow improvement process implemented in 2015 Significant 29 % operating cash flow increase in 2016 to CHF 646 m primarily attributable to higher profits, lower cash out for exceptional items and lower income taxes paid * before exceptional items 2013: divestment of Leather, Paper and Textile businesses
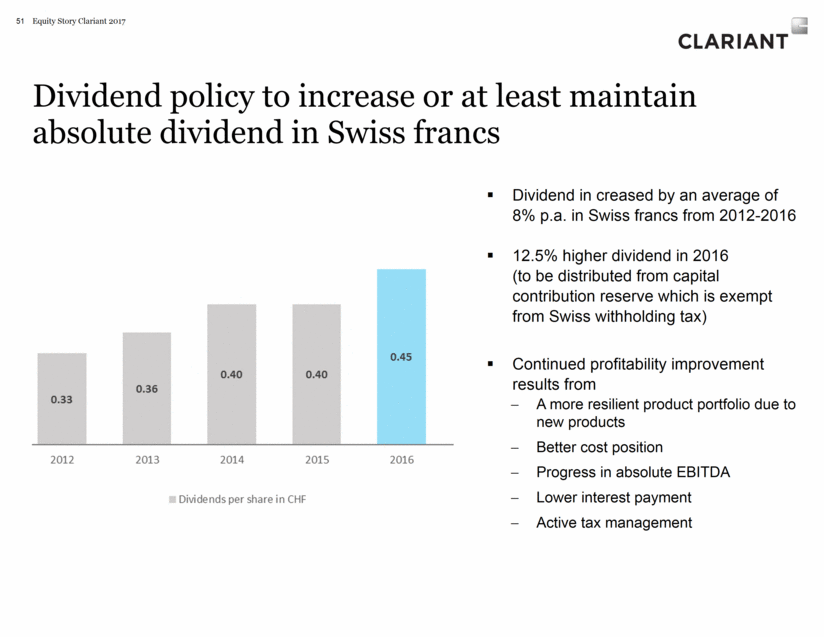
Dividend policy to increase or at least maintain absolute dividend in Swiss francs Equity Story Clariant 2017 51 Dividend in creased by an average of 8% p.a. in Swiss francs from 2012-2016 12.5% higher dividend in 2016 (to be distributed from capital contribution reserve which is exempt from Swiss withholding tax) Continued profitability improvement results from A more resilient product portfolio due to new products Better cost position Progress in absolute EBITDA Lower interest payment Active tax management
Highly Experienced Management
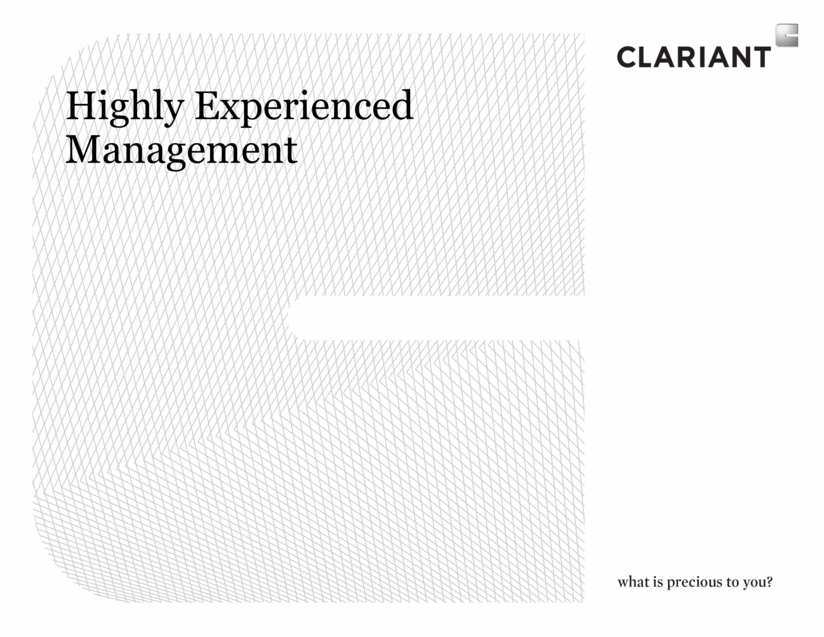
The Executive Committee HARIOLF KOTTMANN, CEO Chairman of the Executive Committee Responsibilities: Corporate Planning & Strategy, Corporate Sustainability & Regulatory Affairs, Group Communications, Group Human Resources, Investor Relations, Group Legal, and Clariant Excellence with a focus on People Excellence PATRICK JANY, CFO Member of the Executive Committee Responsibilities: Business Units Masterbatches and Functional Minerals, Corporate Accounting, Corporate Auditing, Corporate Controlling, Corporate Tax, Corporate Treasury, Mergers & Acquisitions, Group Compliance, Global Business Services, Operational Excellence, Supply Chain Excellence, and the regions Europe and Middle East & Africa CHRISTIAN KOHLPAINTNER Member of the Executive Committee Responsibilities: Business Units Additives, Catalysts and Pigments, Group Technology & Innovation, Innovation Excellence, and the regions Greater China, India, Japan, and South East Asia & Pacific 53 BRITTA FUENFSTUECK Member of the Executive Committee Responsibilities: Business Units Industrial & Consumer Specialties and Oil & Mining Services, Group IT, Group Procurement, Commercial Excellence, and the regions Latin America and North America Equity Story Clariant 2017
Summary
What makes Clariant so special? Equity Story Clariant 2017 55 We are a leading Specialty Chemical Company We serve markets with future prospects and above average growth rates by providing solutions to global challenges by supporting our customers in creating more value by focusing on the requirements in the different regions by building on our innovation and R&D strategy as well as our sustainability offering We strive for financial excellence We have highly experienced management
Investor Relations Contacts 56 Equity Story Clariant 2017 Anja Pomrehn Head of Investor Relations Phone +41 61 469 67 45 Mobile +41 79 618 19 82 E-mail anja.pomrehn@clariant.com Maria Ivek Investor Relations Officer Phone +41 61 469 62 92 Mobile +41 79 847 23 80 E-mail maria.ivek@clariant.com Sonja Ritschard Junior Investor Relations Manager Phone +41 61 469 64 95 Mobile +41 79 917 12 22 E-mail sonja.ritschard@clariant.com
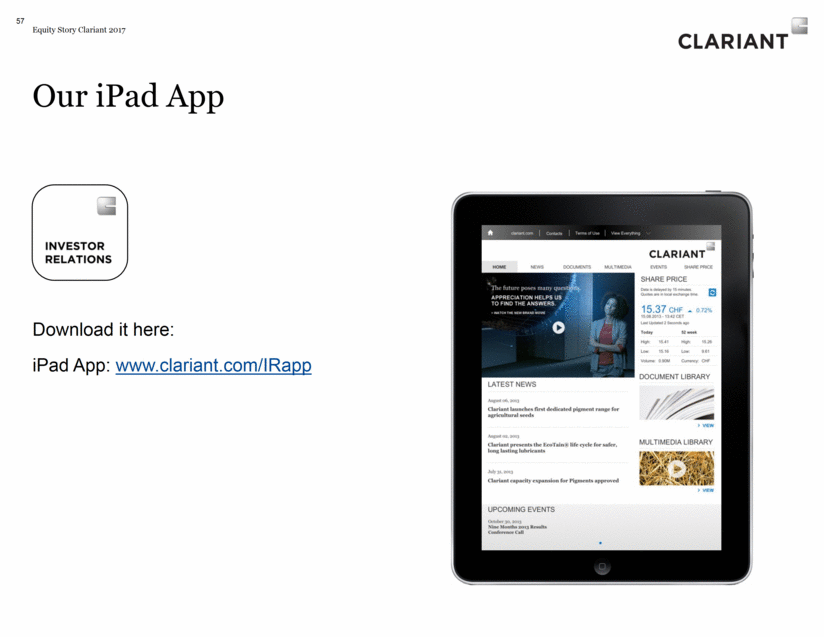
Download it here: iPad App: www.clariant.com/IRapp Our iPad App 57 Equity Story Clariant 2017
