Lender Update and Amendment Request June 6, 2017
|
|
Filed by Huntsman Corporation |
|
|
pursuant to Rule 425 under the Securities Act of 1933 |
|
|
and deemed filed pursuant to Rule 14a-12 under |
|
|
the Securities Exchange Act of 1934 |
|
|
Subject Company: Huntsman Corporation |
|
|
Commission File No. 1-32427 |
Lender Update and Amendment Request June 6, 2017
11 Cautionary Statement Regarding Forward-Looking Statements This communication contains certain statements that are “forward-looking statements” within the meaning of Section 27A of the Securities Act of 1933, as amended (the “Securities Act”), and Section 21E of the Securities Exchange Act of 1934, as amended. Clariant Ltd (“Clariant”) and Huntsman Corporation (“Huntsman”) have identified some of these forward-looking statements with words like “believe,” “may,” “could,” “would,” “might,” “possible,” “will,” “should,” “expect,” “intend,” “plan,” “anticipate,” “estimate,” “potential,” “outlook” or “continue,” the negative of these words, other terms of similar meaning or the use of future dates. Forward-looking statements in this communication include, without limitation, statements about the anticipated benefits of the contemplated transaction, including future financial and operating results and expected synergies and cost savings related to the contemplated transaction, the plans, objectives, expectations and intentions of Clariant, Huntsman or the combined company, the expected timing of the completion of the contemplated transaction and information relating to the proposed initial public offering of ordinary shares of Venator Materials PLC. Such statements are based on the current expectations of the management of Clariant or Huntsman, as applicable, are qualified by the inherent risks and uncertainties surrounding future expectations generally, and actual results could differ materially from those currently anticipated due to a number of risks and uncertainties. Neither Clariant nor Huntsman, nor any of their respective directors, executive officers or advisors, provide any representation, assurance or guarantee that the occurrence of the events expressed or implied in any forward-looking statements will actually occur. Risks and uncertainties that could cause results to differ from expectations include: uncertainties as to the timing of the contemplated transaction; uncertainties as to the approval of Huntsman’s stockholders and Clariant’s shareholders required in connection with the contemplated transaction; the possibility that a competing proposal will be made; the possibility that the closing conditions to the contemplated transaction may not be satisfied or waived, including that a governmental entity may prohibit, delay or refuse to grant a necessary regulatory approval; the effects of disruption caused by the announcement of the contemplated transaction making it more difficult to maintain relationships with employees, customers, vendors and other business partners; the risk that stockholder litigation in connection with the contemplated transaction may affect the timing or occurrence of the contemplated transaction or result in significant costs of defense, indemnification and liability; ability to refinance existing indebtedness of Clariant or Huntsman in connection with the contemplated transaction; other business effects, including the effects of industry, economic or political conditions outside of the control of the parties to the contemplated transaction; transaction costs; actual or contingent liabilities; disruptions to the financial or capital markets, including with respect to the initial public offering of ordinary shares by Venator Materials PLC or financing activities related to the contemplated transaction; and other risks and uncertainties discussed in Huntsman’s filings with the U.S. Securities and Exchange Commission (the “SEC”), including the “Risk Factors” section of Huntsman’s annual report on Form 10-K for the fiscal year ended December 31, 2016. You can obtain copies of Huntsman’s filings with the SEC for free at the SEC’s website (www.sec.gov). Forward-looking statements included herein are made only as of the date hereof and neither Clariant nor Huntsman undertakes any obligation to update any forward-looking statements as a result of new information, future developments or otherwise, except as expressly required by law. All forward-looking statements in this communication are qualified in their entirety by this cautionary statement. 1
22 Important Additional Information and Where to Find It NO OFFER OR SOLICITATION This communication is not intended to and does not constitute an offer to sell or the solicitation of an offer to subscribe for or buy or an invitation to purchase or subscribe for any securities or the solicitation of any vote or approval in any jurisdiction, nor shall there be any sale, issuance or transfer of securities in any jurisdiction in contravention of applicable law. No offer of securities will be made except by means of a prospectus meeting the requirements of Section 10 of the Securities Act. IMPORTANT ADDITIONAL INFORMATION WILL BE FILED WITH THE SEC In connection with the contemplated transaction, Clariant intends to file a registration statement on Form F-4 with the SEC that will include the Proxy Statement/Prospectus of Huntsman. The Proxy Statement/Prospectus will also be sent or given to Huntsman stockholders and will contain important information about the contemplated transaction. INVESTORS AND SHAREHOLDERS ARE URGED TO READ THE PROXY STATEMENT/PROSPECTUS AND OTHER RELEVANT DOCUMENTS FILED OR TO BE FILED WITH THE SEC CAREFULLY WHEN THEY BECOME AVAILABLE BECAUSE THEY WILL CONTAIN IMPORTANT INFORMATION ABOUT CLARIANT, HUNTSMAN, THE CONTEMPLATED TRANSACTION AND RELATED MATTERS. Investors and shareholders will be able to obtain free copies of the Proxy Statement/Prospectus (when available) and other documents filed with the SEC by Clariant and Huntsman through the website maintained by the SEC at www.sec.gov. PARTICIPANTS IN THE SOLICITATION Huntsman and its directors and executive officers may be deemed to be participants in the solicitation of proxies from Huntsman investors and shareholders in connection with the contemplated transaction. Information about Huntsman’s directors and executive officers is set forth in its proxy statement for its 2017 Annual Meeting of Stockholders and its annual report on Form 10-K for the fiscal year ended December 31, 2016. These documents may be obtained for free at the SEC’s website at www.sec.gov. Additional information regarding the interests of participants in the solicitation of proxies in connection with the contemplated transactions will be included in the Proxy Statement/ Prospectus that Huntsman intends to file with the SEC. 2
A.Transaction Overview B.Huntsman Financial Overview C.IPO Overview D.HuntsmanClariant Overview E.Appendix
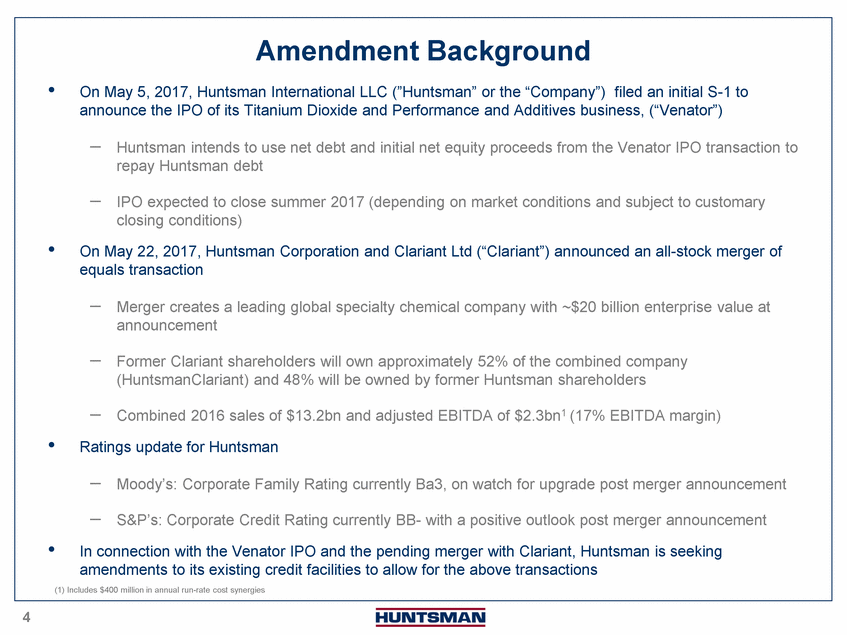
44 • On May 5, 2017, Huntsman International LLC (”Huntsman” or the “Company”) filed an initial S-1 to announce the IPO of its Titanium Dioxide and Performance and Additives business, (“Venator”) – Huntsman intends to use net debt and initial net equity proceeds from the Venator IPO transaction to repay Huntsman debt – IPO expected to close summer 2017 (depending on market conditions and subject to customary closing conditions) • On May 22, 2017, Huntsman Corporation and Clariant Ltd (“Clariant”) announced an all-stock merger of equals transaction – Merger creates a leading global specialty chemical company with ~$20 billion enterprise value at announcement – Former Clariant shareholders will own approximately 52% of the combined company (HuntsmanClariant) and 48% will be owned by former Huntsman shareholders – Combined 2016 sales of $13.2bn and adjusted EBITDA of $2.3bn1 (17% EBITDA margin) • Ratings update for Huntsman – Moody’s: Corporate Family Rating currently Ba3, on watch for upgrade post merger announcement – S&P’s: Corporate Credit Rating currently BB-with a positive outlook post merger announcement • In connection with the Venator IPO and the pending merger with Clariant, Huntsman is seeking amendments to its existing credit facilities to allow for the above transactions (1) Includes $400 million in annual run-rate cost synergies 4
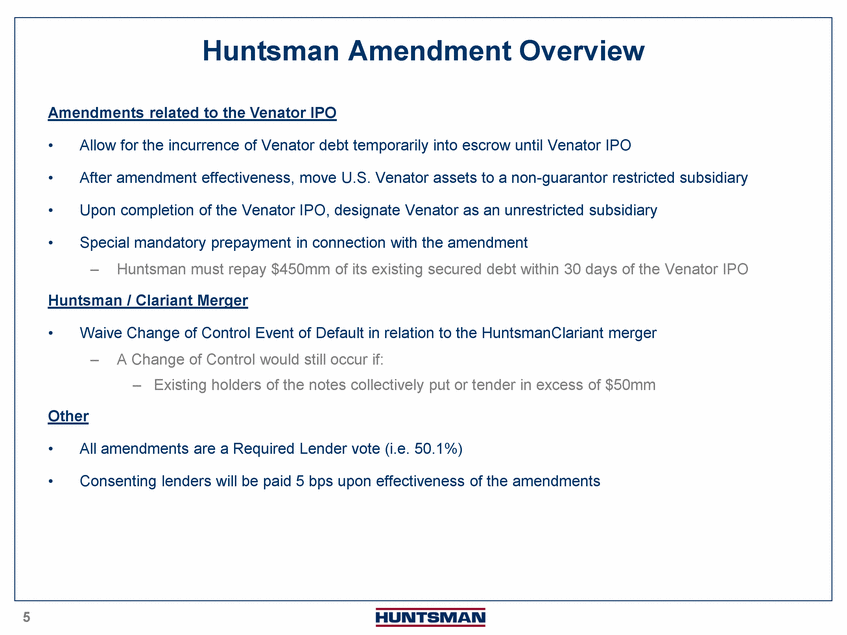
55 Amendments related to the Venator IPO •Allow for the incurrence of Venator debt temporarily into escrow until Venator IPO •After amendment effectiveness, move U.S. Venator assets to a non-guarantor restricted subsidiary •Upon completion of the Venator IPO, designate Venator as an unrestricted subsidiary •Special mandatory prepayment in connection with the amendment –Huntsman must repay $450mm of its existing secured debt within 30 days of the Venator IPO Huntsman / Clariant Merger •Waive Change of Control Event of Default in relation to the HuntsmanClariant merger –A Change of Control would still occur if: –Existing holders of the notes collectively put or tender in excess of $50mm Other •All amendments are a Required Lender vote (i.e. 50.1%) •Consenting lenders will be paid 5 bps upon effectiveness of the amendments
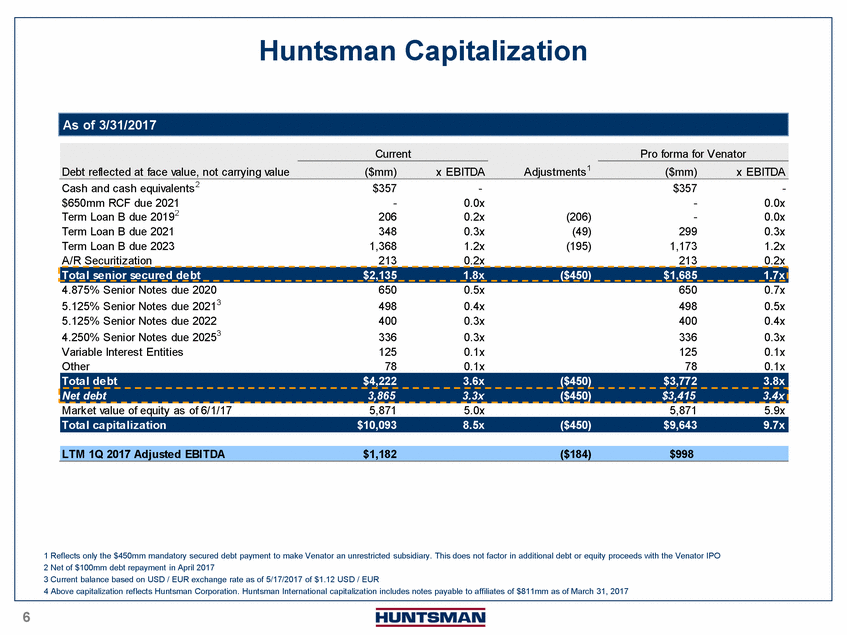
66 As of 3/31/2017 Current Pro forma for Venator Debt reflected at face value, not carrying value($mm)x EBITDAAdjustments1 ($mm)x EBITDA 1 Reflects only the $450mm mandatory secured debt payment to make Venator an unrestricted subsidiary. This does not factor in additional debt or equity proceeds with the Venator IPO 2 Net of $100mm debt repayment in April 2017 3 Current balance based on USD / EUR exchange rate as of 5/17/2017 of $1.12 USD / EUR 4 Above capitalization reflects Huntsman Corporation. Huntsman International capitalization includes notes payable to affiliates of $811mm as of March 31, 2017
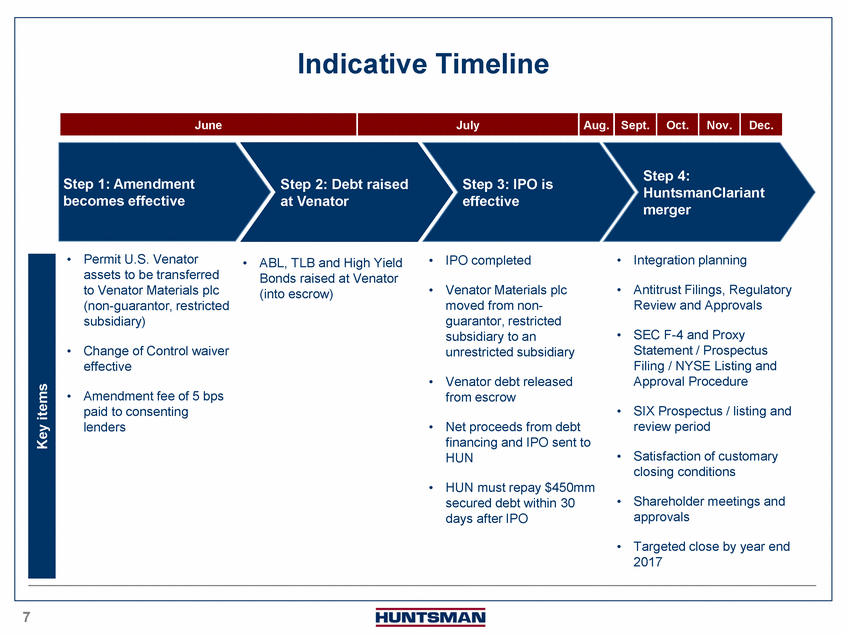
Indicative Timeline 77 Step 1: Amendment becomes effective •Permit U.S. Venator assets to be transferred to Venator Materials plc (non-guarantor, restricted subsidiary) •Change of Control waiver effective Key items Step 2: Debt raised at Venator •ABL, TLB and High Yield Bonds raised at Venator (into escrow) Step 3: IPO is effective •IPO completed •Venator Materials plc moved from non-guarantor, restricted subsidiary to an unrestricted subsidiary •Venator debt released from escrow •Net proceeds from debt financing and IPO sent to HUN •HUN must repay $450mm secured debt within 30 days after IPO Step 4: HuntsmanClariant merger •Integration planning •Antitrust Filings, Regulatory Review and Approvals •SEC F-4 and Proxy Statement / Prospectus Filing / NYSE Listing and Approval Procedure •SIX Prospectus / listing and review period •Satisfaction of customary closing conditions •Shareholder meetings and approvals •Targeted close by year end 2017
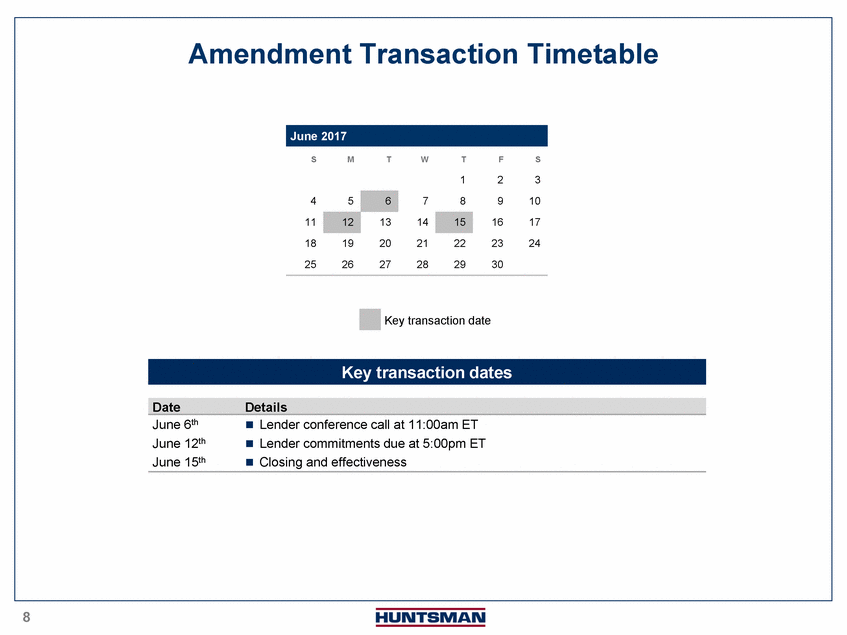
88 June 2017 Key transaction date Key transaction dates DateDetails June 6th Lender conference call at 11:00am ET June 12th Lender commitments due at 5:00pm ET June 15th Closing and effectiveness
A.Transaction Overview B.Huntsman Financial Overview C.IPO Overview D.HuntsmanClariant Overview E.Appendix
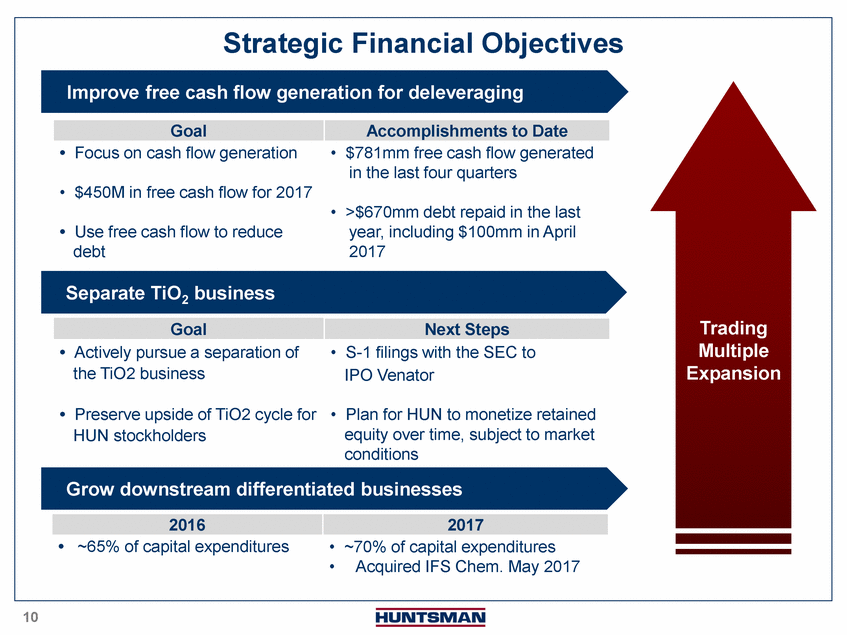
Strategic Financial Objectives Improve free cash flow generation for deleveraging GoalAccomplishments to Date • Focus on cash flow generation • $450M in free cash flow for 2017 • Use free cash flow to reduce debt • $781mm free cash flow generated in the last four quarters • >$670mm debt repaid in the last year, including $100mm in April 2017 Separate TiO2 business GoalNext Steps Trading • Actively pursue a separation of the TiO2 business • S-1 filings with the SEC to IPO Venator Multiple Expansion • Preserve upside of TiO2 cycle for HUN stockholders • Plan for HUN to monetize retained equity over time, subject to market conditions 1010 Grow downstream differentiated businesses 20162017 •~65% of capital expenditures• ~70% of capital expenditures •Acquired IFS Chem. May 2017 10
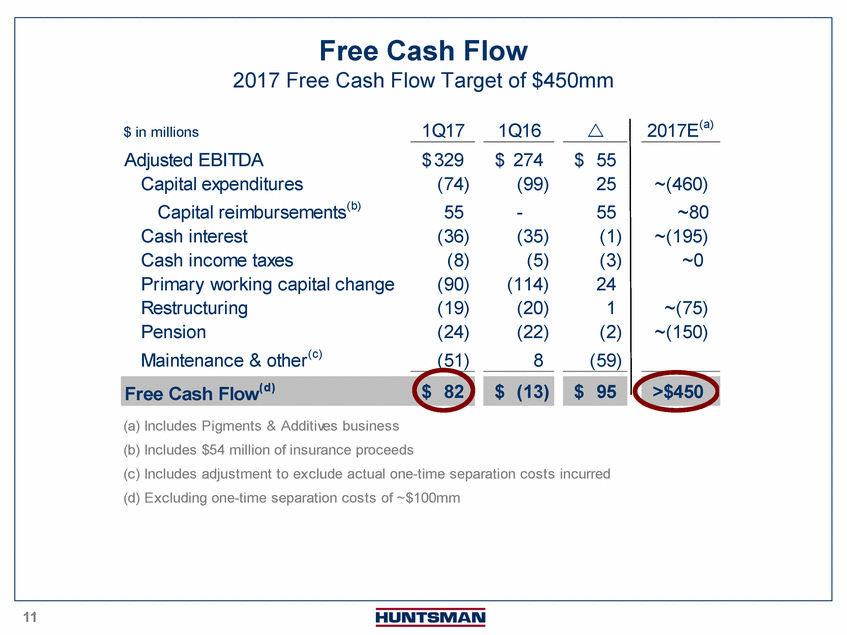
Free Cash Flow 2017 Free Cash Flow Target of $450mm $ in millions 1Q17 1Q16 r 2017E(a) Adjusted EBITDA $ 329 $ 274 $ 55 Capital expenditures (74) (99) 25 ~(460) Capital reimbursements(b) 55 - 55 ~80 Cash interest (36) (35) (1) ~(195) Cash income taxes (8) (5) (3) ~0 Primary working capital change (90) (114) 24 Restructuring (19) (20) 1 ~(75) Pension (24) (22) (2) ~(150) Maintenance & other(c) (51) 8 (59) Free Cash Flow(d) $ 82 $ (13) $ 95 >$450 1111 (a) Includes Pigments & Additives business (b) Includes $54 million of insurance proceeds (c) Includes adjustment to exclude actual one-time separation costs incurred (d) Excluding one-time separation costs of ~$100mm 11
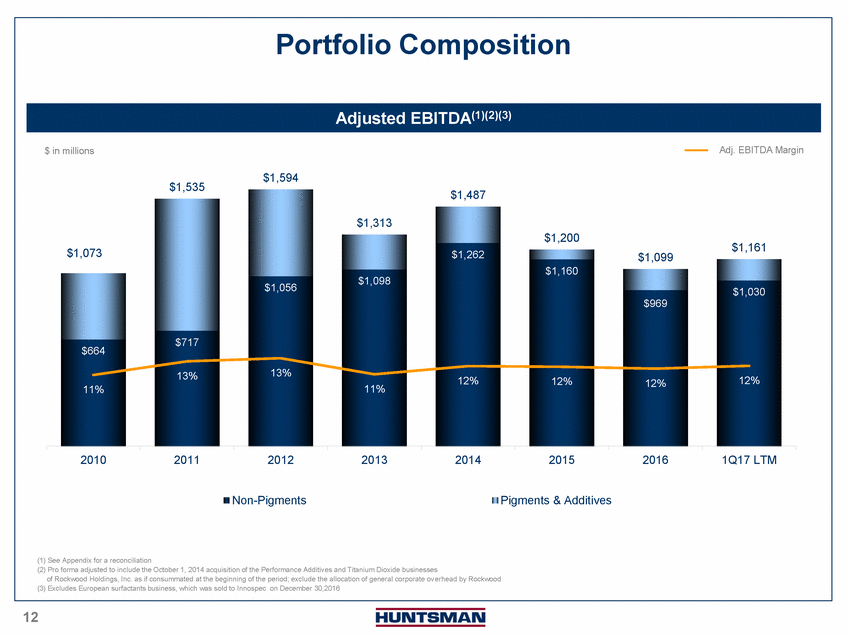
Portfolio Composition Adjusted EBITDA(1)(2)(3) $ in millions Adj. EBITDA Margin $1,535 $1,594 $1,487 $1,073 $1,313 $1,056$1,098 $1,262 $1,200 $1,160 $1,161 $1,099 $1,030 $969 $664 11% $717 13%13% 11% 12%12%12%12% 1212 20102011201220132014201520161Q17 LTM Non-PigmentsPigments & Additives (1) See Appendix for a reconciliation (2) Pro forma adjusted to include the October 1, 2014 acquisition of the Performance Additives and Titanium Dioxide businesses of Rockwood Holdings, Inc. as if consummated at the beginning of the period; exclude the allocation of general corporate ov erhead by Rockwood (3) Excludes European surfactants business, which was sold to Innospec on December 30,2016 12
A.Transaction Overview B.Huntsman Financial Overview C.IPO Overview D.HuntsmanClariant Overview E.Appendix
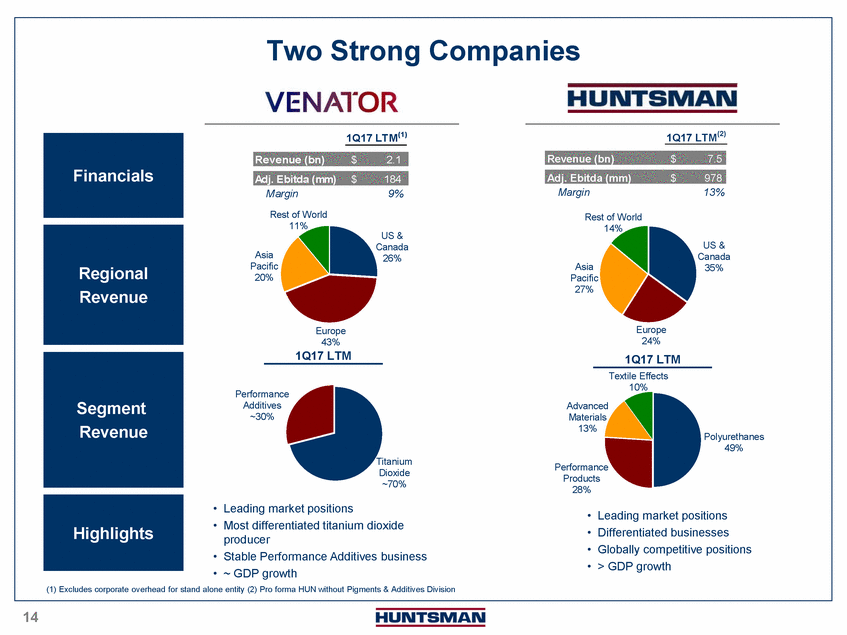
Two Strong Companies 1Q17 LTM(1) Normalized(1)(2) 1Q17 LTM(2) Financials Revenue (bn) $ Adj. Ebitda (mm) $ 2.1 $ 184 $ 2.6 400 Revenue (bn) Adj. Ebitda (mm) $7.5 $978 Margin 9% 15% Rest of World 11% US & Canada Margin13% Rest of World 14% US & Regional Revenue Asia Pacific 20% 26% Asia Pacific 27% Canada 35% Segment Revenue Performance Additives ~30% Europe 43% 1Q17 LTM Titanium Dioxide ~70% Advanced Materials 13% Performance Products 28% Europe 24% 1Q17 LTM Textile Effects 10% Polyurethanes 49% Highlights • Leading market positions • Most differentiated titanium dioxide producer • Stable Performance Additives business • ~ GDP growth • Leading market positions • Differentiated businesses • Globally competitive positions • > GDP growth 1414 14
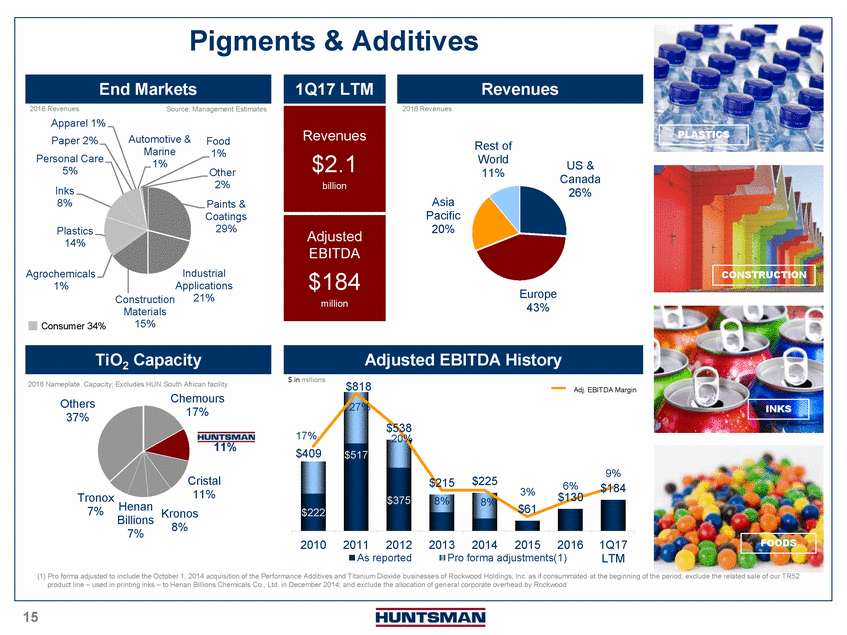
Pigments & Additives End Markets 1Q17 LTM Revenues 2016 Revenues Apparel 1% Source: Management Estimates 2016 Revenues Paper 2% Personal Care 5% Inks 8% Plastics 14% Automotive & Marine 1% Food 1% Other 2% Paints & Coatings 29% Revenues $2.1 billion Adjusted EBITDA Asia Pacific 20% Rest of World 11% US & Canada 26% PLASTICS Agrochemicals 1% Consumer 34% Construction Materials 15% Industrial Applications 21% $184 million Europe 43% CONSTRUCTION TiO2 CapacityAdjusted EBITDA History $ in millions 2016 Nameplate Capacity; Excludes HUN South African facility $818 Adj. EBITDA Margin Others 37% Tronox 7% Henan Billions 7% Chemours 17% 11% Cristal 11% Kronos 8% 17% $409 $222 27% $517 $538 20% $375 $215$225 3% 8%8%$61 6% $130 9% $184 INKS 20102011201220132014201520161Q17 FOODS As reportedPro forma adjustments(1) LTM 1515 (1) Pro forma adjusted to include the October 1, 2014 acquisition of the Performance Additives and Titanium Dioxide businesse s of Rockwood Holdings, Inc. as if consummated at the beginning of the period; exclude the related sale of our TR52 product line – used in printing inks – to Henan Billions Chemicals Co., Ltd. in December 2014; and exclude the allocation of general corporate overhead by Rockwood 15
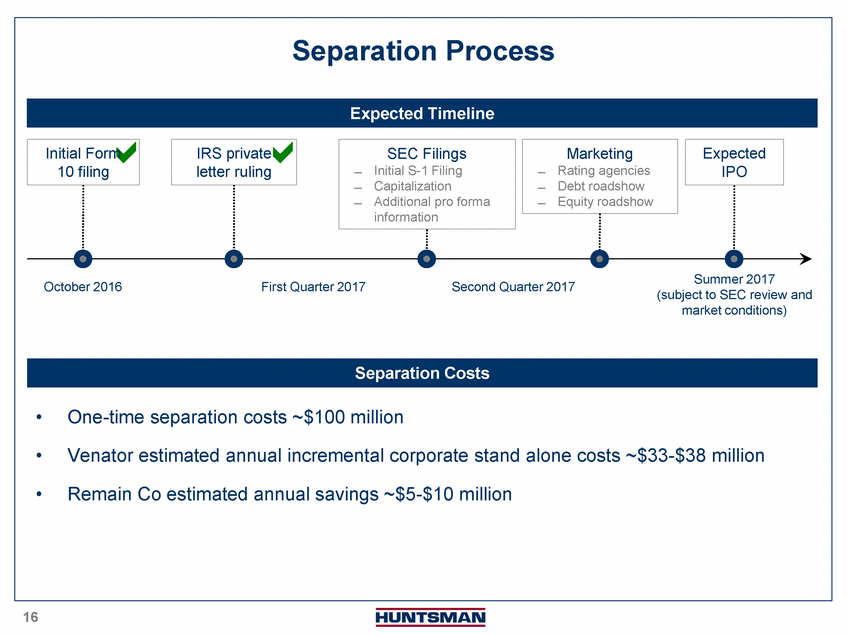
Separation Process 10 filing Expected Timeline SEC Filings ̶Initial S-1 Filing ̶Capitalization ̶Additional pro forma information Marketing ̶Rating agencies ̶Debt roadshow ̶Equity roadshow Expected IPO October 2016 First Quarter 2017 Second Quarter 2017 Summer 2017 (subject to SEC review and market conditions) 1616 Separation Costs •One-time separation costs ~$100 million •Venator estimated annual incremental corporate stand alone costs ~$33-$38 million •Remain Co estimated annual savings ~$5-$10 million 16
A.Transaction Overview B.Huntsman Financial Overview C.IPO Overview D.HuntsmanClariant Overview E.Appendix
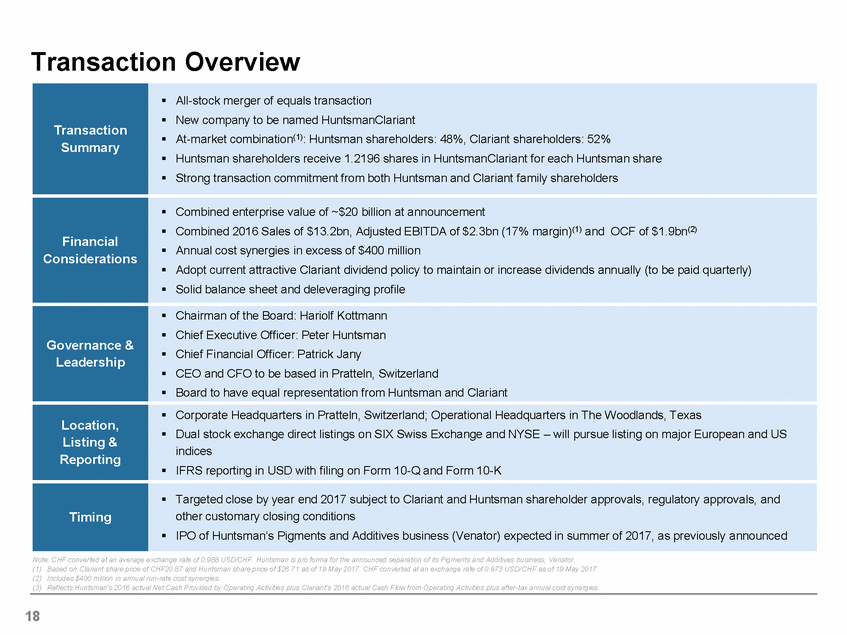
Transaction Overview Transaction Summary All-stock merger of equals transaction New company to be named HuntsmanClariant At-market combination(1): Huntsman shareholders: 48%, Clariant shareholders: 52% Huntsman shareholders receive 1.2196 shares in HuntsmanClariant for each Huntsman share Strong transaction commitment from both Huntsman and Clariant family shareholders Financial Considerations Combined enterprise value of ~$20 billion at announcement Combined 2016 Sales of $13.2bn, Adjusted EBITDA of $2.3bn (17% margin)(1) and OCF of $1.9bn(2) Annual cost synergies in excess of $400 million Adopt current attractive Clariant dividend policy to maintain or increase dividends annually (to be paid quarterly) Solid balance sheet and deleveraging profile Governance & Leadership Location, Listing & Reporting Chairman of the Board: Hariolf Kottmann Chief Executive Officer: Peter Huntsman Chief Financial Officer: Patrick Jany CEO and CFO to be based in Pratteln, Switzerland Board to have equal representation from Huntsman and Clariant Corporate Headquarters in Pratteln, Switzerland; Operational Headquarters in The Woodlands, Texas Dual stock exchange direct listings on SIX Swiss Exchange and NYSE – will pursue listing on major European and US indices IFRS reporting in USD with filing on Form 10-Q and Form 10-K Timing Targeted close by year end 2017 subject to Clariant and Huntsman shareholder approvals, regulatory approvals, and other customary closing conditions IPO of Huntsman’s Pigments and Additives business (Venator) expected in summer of 2017, as previously announced
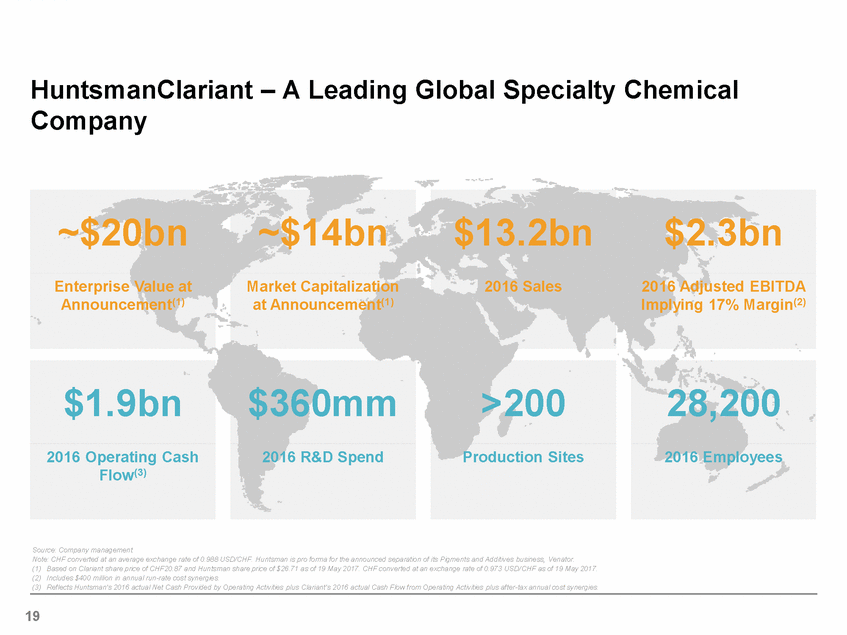
HuntsmanClariant – A Leading Global Specialty Chemical Company ~$20bn ~$14bn $13.2bn $2.3bn Enterprise Value at Announcement(1) Market Capitalization at Announcement(1) 2016 Sales 2016 Adjusted EBITDA Implying 17% Margin(2) $1.9bn $360mm >200 28,200 2016 Operating Cash Flow(3) 2016 R&D Spend Production Sites 2016 Employees Source: Company management.
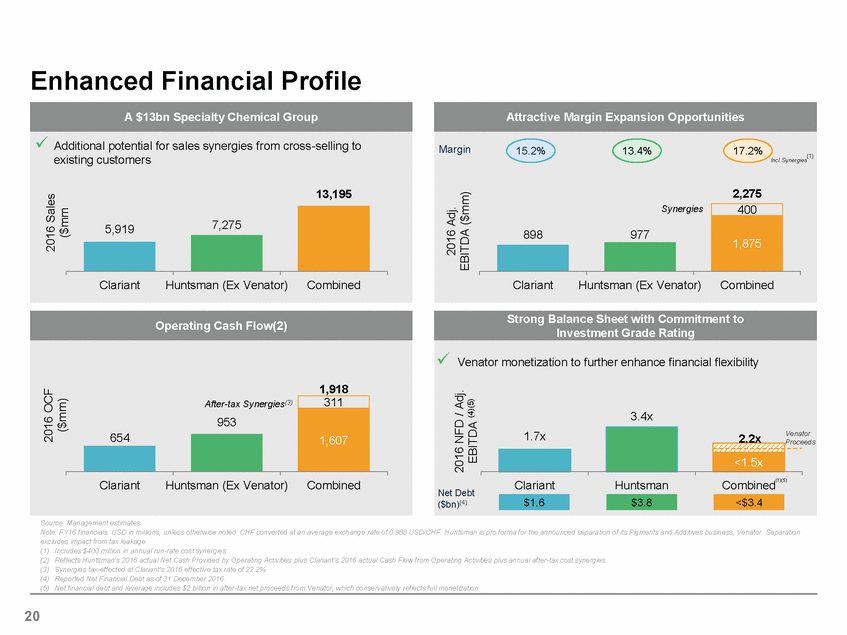
Enhanced Financial Profile A $13bn Specialty Chemical GroupAttractive Margin Expansion Opportunities Additional potential for sales synergies from cross-selling to existing customers Margin15.2%13.4%17.2% (1) Incl. Synergies 2016 Sales ($mm 13,195 898977 Synergies 2,275 400 1,875 2016 Adj. EBITDA ($mm) ClariantHuntsman (Ex Venator)Combined Operating Cash Flow(2)Strong Balance Sheet with Commitment to Investment Grade Rating Venator monetization to further enhance financial flexibility 2016 OCF ($mm) After-tax Synergies(3) 953 1,918 311 1,607 1.7x 3.4x 2.2x <1.5x Venator Proceeds 2016 NFD / Adj. EBITDA (4)(5) Net Debt ($bn)(4) ClariantHuntsmanCombined $1.6$3.8<$3.4 (1)(5) Source: Management estimates. Note: FY16 financials. USD in millions, unless otherwise noted. CHF converted at an average exchange rate of 0.988 USD/CHF. H untsman is pro forma for the announced separation of its Pigments and Additives business, Venator. Separation excludes impact from tax leakage. (1) Includes $400 million in annual run-rate cost synergies (2) Reflects Huntsman’s 2016 actual Net Cash Provided by Operating Activities plus Clariant’s 2016 actual Cash Flow from Operating Activities plus annual after-tax cost synergies. (3) Synergies tax-effected at Clariant’s 2016 effective tax rate of 22.2%. (4) Reported Net Financial Debt as of 31 December 2016. (5) Net financial debt and leverage includes $2 billion in after-tax net proceeds from Venator, which conservatively reflects full monetization.
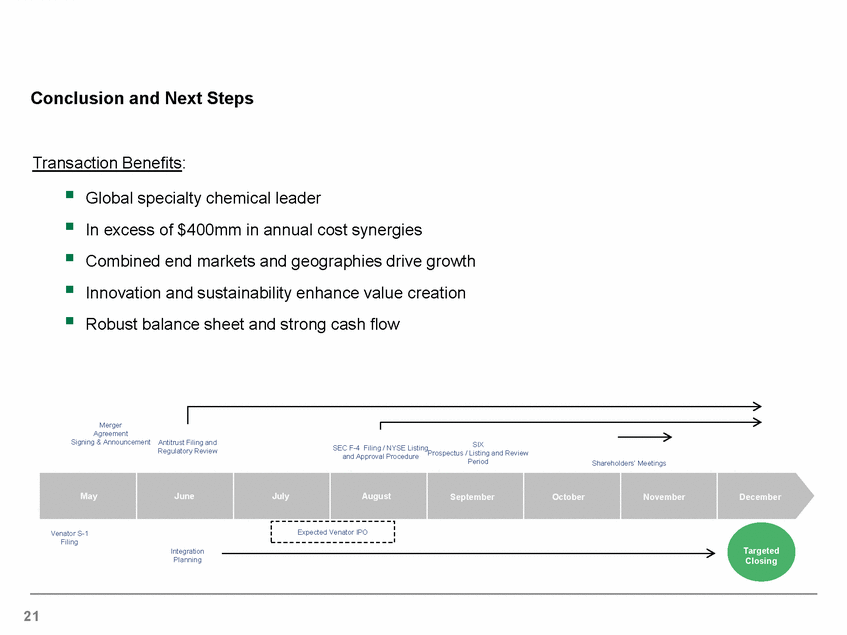
Conclusion and Next Steps Transaction Benefits: Global specialty chemical leader In excess of $400mm in annual cost synergies Combined end markets and geographies drive growth Innovation and sustainability enhance value creation Robust balance sheet and strong cash flow Merger Agreement Signing & Announcement Antitrust Filing and Regulatory Review SEC F-4 Filing / NYSE Listing SIX and Approval Procedure Prospectus / Listing and Review Period Shareholders’ Meetings May June July August September October November December Venator S-1 Filing Integration Planning Expected Venator IPO Targeted Closing
2222 Q&A 22
A.Transaction Overview B.Huntsman Financial Overview C.IPO Overview D.HuntsmanClariant Overview E.Appendix
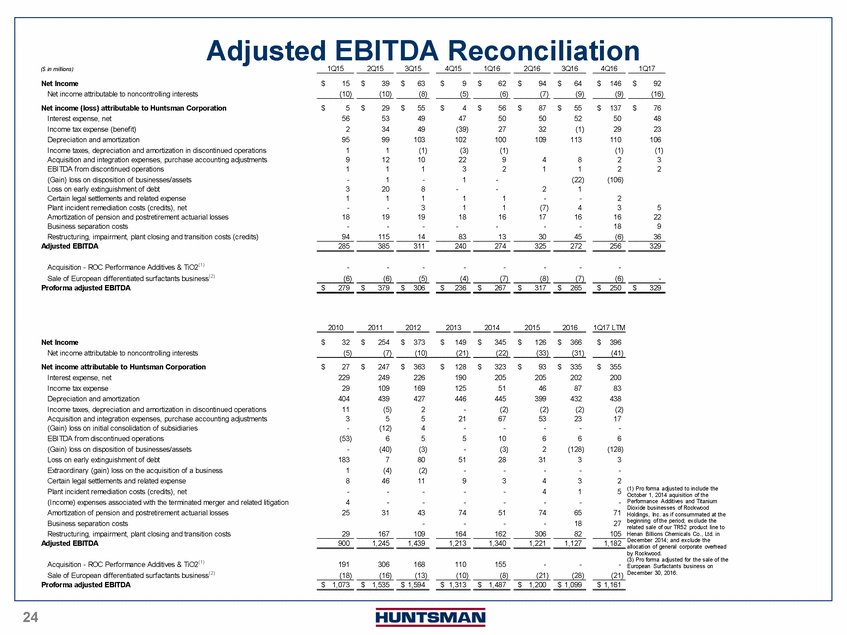
Adjusted EBITDA Reconciliation ($ in millions) 1Q15 2Q15 3Q15 4Q15 1Q16 2Q16 3Q16 4Q16 1Q17 Net Income $ 15 $ 39 $ 63 $ 9 $ 62 $ 94 $ 64 $ 146 $ 92 Net income attributable to noncontrolling interests (10) (10) (8) (5) (6) (7) (9) (9) (16) Net income (loss) attributable to Huntsman Corporation $ 5 $ 29 $ 55 $ 4 $ 56 $ 87 $ 55 $ 137 $ 76 Interest expense, net 56 53 49 47 50 50 52 50 48 Income tax expense (benefit) 2 34 49 (39) 27 32 (1) 29 23 Depreciation and amortization 95 99 103 102 100 109 113 110 106 Income taxes, depreciation and amortization in discontinued operations 1 1 (1) (3) (1) (1) (1) Acquisition and integration expenses, purchase accounting adjustments 9 12 10 22 9 4 8 2 3 EBITDA from discontinued operations 1 1 1 3 2 1 1 2 2 (Gain) loss on disposition of businesses/assets - 1 - 1 - (22) (106) Loss on early extinguishment of debt 3 20 8 - - 2 1 Certain legal settlements and related expense 1 1 1 1 1 - - 2 Plant incident remediation costs (credits), net - - 3 1 1 (7) 4 3 5 Amortization of pension and postretirement actuarial losses 18 19 19 18 16 17 16 16 22 Business separation costs - - - - - - - 18 9 Restructuring, impairment, plant closing and transition costs (credits) 94 115 14 83 13 30 45 (6) 36 Adjusted EBITDA 285 385 311 240 274 325 272 256 329 Acquisition - ROC Performance Additives & TiO2(1) - - - - - - - - Sale of European differentiated surfactants business(2) (6) (6) (5) (4) (7) (8) (7) (6) - Proforma adjusted EBITDA $ 279 $ 379 $ 306 $ 236 $ 267 $ 317 $ 265 $ 250 $ 329 2010 2011 2012 2013 2014 2015 2016 1Q17 LTM $ 32 $ 254 $ 373 $ 149 $ 345 $ 126 $ 366 $ 396 Net income attributable to noncontrolling interests (5) (7) (10) (21) (22) (33) (31) (41) Net income attributable to Huntsman Corporation $ 27 $ 247 $ 363 $ 128 $ 323 $ 93 $ 335 $ 355 Interest expense, net 229 249 226 190 205 205 202 200 Income tax expense 29 109 169 125 51 46 87 83 Depreciation and amortization 404 439 427 446 445 399 432 438 Income taxes, depreciation and amortization in discontinued operations 11 (5) 2 - (2) (2) (2) (2) Acquisition and integration expenses, purchase accounting adjustments 3 5 5 21 67 53 23 17 (Gain) loss on initial consolidation of subsidiaries - (12) 4 - - - - - EBITDA from discontinued operations (53) 6 5 5 10 6 6 6 (Gain) loss on disposition of businesses/assets - (40) (3) - (3) 2 (128) (128) Loss on early extinguishment of debt 183 7 80 51 28 31 3 3 Extraordinary (gain) loss on the acquisition of a business 1 (4) (2) - - - - - Certain legal settlements and related expense 8 46 11 9 3 4 3 2 October 1, 2014 aquisition of the (Income) expenses associated with the terminated merger and related litigation 4 - - - - - - - Amortization of pension and postretirement actuarial losses 25 31 43 74 51 74 65 71 Business separation costs - - - - 18 27 Restructuring, impairment, plant closing and transition costs 29 167 109 164 162 306 82 105 Performance Additives and Titanium Dioxide businesses of Rockwood Holdings, Inc. as if consummated at the beginning of the period; exclude the related sale of our TR52 product line to Henan Billions Chemicals Co., Ltd. in allocation of general corporate overhead by Rockwood. Acquisition - ROC Performance Additives & TiO2(1) 191 306 168 110 155 - - - (3) Pro forma adjusted for the sale of the European Surfactants business on Sale of European differentiated surfactants business(2) (18) (16) (13) (10) (8) (21) (28) (21) December 30, 2016. Proforma adjusted EBITDA $ 1,073 $ 1,535 $ 1,594 $ 1,313 $ 1,487 $ 1,200 $ 1,099 $ 1,161 2424 24
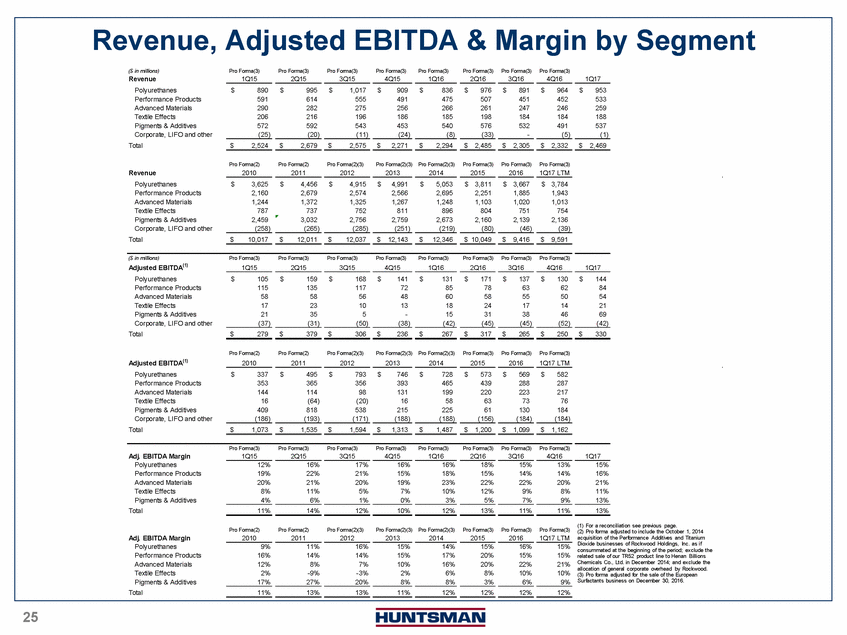
Revenue, Adjusted EBITDA & Margin by Segment ($ in millions)Pro Forma(3)Pro Forma(3)Pro Forma(3)Pro Forma(3) Pro Forma(3)Pro Forma(3) Pro Forma(3) Pro Forma(3) Revenue 1Q15 2Q15 3Q15 4Q15 1Q16 2Q16 3Q16 4Q16 1Q17 Corporate, LIFO and other (25) (20) (11) (24) (8) (33) - (5) (1) Total $ 2,524 $ 2,679 $ 2,575 $ 2,271 $ 2,294 $ 2,485 $ 2,305 $ 2,332 $ 2,469 Pro Forma(2)Pro Forma(2)Pro Forma(2)(3)Pro Forma(2)(3) Pro Forma(2)(3) Pro Forma(3) Pro Forma(3) Pro Forma(3) Revenue 2010 2011 2012 2013 2014 2015 2016 1Q17 LTM Corporate, LIFO and other (258) (265) (285) (251) (219) (80) (46) (39) Total $ 10,017 $ 12,011 $ 12,037 $ 12,143 $ 12,346 $ 10,049 $ 9,416 $ 9,591 ($ in millions)Pro Forma(3)Pro Forma(3)Pro Forma(3)Pro Forma(3) Pro Forma(3)Pro Forma(3) Pro Forma(3) Pro Forma(3) Adjusted EBITDA(1) 1Q15 2Q15 3Q15 4Q15 1Q16 2Q16 3Q16 4Q16 1Q17 Corporate, LIFO and other (37) (31) (50) (38) (42) (45) (45) (52) (42) Total $ 279 $ 379 $ 306 $ 236 $ 267 $ 317 $ 265 $ 250 $ 330 Pro Forma(2)Pro Forma(2)Pro Forma(2)(3)Pro Forma(2)(3) Pro Forma(2)(3) Pro Forma(3) Pro Forma(3) Pro Forma(3) Adjusted EBITDA(1) 2010 2011 2012 2013 2014 2015 2016 1Q17 LTM Corporate, LIFO and other (186) (193) (171) (188) (188) (156) (184) (184) Total $ 1,073 $ 1,535 $ 1,594 $ 1,313 $ 1,487 $ 1,200 $ 1,099 $ 1,162 Pro Forma(3)Pro Forma(3)Pro Forma(3)Pro Forma(3) Pro Forma(3)Pro Forma(3) Pro Forma(3) Pro Forma(3) Adj. EBITDA Margin 1Q15 2Q15 3Q15 4Q15 1Q16 2Q16 3Q16 4Q16 1Q17 Polyurethanes 12% 16% 17% 16% 16% 18% 15% 13% 15% Performance Products 19% 22% 21% 15% 18% 15% 14% 14% 16% Advanced Materials 20% 21% 20% 19% 23% 22% 22% 20% 21% Textile Effects 8% 11% 5% 7% 10% 12% 9% 8% 11% Pigments & Additives 4% 6% 1% 0% 3% 5% 7% 9% 13% Total 11% 14% 12% 10% 12% 13% 11% 11% 13% Pro Forma(2)Pro Forma(2)Pro Forma(2)(3)Pro Forma(2)(3) Pro Forma(2)(3) Pro Forma(3) Pro Forma(3) Pro Forma(3) Adj. EBITDA Margin 2010 2011 2012 2013 2014 2015 2016 1Q17 LTM Polyurethanes 9% 11% 16% 15% 14% 15% 16% 15% Performance Products 16% 14% 14% 15% 17% 20% 15% 15% Advanced Materials 12% 8% 7% 10% 16% 20% 22% 21% Textile Effects 2% -9% -3% 2% 6% 8% 10% 10% Pigments & Additives 17% 27% 20% 8% 8% 3% 6% 9% Total 11% 13% 13%11% 12%12%12%12% (1) For a reconciliation see previous page. (2) Pro forma adjusted to include the October 1, 2014 acquisition of the Performance Additives and Titanium Dioxide businesses of Rockwood Holdings, Inc. as if consummated at the beginning of the period; exclude the related sale of our TR52 product line to Henan Billions Chemicals Co., Ltd. in December 2014; and exclude the allocation of general corporate overhead by Rockwood. (3) Pro forma adjusted for the sale of the European Surfactants business on December 30, 2016. 2525 25
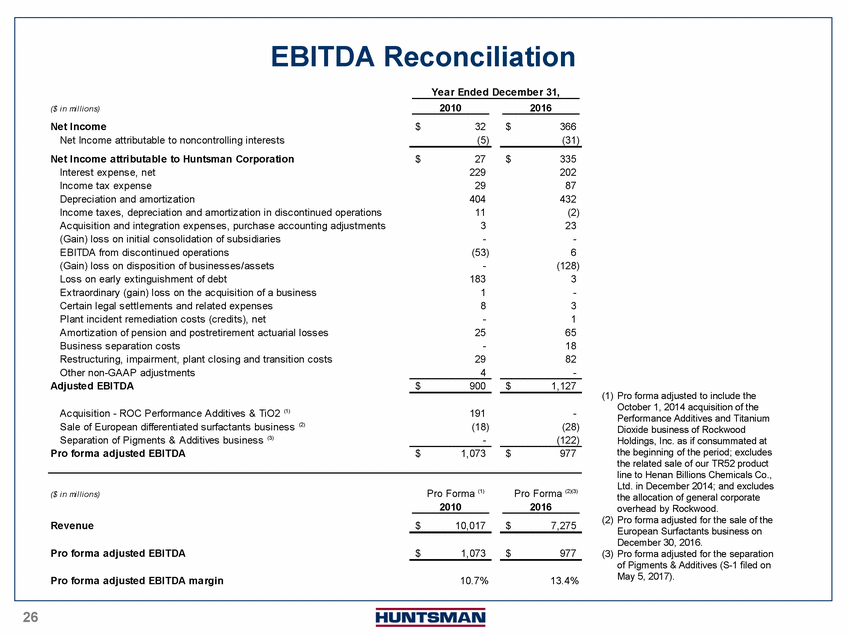
EBITDA Reconciliation Ye a r Ende d De ce mbe r 31, ($ i n mi l l i ons) 2010 2016 Net Income $ 32 $ 366 Net Income attributable to noncontrolling interests (5) (31) Net Income attributable to Huntsman Corporation $ 27 $ 335 Interest expense, net 229 202 Income tax expense 29 87 Depreciation and amortization 404 432 Income taxes, depreciation and amortization in discontinued operations 11 (2) Acquisition and integration expenses, purchase accounting adjustments 3 23 (Gain) loss on initial consolidation of subsidiaries - - EBITDA from discontinued operations (53) 6 (Gain) loss on disposition of businesses/assets - (128) Loss on early extinguishment of debt 183 3 Extraordinary (gain) loss on the acquisition of a business 1 - Certain legal settlements and related expenses 8 3 Plant incident remediation costs (credits), net - 1 Amortization of pension and postretirement actuarial losses 25 65 Business separation costs - 18 Restructuring, impairment, plant closing and transition costs 29 82 Other non-GAAP adjustments 4 - Adjusted EBITDA (1) $ 900 $ 1,127 (1) Pro forma adjusted to include the October 1, 2014 acquisition of the Acquisition - ROC Performance Additives & TiO2 191 - Performance Additives and Titanium Sale of European differentiated surfactants business (2) (18) (28) Separation of Pigments & Additives business (3) - (122) Dioxide business of Rockwood Holdings, Inc. as if consummated at Pro forma adjusted EBITDA $ 1,073 $ 977 the beginning of the period; excludes the related sale of our TR52 product line to Henan Billions Chemicals Co., Ltd. in December 2014; and excludes ($ i n mi l l i ons) Pro Forma (1)Pro Forma (2)(3) 2010 2016 the allocation of general corporate overhead by Rockwood. (2) Pro forma adjusted for the sale of the Revenue Pro forma adjusted EBITDA $ 10,017 $ $ 1,073 $ 7,275 977 European Surfactants business on December 30, 2016. (3) Pro forma adjusted for the separation of Pigments & Additives (S-1 filed on Pro forma adjusted EBITDA margin 10.7% 13.4% May 5, 2017). 2626 26