Use these links to rapidly review the document
TABLE OF CONTENTS
INDEX TO CONSOLIDATED FINANCIAL STATEMENTS
Filed pursuant to Rule 424(b)(3)
Registration No. 333-187504
PROSPECTUS
![]()
Huntsman International LLC
Offer to exchange $250,000,000 aggregate principal amount of
4.875% Senior Notes due 2020
which have been registered under the Securities Act
for
$250,000,000 aggregate principal amount of
4.875% Senior Notes due 2020
This exchange offer will expire at 5:00 p.m., New York City Time,
on May 6, 2013 unless extended.
Terms of the exchange offer:
See the "Description of New Notes" section on page 179 for more information about the new notes to be issued in this exchange offer.
This investment involves risks. See the section entitled "Risk Factors" that begins on page 13 for a discussion of the risks that you should consider prior to tendering your old notes for exchange.
Neither the Securities and Exchange Commission nor any state securities commission has approved or disapproved of these securities or passed upon the adequacy or the accuracy of this prospectus. Any representation to the contrary is a criminal offense.
The date of this prospectus is April 5, 2013
Each broker-dealer that receives new notes for its own account pursuant to the exchange offer must acknowledge that it will deliver a prospectus in connection with any resale of the new notes it receives. The letter of transmittal states that by so acknowledging and by delivering a prospectus, a broker-dealer will not be deemed to admit that it is an "underwriter" within the meaning of the Securities Act of 1933, as amended. This prospectus, as it may be amended or supplemented from time to time, may be used by a broker-dealer in connection with resales of new notes received in exchange for old notes where such old notes were acquired by the broker-dealer as a result of market-making activities or other trading activities. We have agreed that, for a period of 120 days after the consummation of the exchange offer, we will make this prospectus, as amended and supplemented, available to any broker-dealer for use in connection with any such resale. See "Plan of Distribution."
We file annual, quarterly and certain other reports with the Securities and Exchange Commission jointly with our parent, Huntsman Corporation. Because Huntsman Corporation is not an obligor or guarantor under the notes and is not a registrant under the registration statement of which this prospectus is a part, certain notes to the financial statements included in this prospectus that relate solely to Huntsman Corporation have been omitted and are marked "[Reserved]."
This prospectus incorporates important business and financial information about our Company that is not included in or delivered with this prospectus. This information is available without charge upon written or oral request. See "Where You Can Find More Information." To obtain this information in a timely fashion, you must request such information no later than five business days before the expiration of the exchange offer. UNLESS WE EXTEND THE EXCHANGE OFFER, THE LATEST YOU SHOULD REQUEST COPIES OF THESE DOCUMENTS IS APRIL 29, 2013.
i
The following summary highlights selected information from this prospectus and may not contain all the information that is important to you. This prospectus contains information regarding our business and detailed financial information. You should carefully read this entire document.
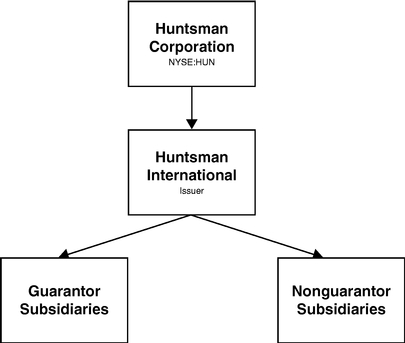
We are a wholly-owned subsidiary of Huntsman Corporation, which we refer to in this prospectus as our "parent." Unless the context otherwise requires: references in this prospectus to "we," "us," "our" or "our Company" refer to Huntsman International LLC, together with its subsidiaries, and not to Huntsman Corporation and its other subsidiaries; references to "guarantors" or "guarantor subsidiaries" refer to our subsidiaries that have guaranteed our debt obligations, including the notes, consisting of substantially all of our domestic subsidiaries and certain of our foreign subsidiaries; "HPS" refers to Huntsman Polyurethanes Shanghai Ltd. (our consolidated splitting joint venture with Shanghai Chlor-Alkali Chemical Company, Ltd); "SLIC" refers to Shanghai Liengheng Isocyanate Investment BV (our unconsolidated manufacturing joint venture with BASF AG and three Chinese chemical companies); "Sasol-Huntsman" refers to Sasol-Huntsman GmbH and Co. KG (our consolidated joint venture with Sasol that owns and operates a maleic anhydride facility in Moers, Germany); and "HCCA" refers to Huntsman Chemical Company Australia Pty Limited (our 100% owned subsidiary).
In this prospectus, we may use, without definition, the common names of competitors or other industry participants. We may also use the common names or abbreviations for certain chemicals or products. Many of these terms are defined in the Glossary of Chemical Terms on page 109 below.
Overview
We are a global manufacturer of differentiated organic chemical products and of inorganic chemical products. Jon M. Huntsman founded the predecessor to our Company as a small polystyrene plastics packaging company. Since then, we have grown through a series of significant acquisitions and now own a global portfolio of businesses. In 2005, our parent completed an initial public stock offering. Our products comprise a broad range of chemicals and formulations, which we market globally to a diversified group of consumer and industrial customers. Our products are used in a wide range of applications, including those in the adhesives, aerospace, automotive, construction products, personal care and hygiene, durable and non-durable consumer products, electronics, medical, packaging, paints and coatings, power generation, refining, synthetic fiber, textile chemicals and dye industries. We are a leading global producer in many of our key product lines, including MDI, amines, surfactants, epoxy-based polymer formulations, textile chemicals, dyes, maleic anhydride and titanium dioxide. Our administrative, research and development and manufacturing operations are primarily conducted at the facilities listed below under "Business—Properties," which are located in 30 countries. As of December 31, 2012, we employed approximately 12,000 associates worldwide. Our revenues for the years ended December 31, 2012, 2011 and 2010 were $11,187 million, $11,221 million and $9,250 million, respectively.
Our company was organized in 1999 as a Delaware limited liability company. Our principal executive offices are located at 500 Huntsman Way, Salt Lake City, Utah 84108, and our telephone number at that location is (801) 584-5700.
We operate in five segments: Polyurethanes, Performance Products, Advanced Materials, Textile Effects and Pigments. In a series of transactions beginning in 2006, we sold our North American polymers and base chemicals operations and substantially shutdown all of our Australian styrenics operations. We report the results of these businesses as discontinued operations in our statements of operations. See "Note 25. Discontinued Operations" to our audited consolidated financial statements.
1
The chart below generally illustrates our organizational structure:
Recent Developments
For a discussion of recent developments, see "Business—Recent Developments" below.
Our Products
We produce differentiated organic chemical and inorganic chemical products. Our Polyurethanes, Performance Products, Advanced Materials and Textile Effects segments produce differentiated organic chemical products and our Pigments segment produces inorganic chemical products.
Growth in our differentiated products has been driven by the substitution of our products for other materials and by the level of global economic activity. Accordingly, the profitability of our differentiated products has been somewhat less influenced by the cyclicality that typically impacts the petrochemical industry. Our Pigments business, while cyclical, is influenced by seasonal demand patterns in the coatings industry.
2
| 2012 Segment Revenues(1) | 2012 Segment Adjusted EBITDA(1) |
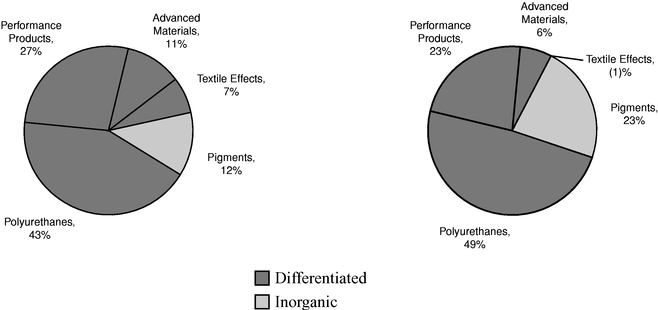
| $11,187 million | $1,396 million |
3
The following table identifies the key products, their principal end markets and applications and representative customers of each of our segments:
Segment
|
Products | End Markets and Applications |
Representative Customers |
|||
|---|---|---|---|---|---|---|
Polyurethanes |
MDI, PO, polyols, PG, TPU, aniline and MTBE | Refrigeration and appliance insulation, construction products, adhesives, automotive, footwear, furniture, cushioning, specialized engineering applications and fuel additives | BMW, CertainTeed, Electrolux, Firestone, GE, Haier, Louisiana Pacific, PMI, Recticel, Weyerhaeuser | |||
Performance Products |
Amines, surfactants, LAB, maleic anhydride, other performance chemicals, EG, olefins and technology licenses |
Detergents, personal care products, agrochemicals, lubricant and fuel additives, adhesives, paints and coatings, construction, marine and automotive products, composites, and PET fibers and resins |
Afton, Chevron, Dow, Henkel, L'Oreal, Lubrizol, Monsanto, Procter & Gamble, Reichhold, Sun Products, Unilever |
|||
Advanced Materials |
Basic liquid and solid epoxy resins; specialty resin compounds; cross-linking, matting and curing agents; epoxy, acrylic and polyurethane-based formulations |
Aerospace and industrial adhesives, composites for aerospace, automotive, and wind power generation; construction and civil engineering; industrial coatings; electrical power transmission; consumer electronics |
ABB, AkzoNobel, Bodo Moller, Cytec, Freeman, Henkel, Hexcel, ISOLA, Lianyungang, Omya, PPG, Ribelin, RPM, Sanarrow, Schneider, Sherwin Williams, Siemens, Sika, Speed Fair, Syngenta, Toray |
|||
Textile Effects |
Textile chemicals and dyes |
Apparel, home and technical textiles |
Aunde, Esquel Group, Fruit of the Loom, Guilford Mill, Hanes Brands, Nice Dyeing, Polartec, Tencate, Y.R.C., Zaber & Zubair |
|||
Pigments |
Titanium dioxide |
Paints and coatings, plastics, paper, printing inks, fibers and ceramics |
AkzoNobel, Clariant, Jotun, PolyOne, PPG |
4
THE EXCHANGE OFFER
Securities Offered |
$250,000,000 aggregate principal amount of new notes which have been registered under the Securities Act of 1933, as amended (the "Securities Act"). The terms of the new notes are substantially identical to the old notes, except that certain transfer restrictions, registration rights and liquidated damages provisions relating to the old notes do not apply to the registered new notes. | |
The Exchange Offer |
We are offering to issue registered new notes in exchange for like principal amount and like denomination of our old notes. We are offering to issue these registered new notes to satisfy our obligations under an exchange and registration rights agreement that we entered into with the initial purchasers of the old notes when we sold them in a transaction that was exempt from the registration requirements of the Securities Act. You may tender your old notes for exchange by following the procedures described under the heading "The Exchange Offer." |
|
Tenders; Expiration Date; Withdrawal |
The exchange offer will expire at 5:00 p.m., New York City time, on May 6, 2013, unless we extend it. The exchange offer will be open for at least twenty (20) business days to ensure compliance with Rule 14e-1(a) under the Securities Exchange Act of 1934, as amended (the "Exchange Act"). If you decide to exchange your old notes for new notes, you must acknowledge, among other things, that you are acquiring the new notes in the ordinary course of your business, that you have no arrangement or understanding with any person to participate in a distribution of the new notes and that you are not an affiliate of our Company. You may withdraw any notes that you tender for exchange at any time prior to 5:00 p.m., New York City time, on the expiration date. If we decide for any reason not to accept any old notes you have tendered for exchange, those notes will be returned to you without cost promptly after the expiration or termination of the exchange offer. See "The Exchange Offer—Terms of the Exchange Offer" and "—Withdrawal Rights" for a more complete description of the tender and withdrawal provisions. |
|
Conditions to the Exchange Offer |
The exchange offer is subject to customary conditions and we may terminate or amend the exchange offer if any of these conditions occur prior to the expiration of the exchange offer. These conditions include any change in applicable law or legal interpretation or governmental or regulatory actions that would impair our ability to proceed with the exchange offer, any general suspension or general limitation relating to trading of securities on any national securities exchange or the over-the-counter market or a declaration of war or other hostilities involving the United States. We may waive any of these conditions in our sole discretion. |
5
Procedures for Tendering Old Notes |
A holder who wishes to tender old notes in the exchange offer must transmit to Wells Fargo Bank, National Association (the "exchange agent") a completed and executed letter of transmittal or an agent's message, transmitted by a book-entry transfer facility, which letter of transmittal or agent's message must be received by the exchange agent prior to 5:00 p.m., New York City time, on the expiration date. In addition, the exchange agent must receive a timely confirmation of book-entry transfer of the old notes into the exchange agent's account at The Depository Trust Company, or DTC, under the procedures for book-entry transfers described in "The Exchange Offer—How to Tender Old Notes for Exchange." |
|
|
Old notes may be tendered by electronic transmission of acceptance through DTC's Automated Tender Offer Program, which we refer to as ATOP. Custodial entities that are participants in DTC must tender old notes through ATOP. A physical letter of transmittal need not accompany tenders effected through ATOP, although the electronic instructions sent to DTC and transmitted to the exchange agent must contain your acknowledgement of receipt of, and your agreement to be bound by, the letter of transmittal. Please carefully follow the instructions contained in this document on how to tender your securities. See "The Exchange Offer—DTC Book Entry Transfers." |
|
|
A holder who holds old notes through Euroclear Bank S.A./N.V. ("Euroclear") or Clearstream Banking, S.A. ("Clearstream") must comply with the procedures of Euroclear or Clearstream, as applicable, when tendering its old notes. |
|
Exchange Offer; Exchange and Registration Rights |
The old notes were sold pursuant to a purchase agreement dated February 28, 2013. Under the exchange and registration rights agreement, we have agreed to use our reasonable best efforts to commence and consummate the exchange offer within 45 days after the date on which the registration statement of which this prospectus is a part is declared effective. In addition, we have agreed to file a "shelf registration statement" that would allow some or all of the old notes to be offered to the public if we are unable to complete the exchange offer or a change in applicable laws or legal interpretation occurs that would limit the intended effects or availability of the exchange offer. |
6
Penalty Interest |
If we fail to fulfill certain obligations under the exchange and registration rights agreement, including if the registration statement of which this prospectus is a part is not declared effective by the Securities and Exchange Commission, or SEC, on or before November 29, 2013 or if the exchange offer has not been completed within 45 business days after the effective date of such registration statement (a "registration default"), the annual interest rate on the notes will increase by 0.125% during the first 90-day period during which the registration default continues, and will increase by an additional 0.125% for each subsequent 90-day period during which the registration default continues, up to a maximum increase of 0.50% over the interest rate that would otherwise apply to the old notes. As soon as we cure a registration default, the interest rates on the notes will revert to their original levels. |
|
U.S. Federal Tax Consequences |
Your exchange of old notes for new notes in the exchange offer will not result in any gain or loss to you for United States federal income tax purposes. See "Material United States Federal Income Tax Consequences." |
|
Use of Proceeds |
We will not receive any cash proceeds from the exchange offer. In consideration for issuing the new notes in the exchange offer as contemplated in this prospectus, we will receive in exchange old notes in like principal amount, which will be cancelled and as such will not result in any increase in our indebtedness. We will pay all expenses incident to the exchange offer. See "Use of Proceeds" for a discussion of the use of proceeds from the issuance of the old notes. |
|
Exchange Agent |
Wells Fargo Bank, National Association |
|
Consequences of Failure to Exchange |
Old notes that are not tendered or that are tendered but not accepted will continue to be subject to the restrictions on transfer that are described in the legend on those notes. In general, you may offer or sell your old notes only if they are registered under, or offered or sold under an exemption from, the Securities Act and applicable state securities laws. We, however, will have no further obligation to register the old notes. If you do not participate in the exchange offer, the liquidity of your notes could be adversely affected. |
|
Consequences of Exchanging Your Old Notes |
Based on interpretations of the SEC set forth in certain no-action letters issued to third parties, we believe that you may offer for resale, resell or otherwise transfer the new notes that we issue in the exchange offer without complying with the registration and prospectus delivery requirements of the Securities Act if you: |
|
|
• acquire the new notes issued in the exchange offer in the ordinary course of your business; |
7
|
• are not participating, do not intend to participate, and have no arrangement or understanding with anyone to participate, in the distribution of the new notes issued to you in the exchange offer; and |
|
|
• are not an "affiliate" of our Company as defined in Rule 405 of the Securities Act. |
|
|
If any of these conditions are not satisfied and you transfer any new notes issued to you in the exchange offer without delivering a proper prospectus or without qualifying for a registration exemption, you may incur liability under the Securities Act. We will not be responsible for, or indemnify you against, any liability you may incur. |
|
|
In connection with the exchange offer, you will be required to acknowledge that you are not engaged in, and do not intend to engage in, the distribution of the new notes. In addition, any broker-dealer that acquires new notes in the exchange offer for its own account in exchange for old notes which it acquired through market-making or other trading activities may be an "underwriter" within the meaning of the Securities Act and must acknowledge that it will deliver a prospectus when it resells or transfers any new notes. See "Plan of Distribution" for a description of the prospectus delivery obligations of broker-dealers in the exchange offer. |
THE NEW NOTES
The terms of the new notes and those of the old notes are identical in all material respects, except:
8
A brief description of the material terms of the new notes follows:
| Issuer | Huntsman International LLC. | |
Notes Offered |
$250.0 million in aggregate principal amount of 4.875% senior notes due 2020. |
|
Maturity |
November 15, 2020. |
|
Interest |
The new notes will bear interest at a rate of 4.875% per annum, payable semi-annually on May 15 and November 15 of each year, commencing on May 15, 2013. Interest on the new notes will accrue from November 19, 2012. |
|
Guarantees |
The new notes will be unconditionally guaranteed by substantially all of our domestic subsidiaries and certain of our foreign subsidiary holding companies that are treated as U.S. entities for tax purposes. See "Description of New Notes—Brief Description of the Notes and the Guarantees—The Guarantees." |
|
Ranking |
The new notes: |
|
|
• will be our general unsecured senior obligations; |
|
|
• will rank equally in right of payment with all of our existing and future senior indebtedness; |
|
|
• will rank senior in right of payment to our currently outstanding 8.625% Senior Subordinated Notes due 2020 and 2021, as well as future subordinated indebtedness, if any; |
|
|
• will be effectively subordinated to all existing and future secured indebtedness, including indebtedness under our senior secured credit facilities, to the extent of the value of the collateral securing such indebtedness; and |
|
|
• will be structurally subordinated to all of our existing and future indebtedness and other liabilities, including trade payables, of our nonguarantor subsidiaries. |
|
Since the notes are unsecured, in the event of a bankruptcy or insolvency, our secured creditors will have a prior secured claim to any collateral securing the debt owed to them. |
||
The guarantees: |
||
|
• will be the general unsecured senior obligations of the guarantors; |
9
|
• will rank equally in right of payment to the guarantees of all existing and future senior indebtedness of the guarantors; |
|
|
• will be senior in right of payment to all existing and future subordinated indebtedness of the guarantors, if any; and |
|
|
• will be effectively subordinated to all of our existing and future secured indebtedness, including indebtedness under our senior secured credit facilities, to the extent of the value of the collateral securing such indebtedness. |
|
Since the guarantees are unsecured obligations of each guarantor, in the event of a bankruptcy or insolvency, such guarantor's secured creditors will have a prior secured claim to any collateral securing the debt owed to them. |
||
As of December 31, 2012, we and the guarantors had approximately $2.9 billion of outstanding senior indebtedness (excluding intercompany subsidiary indebtedness but including the note payable to our parent), of which approximately $1.6 billion was secured. Further and not included above, our subsidiaries which are not guarantors had approximately $661 million of indebtedness (excluding intercompany subsidiary indebtedness) outstanding on December 31, 2012. See "Note 28. Condensed Consolidating Financial Information" to the audited consolidated financial statements, for certain financial information about our nonguarantor subsidiaries. |
||
Optional Redemption |
We may, in whole at any time or in part from time to time prior to the date that is 90 days prior to the scheduled maturity date of the notes, redeem the notes at our option at a redemption price equal to 100% of the principal amount thereof plus the applicable "make-whole" premium as of, and accrued and unpaid interest and special interest, if any, to, but not including, the applicable redemption date. |
|
In addition, we may, in whole at any time or in part from time to time after the date that is 90 days prior to the final maturity date of the notes, redeem the notes at our option at a redemption price equal to 100% of the principal amount thereof plus accrued and unpaid interest and special interest, if any, to, but not including, the applicable redemption date. |
10
| Change of Control | If we undergo a change of control repurchase event (as defined in the indenture), we will be required to make an offer to purchase each holder's notes at a price equal to 101% of their face amount plus accrued and unpaid interest and special interest, if any, to the date of repurchase. "Description of Notes—Change of Control." | |
Certain Covenants |
The indenture governing the notes contains covenants that, among other things, limit our ability and the ability of certain of our subsidiaries to: |
|
|
• incur additional secured indebtedness; |
|
|
• incur indebtedness of nonguarantor subsidiaries; |
|
|
• engage in certain sale-leaseback transactions with affiliates; and |
|
|
• merge or consolidate with or into any other person or lease, sell or transfer substantially all our properties and assets. |
|
These covenants are subject to a number of important exceptions and qualifications, which are described in "Description of Notes—Certain Covenants." |
||
Governing Law |
The notes and the indenture governing the notes are governed by New York law. |
|
No Prior Market |
The notes are a new issue of securities and there is currently no established trading market for the notes. An active or liquid market may not develop for the notes. The initial purchasers have advised us that they currently intend to make a market in these notes. However, the initial purchasers are not obligated to do so and they may discontinue market making at any time. See "Plan of Distribution." |
|
Risk Factors |
See "Risk Factors" beginning on page 13 of this prospectus for important information regarding us and this exchange offer. |
For additional information regarding the new notes, see "Description of New Notes."
FAILURE TO EXCHANGE YOUR OLD NOTES
The old notes which you do not tender or we do not accept will, following the exchange offer, continue to be restricted securities. Therefore, you may only transfer or resell them in a transaction registered under or exempt from the Securities Act and all applicable state securities laws. We will issue the new notes in exchange for the old notes under the exchange offer only following the satisfaction of the procedures and conditions described under the caption "The Exchange Offer."
11
Because we anticipate that most holders of the old notes will elect to exchange their old notes, we expect that the liquidity of the markets, if any, for any old notes remaining after the completion of the exchange offer will be substantially limited. Any old notes tendered and exchanged in the exchange offer will reduce the aggregate principal amount outstanding of the old notes.
OTHER DEBT
The indenture governing the notes limits our ability to incur additional debt. Consequently, we would be required to obtain an amendment of the indenture before we incurred any additional debt, other than the types of debt specifically identified in the indenture as permitted.
SUMMARY HISTORICAL FINANCIAL DATA
The summary historical financial data set forth below presents our historical financial data as of and for the dates and periods indicated. You should review this summary historical financial data in conjunction with "Management's Discussion and Analysis of Financial Condition and Results of Operations" and our audited consolidated financial statements and accompanying notes.
| |
Year Ended December 31, | |||||||||||||||
|---|---|---|---|---|---|---|---|---|---|---|---|---|---|---|---|---|
| (in millions) |
2012 | 2011 | 2010 | 2009 | 2008 | |||||||||||
Statements of Operations Data: |
||||||||||||||||
Revenues |
$ | 11,187 | $ | 11,221 | $ | 9,250 | $ | 7,665 | $ | 10,056 | ||||||
Gross profit |
2,041 | 1,858 | 1,478 | 1,095 | 1,297 | |||||||||||
Restructuring, impairment and plant closing costs |
92 | 167 | 29 | 88 | 31 | |||||||||||
Operating income |
869 | 629 | 443 | 41 | 215 | |||||||||||
Income (loss) from continuing operations |
380 | 257 | 144 | (399 | ) | (59 | ) | |||||||||
(Loss) income from discontinued operations, net of tax(a) |
(7 | ) | (1 | ) | 42 | (19 | ) | 84 | ||||||||
Extraordinary gain (loss) on the acquisition of a business, net of tax of nil(b) |
2 | 4 | (1 | ) | 6 | 14 | ||||||||||
Net income (loss) |
375 | 260 | 185 | (412 | ) | 39 | ||||||||||
Net income (loss) attributable to Huntsman International LLC |
365 | 253 | 180 | (410 | ) | 38 | ||||||||||
Other Data: |
||||||||||||||||
Depreciation and amortization |
$ | 408 | $ | 416 | $ | 382 | $ | 420 | $ | 374 | ||||||
Capital expenditures |
412 | 330 | 236 | 189 | 418 | |||||||||||
Balance Sheet Data (at period end): |
||||||||||||||||
Total assets |
$ | 8,870 | $ | 8,330 | $ | 8,307 | $ | 7,693 | $ | 7,424 | ||||||
Total debt |
4,401 | 4,481 | 4,685 | 4,531 | 4,076 | |||||||||||
Total liabilities |
7,653 | 7,239 | 7,219 | 6,846 | 6,505 | |||||||||||
12
You should carefully consider the risks and uncertainties below and the other information contained in this prospectus before you decide whether to exchange your old notes for new notes. Any of the following risks could materially and adversely affect our business, results of operations and financial condition. In this section of the prospectus, references to the notes mean the new notes.
Risks Related to Our Business
Our industry is affected by global economic factors including risks associated with volatile economic conditions.
Our financial results are substantially dependent on overall economic conditions in the United States, Europe and Asia. Declining economic conditions in all or any of these locations—or negative perceptions about economic conditions—could result in a substantial decrease in demand for our products and could adversely affect our business. In particular, our operations in Europe continue to be impacted by the uncertain European economy. While we currently anticipate that, in the aggregate, our business in Europe will grow slowly, a currency or financial crisis in Europe could precipitate a significant decline in the European economy, which would likely result in a decrease in demand for our products in Europe.
Uncertain economic conditions and market instability make it particularly difficult for us to forecast demand trends. The timing and extent of any changes to currently prevailing market conditions is uncertain, and supply and demand may be unbalanced at any time. As a consequence, we may not be able to accurately predict future economic conditions or the effect of such conditions on our financial condition or results of operations. We can give no assurances as to the timing, extent or duration of the current or future economic cycles impacting the chemical industry.
The markets for many of our products are cyclical and volatile, and we may experience depressed market conditions for such products.
Historically, the markets for many of our products have experienced alternating periods of tight supply, causing prices and profit margins to increase, followed by periods of capacity additions, resulting in oversupply and declining prices and profit margins. The volatility these markets experience occurs as a result of changes in the supply and demand for products, changes in energy prices and changes in various other economic conditions around the world. For example, demand for our products depends in part on the housing and construction industries. These industries are cyclical in nature and have historically been impacted by downturns in the economy. The cyclicality and volatility of our industry results in significant fluctuations in profits and cash flow from period to period and over the business cycle.
Disruptions in production at our manufacturing facilities, both planned and unplanned, may have a material impact on our business, results of operations and/or financial condition.
Manufacturing facilities in our industry are subject to planned and unplanned production shutdowns, turnarounds and outages. Unplanned production disruptions may occur for external reasons including natural disasters, weather, disease, strikes, transportation interruption, government regulation, political unrest or terrorism, or internal reasons, such as fire, unplanned maintenance or other manufacturing problems. Alternative facilities with sufficient capacity may not be available, may cost substantially more or may take a significant time to increase production or qualify with our customers, each of which could negatively impact our business, results of operations and/or financial condition. Long-term production disruptions may cause our customers to seek alternative supply which could further adversely affect our profitability.
13
Our results of operations may be adversely affected by international business risks, including fluctuations in currency exchange rates, legal restrictions and taxes.
We conduct a majority of our business operations outside the U.S., and these operations are subject to risks normally associated with international operations. These risks include the need to convert currencies that may be received for our products into currencies in which we purchase raw materials or pay for services, which could result in a gain or loss depending on fluctuations in exchange rates. In addition, we translate our local currency financial results into U.S. dollars based on average exchange rates prevailing during the reporting period or the exchange rate at the end of that period. During times of a strengthening U.S. dollar, our reported international sales and earnings may be reduced because the local currency may translate into fewer U.S. dollars. Because we currently have significant operations located outside the U.S., we are exposed to fluctuations in global currency rates which may result in gains or losses on our financial statements.
Other risks of international operations include trade barriers, tariffs, exchange controls, national and regional labor strikes, social and political risks, general economic risks and required compliance with a variety of U.S. and foreign laws, including tax laws, the Foreign Corrupt Practices Act (and foreign equivalents), export controls and OFAC regulations. In addition, although we maintain an anti-corruption compliance program throughout our Company, violations of our compliance program may result in criminal or civil sanctions, including material monetary fines, penalties and other costs against us or our employees, and may have a material adverse effect on our business. Furthermore, in foreign jurisdictions where process of law may vary from country to country, we may experience difficulty in enforcing agreements. In jurisdictions where bankruptcy laws and practices may vary, we may experience difficulty collecting foreign receivables through foreign legal systems. The occurrence of these risks, among others, could disrupt the businesses of our international subsidiaries, which could significantly affect their ability to make distributions to us.
We operate in a significant number of jurisdictions, which contributes to the volatility of our effective tax rate. Changes in tax laws or the interpretation of tax laws in the jurisdictions in which we operate may affect our effective tax rate. In addition, generally accepted accounting principles in the U.S. ("GAAP" or "U.S. GAAP") has required us to place valuation allowances against our net operating losses and other deferred tax assets in a significant number of tax jurisdictions. These valuation allowances result from analysis of positive and negative evidence supporting the realization of tax benefits. Negative evidence includes a cumulative history of pre-tax operating losses in specific tax jurisdictions. Changes in valuation allowances have resulted in material fluctuations in our effective tax rate. Economic conditions may dictate the continued imposition of the current valuation allowances and potentially the establishment of new valuation allowances. While significant valuation allowances remain, our effective tax rate will likely continue to experience significant fluctuations.
If we are unable to execute our cost reduction plans successfully, our total operating costs may be greater than expected, which may adversely affect our profitability.
We have commenced a number of actions to restructure our Polyurethanes, Textile Effects and Advanced Materials segments to improve our earnings profile. We are in the process of implementing these programs and have realized a portion of the anticipated benefits. While we continue to search for opportunities to reduce our costs and expenses to improve operating profitability without jeopardizing the quality of our products or the effectiveness of our operations, our success in achieving targeted cost and expense reductions depends upon a number of factors. If we do not successfully execute on our cost reduction initiatives or if we experience delays in completing the implementation of these initiatives, our results of operations or financial condition could be adversely affected.
14
Our efforts to grow our businesses may require significant investments; if our growth strategies are unsuccessful, our business, results of operations and/or financial condition may be materially adversely affected.
We continuously evaluate growth opportunities. Our growth initiatives may involve making acquisitions, entering into partnerships and joint ventures, and building new facilities—any of which could require a significant investment. We have incurred indebtedness to finance growth initiatives, and we may incur additional indebtedness to finance future growth initiatives. We could also issue additional shares of stock to finance such initiatives. If our growth strategies are not successful, we could face increased financial pressure, such as increased cash flow demands, reduced liquidity and diminished access to financial markets.
In addition, the implementation of growth strategies may create additional risks, including:
All of these risks could have a material adverse effect on our business, results of operations and financial condition.
Significant price volatility or interruptions in supply of our raw materials may result in increased costs that we may be unable to pass on to our customers, which could reduce our profitability.
The prices of the raw materials that we purchase from third parties are cyclical and volatile. We purchase a substantial portion of our raw materials from third- party suppliers. The cost of these raw materials represents a substantial portion of our operating expenses. The prices for a number of these raw materials generally follow price trends of, and vary with market conditions for, crude oil and natural gas feedstocks, which are highly volatile and cyclical.
In general, the feedstocks and other raw materials we consume are organic commodity products that are readily available at market prices. However, ore feedstocks for our Pigments segment are periodically in short supply. We frequently enter into supply agreements with particular suppliers, but disruptions of existing supply arrangements or expiration of favorable supply contracts could substantially impact our profitability. If certain of our suppliers are unable to meet their obligations under present supply agreements, we may be forced to pay higher prices to obtain the necessary raw materials from other sources and we may not be able to increase prices for our finished products to recoup the higher raw materials costs. In addition, if raw materials become unavailable within a geographic area from which they are now sourced, then we may not be able to obtain suitable or cost effective substitutes. Any interruption in the supply of raw materials could increase our costs or decrease our revenues, which could reduce our cash flow.
15
Our supply agreements typically provide for market-based pricing and provide us only limited protection against price volatility. While we attempt to match cost increases with corresponding product price increases, we are not always able to raise product prices immediately or at all. Timing differences between raw material prices, which may change daily, and contract product prices, which in many cases are negotiated only monthly or less often, have had and may continue to have a negative effect on our cash flow. Any cost increase that we are not able to pass on to our customers could have a material adverse effect on our business, results of operations, financial condition and liquidity.
Financial difficulties and related problems at our customers, vendors, suppliers and other business partners could have a material adverse effect on our business.
During periods of economic disruption, more of our customers than normal may experience financial difficulties, including bankruptcies, restructurings and liquidations, which could affect our business by reducing sales, increasing our risk in extending trade credit to customers and reducing our profitability. A significant adverse change in a customer relationship or in a customer's financial position could cause us to limit or discontinue business with that customer, require us to assume more credit risk relating to that customer's receivables or limit our ability to collect accounts receivable from that customer. In addition, we rely on a number of vendors and suppliers and collaborations with other industry participants to provide us with chemicals, feedstocks and other raw materials, along with energy sources and, in certain cases, facilities, that we need to operate our business. During periods of economic disruption, some of these companies could be forced to reduce their output, shut down their operations or file for bankruptcy protection. If this were to occur, it could adversely affect their ability to provide us with the raw materials, energy sources or facilities that we need, which could materially disrupt our operations, including the production of certain of our products. Moreover, it could be difficult to find replacements for certain of our business partners without incurring significant delays or cost increases. All of these risks could have a material adverse effect on our business, results of operations, financial condition and liquidity.
The industries in which we compete are highly competitive, and we may not be able to compete effectively with our competitors that have greater financial resources, which could have a material adverse effect on our business, results of operations and financial condition.
The industries in which we operate are highly competitive. Among our competitors are some of the world's largest chemical companies and major integrated petroleum companies that have their own raw material resources. Changes in the competitive landscape could make it difficult for us to retain our leadership position in various products and markets throughout the world. In addition, some of the companies with whom we compete may be able to produce products more economically than we can. Furthermore, some of our competitors have greater financial resources, which may enable them to invest significant capital into their businesses, including expenditures for research and development. Some of our competitors are owned or partially owned by foreign governments which may provide a competitive advantage to those competitors. While we are engaged in a range of research and development programs to develop new products and processes, to improve and refine existing products and processes, and to develop new applications for existing products, the failure to develop new products, processes or applications could make us less competitive. Moreover, if any of our current or future competitors develops proprietary technology that enables them to produce products at a significantly lower cost, our technology could be rendered uneconomical or obsolete. Further, it is possible we could be named in future litigation for the infringement or misappropriation of a competitor's or other third party's intellectual property rights, which could include a claim for injunctive relief and damages, and, if so, the adverse results could have a material adverse effect on our business, results of operations and financial position.
16
In addition, certain of our businesses use technology that is widely available. Accordingly, barriers to entry, apart from capital availability, may be low in certain product segments of our business, and the entrance of new competitors into the industry may reduce our ability to capture improving profit margins in circumstances where capacity utilization in the industry is increasing. Further, petroleum-rich countries have become more significant participants in the petrochemical industry and may expand this role significantly in the future. Increased competition in any of our businesses could compel us to reduce the prices of our products, which could result in reduced profit margins and loss of market share and have a material adverse effect on our business, results of operations, financial condition and liquidity.
Natural or other disasters could disrupt our business and result in loss of revenue or in higher expenses.
Any serious disruption at any of our facilities due to hurricane, fire, earthquake, flood or any other natural or man-made disaster could impair our ability to use our facilities and have a material impact on our revenues and increase our costs and expenses. If there is a natural disaster or other serious disruption at any of these facilities, it could impair our ability to adequately supply our customers and negatively impact our operating results. In addition, many of our current and potential customers are concentrated in specific geographic areas including the U.S. Gulf Coast, which is subject to hurricanes. A disaster in one of these regions could have a material impact on our operations, operating results and financial condition.
While we maintain business recovery plans that are intended to allow us to recover from natural disasters or other events that could disrupt our business, we cannot provide assurances that our plans would fully protect us from all such disasters or events that might result due to climate change. In addition, insurance may not adequately compensate us from any losses incurred as a result of natural or other disasters. Furthermore, in areas prone to frequent natural or other disasters, insurance may become increasingly expensive or not available at all.
Our operations involve risks that may increase our operating costs, which could reduce our profitability.
Although we take precautions to enhance the safety of our operations and minimize the risk of disruptions, our operations are subject to hazards inherent in the manufacturing and marketing of chemical products. These hazards include: chemical spills, pipeline leaks and ruptures, storage tank leaks, discharges or releases of toxic or hazardous substances or gases and other hazards incident to the manufacturing, processing, handling, transportation and storage of dangerous chemicals. We are also potentially subject to other hazards, including natural disasters and severe weather; explosions and fires; transportation problems, including interruptions, spills and leaks; mechanical failures; unscheduled downtimes; labor difficulties; remediation complications; and other risks. Many potential hazards can cause bodily injury and loss of life, severe damage to or destruction of property and equipment and environmental damage, and may result in suspension of operations and the imposition of civil or criminal penalties and liabilities. Furthermore, we are subject to present and future claims with respect to workplace exposure, exposure of contractors on our premises as well as other persons located nearby, workers' compensation and other matters.
We maintain property, business interruption, products liability and casualty insurance policies which we believe are in accordance with customary industry practices, as well as insurance policies covering other types of risks, including pollution legal liability insurance, but we are not fully insured against all potential hazards and risks incident to our business. Each of these insurance policies is subject to customary exclusions, deductibles and coverage limits, in accordance with industry standards and practices. As a result of market conditions, premiums and deductibles for certain insurance policies can increase substantially and, in some instances, certain insurance may become unavailable or available only for reduced amounts of coverage. If we were to incur a significant liability for which we were not
17
fully insured, it could have a material adverse effect on our business, results of operations, financial condition and liquidity.
In addition, we are subject to various claims and litigation in the ordinary course of business. We are a party to various pending lawsuits and proceedings. For more information, see "Business—Legal Proceedings—Antitrust Matters" below. It is possible that judgments could be rendered against us in these cases or others in which we could be uninsured or not covered by indemnity and beyond the amounts that we currently have reserved or anticipate incurring for such matters.
Our operations, financial condition and liquidity could be adversely affected by legal claims against us, including antitrust claims.
We face risks arising from various legal actions, including matters relating to antitrust, product liability, intellectual property and environmental claims. Over the past few years, antitrust claims have been made against chemical companies, and we have been named as a defendant in the antitrust suits discussed in "Business—Legal Proceedings—Antitrust Matters" below. In this type of litigation, the plaintiffs generally seek treble damages, which may be significant. An adverse outcome in any antitrust claim could be material and significantly impact our operations, financial condition and liquidity.
We are subject to many environmental, health and safety ("EHS") regulations that may result in unanticipated costs or liabilities, which could reduce our profitability.
We are subject to extensive federal, state, local and foreign laws, regulations, rules and ordinances relating to pollution, protection of the environment and human health and safety, and the generation, storage, handling, transportation, treatment, disposal and remediation of hazardous substances and waste materials. Actual or alleged violations of EHS laws or permit requirements could result in restrictions or prohibitions on plant operations and substantial civil or criminal sanctions, as well as, under some EHS laws, the assessment of strict liability and/or joint and several liability.
Governmental, regulatory and societal demands for increasing levels of product safety and environmental protection could result in increased pressure for more stringent regulatory control with respect to the chemical industry. In addition, these concerns could influence public perceptions regarding our products and operations, the viability of certain products, our reputation, the cost to comply with regulations, and the ability to attract and retain employees. Moreover, changes in EHS regulations could inhibit or interrupt our operations, or require us to modify our facilities or operations. Accordingly, environmental or regulatory matters may cause us to incur significant unanticipated losses, costs or liabilities, which could reduce our profitability.
We could incur significant expenditures in order to comply with existing or future EHS laws. Capital expenditures and costs relating to EHS matters will be subject to evolving regulatory requirements and will depend on the timing of the promulgation and enforcement of specific standards which impose requirements on our operations. Capital expenditures and costs beyond those currently anticipated may therefore be required under existing or future EHS laws.
Furthermore, we may be liable for the costs of investigating and cleaning up environmental contamination on or from our properties or at off-site locations where we disposed of or arranged for the disposal or treatment of hazardous materials or from disposal activities that pre-dated our purchase of our businesses. We may therefore incur additional costs and expenditures beyond those currently anticipated to address all such known and unknown situations under existing and future EHS laws.
18
We are subject to risks relating to our information technology systems, and any failure to adequately protect our critical information technology systems could materially affect our operations.
We rely on information technology systems across our operations, including for management, supply chain and financial information and various other processes and transactions. Our ability to effectively manage our business depends on the security, reliability and capacity of these systems. Information technology system failures, network disruptions or breaches of security could disrupt our operations, causing delays or cancellation of customer orders or impeding the manufacture or shipment of products, processing of transactions or reporting of financial results. An attack or other problem with our systems could also result in the disclosure of proprietary information about our business or confidential information concerning our customers or employees, which could result in significant damage to our business and our reputation.
We have put in place security measures designed to protect against the misappropriation or corruption of our systems, intentional or unintentional disclosure of confidential information, or disruption of our operations. Current employees have, and former employees may have, access to a significant amount of information regarding our operations which could be disclosed to our competitors or otherwise used to harm us. Moreover, our operations in certain locations, such as China, may be particularly vulnerable to security attacks or other problems. Any breach of our security measures could result in unauthorized access to and misappropriation of our information, corruption of data or disruption of operations or transactions, any of which could have a material adverse effect on our business.
In addition, we could be required to expend significant additional amounts to respond to information technology issues or to protect against threatened or actual security breaches. We may not be able to implement measures that will protect against all of the significant risks to our information technology systems.
Regulatory or market changes with respect to MTBE may materially reduce our sales and/or materially increase our costs.
We produce MTBE, an oxygenate that is blended with gasoline to reduce vehicle air emissions and to enhance the octane rating of gasoline. Because MTBE has contaminated some water supplies, its use has become controversial in the U.S. and elsewhere, and its use has been effectively eliminated in the U.S. market. We currently market MTBE, either directly or through third parties, to gasoline additive customers located outside the U.S. This business has been profitable to us over time, and future legislative or regulatory initiatives outside the U.S. restricting MTBE could materially adversely affect our ability to market and sell MTBE and our profitability. We have recently announced a joint venture with Sinopec involving the construction and operation of a PO/MTBE facility in China, which will further expose us to these risks
While we could use all or a portion of our precursor TBA to produce saleable products other than MTBE, this would require significant capital expenditures to modify our facilities. Moreover, the sale of other products would produce a lower level of cash flow than that historically produced from the sale of MTBE.
Our business is dependent on our intellectual property. If our intellectual property rights cannot be enforced or our trade secrets become known to our competitors, our ability to compete may be adversely affected.
Proprietary protection of our processes, apparatuses and other technology is important to our business. While a presumption of validity exists with respect to patents issued to us in the U.S., there can be no assurance that any of our patents will not be challenged, invalidated, circumvented or rendered unenforceable. Furthermore, if any pending patent application filed by us does not result in an issued patent, or if patents are issued to us, but such patents do not provide meaningful protection
19
of our intellectual property, then our ability to compete may be adversely affected. Additionally, our competitors or other third parties may obtain patents that restrict or preclude our ability to lawfully produce or sell our products in a competitive manner, which could have a material adverse effect on our business, results of operations, financial condition and liquidity.
We also rely upon unpatented proprietary know-how and continuing technological innovation and other trade secrets to develop and maintain our competitive position. While it is our policy to enter into agreements imposing confidentiality obligations upon our employees and third parties to protect our intellectual property, these confidentiality obligations may be breached, may not provide meaningful protection for our trade secrets or proprietary know-how, or adequate remedies may not be available in the event of an unauthorized access, use or disclosure of our trade secrets and know-how. In addition, others could obtain knowledge of our trade secrets through independent development or other access by legal means.
We may have to rely on judicial enforcement of our patents and other proprietary rights. We may not be able to effectively protect our intellectual property rights from misappropriation or infringement in countries where effective patent, trademark, trade secret and other intellectual property laws and judicial systems may be unavailable, or may not protect our proprietary rights to the same extent as U.S. law.
The failure of our patents or confidentiality agreements to protect our processes, apparatuses, technology, trade secrets or proprietary know-how or the failure of adequate legal remedies for related actions could have a material adverse effect on our business, results of operations, financial condition and liquidity.
Loss of key members of our management could disrupt our business.
We depend on the continued employment and performance of our senior executives and other key members of management. If any of these individuals resigns or becomes unable to continue in his or her present role and is not adequately replaced, our business operations and our ability to implement our growth strategies could be materially disrupted. We generally do not have employment agreements with, and we do not maintain any "key person" life insurance for, any of our executive officers.
Conflicts, military actions, terrorist attacks and general instability, in particular in certain energy-producing nations, along with increased security regulations related to our industry, could adversely affect our business.
Conflicts, military actions and terrorist attacks have precipitated economic instability and turmoil in financial markets. Instability and turmoil, particularly in energy-producing nations, may result in raw material cost increases. The uncertainty and economic disruption resulting from hostilities, military action or acts of terrorism may impact any or all of our facilities and operations or those of our suppliers or customers. Accordingly, any conflict, military action or terrorist attack that impacts us or any of our suppliers or customers, could have a material adverse effect on our business, results of operations, financial condition and liquidity.
In addition, a number of governments have instituted regulations attempting to increase the security of chemical plants and the transportation of hazardous chemicals, which could result in higher operating costs and could have a material adverse effect on our financial condition and liquidity.
If our subsidiaries do not make sufficient distributions to us, then we will not be able to make payment on our debts.
Our debt is generally the exclusive obligation of our Company and our guarantor subsidiaries. Because a significant portion of our operations are conducted by nonguarantor subsidiaries, our cash flow and our ability to service indebtedness, including our ability to pay the interest on our debt when
20
due and principal of such debt at maturity, are dependent to a large extent upon cash dividends and distributions or other transfers from such nonguarantor subsidiaries. Any payment of dividends, distributions, loans or advances by our nonguarantor subsidiaries to us could be subject to restrictions on dividends or repatriation of earnings under applicable local law, monetary transfer restrictions and foreign currency exchange regulations in the jurisdictions in which our subsidiaries operate, and any restrictions imposed by the current and future debt instruments of our nonguarantor subsidiaries. In addition, payments to us by our subsidiaries are contingent upon our subsidiaries' earnings.
Our subsidiaries are separate legal entities and, except for our guarantor subsidiaries, have no obligation, contingent or otherwise, to pay any amounts due on our debt or to make any funds available for those amounts, whether by dividends, loans, distributions or other payments, and do not guarantee the payment of interest on, or principal of, our debt. Any right that we have to receive any assets of any of our subsidiaries that are not guarantors upon the liquidation or reorganization of any such subsidiary, and the consequent right of holders of notes to realize proceeds from the sale of their assets, will be structurally subordinated to the claims of that subsidiary's creditors, including trade creditors and holders of debt issued by that subsidiary.
Regulatory requirements to reduce emissions of greenhouse gases could have an adverse effect on our results of operations.
Globally, our operations are increasingly subject to regulations that seek to reduce emissions of greenhouse gases, or GHGs, such as carbon dioxide and methane, which may be contributing to changes in the Earth's climate. At the most recent negotiations of the Conference of the Parties to the Kyoto Protocol, a limited group of nations, including the EU, agreed to a second commitment period for the Kyoto Protocol, an international treaty that provides for reductions in GHG emissions. More significantly, the European Union GHG Emissions Trading System, established pursuant to the Kyoto Protocol to reduce GHG emissions in the EU, has just entered its third phase and ongoing reforms at the EU level—including measures to prop up carbon credit prices and ban the use of certain types of certified emission reductions—may increase our operating costs. Australia has also adopted a carbon trading system that has been recognized for formal linkage with the EU trading system by 2018. Australia's GHG cap-and-trade program may impose compliance obligations upon our operations that may increase our operating costs. In the United States, California has commenced the first compliance period of its cap-and-trade program.
Federal climate change legislation in the United States appears unlikely in the near-term. As a result, domestic efforts to curb GHG emissions will be led by the EPA's GHG regulations and the efforts of states. To the extent that our domestic operations are subject to the EPA's GHG regulations, we may face increased capital and operating costs associated with new or expanded facilities. Expansions of our existing facilities or construction of new facilities may be subject to the Clean Air Act's Prevention of Significant Deterioration requirements under the EPA's GHG "Tailoring Rule." Our facilities are also subject to the EPA's Mandatory Reporting of Greenhouse Gases rule, and the collection and reporting of GHG data may increase our operational costs.
Under a consent decree with states and environmental groups, the EPA is due to propose new source performance standards (NSPS) for GHG emissions from refineries. These standards could significantly increase the costs of constructing or adding capacity to refineries and may ultimately increase the costs or decrease the supply of refined products. Either of these events could have an adverse effect on our business.
We are already managing and reporting GHG emissions, to varying degrees, as required by law for our sites in locations subject to Kyoto Protocol obligations and/or EU emissions trading scheme requirements. Although these sites are subject to existing GHG legislation, few have experienced or anticipate significant cost increases as a result of these programs, although it is possible that GHG
21
emission restrictions may increase over time. Potential consequences of such restrictions include capital costs to modify operations as necessary to meet GHG emission limits and/or additional energy costs, as well as direct compliance costs. Currently, however, it is not possible to estimate the likely financial impact of potential future regulation on any of our sites.
Finally, it should be noted that some scientists have concluded that increasing concentrations of GHGs in the Earth's atmosphere may produce climate changes that have significant physical effects, such as increased frequency and severity of storms, droughts, floods and other climatic events. If any of those effects were to occur, they could have an adverse effect on our facilities and operations.
Risks Related to Our Indebtedness and the Notes
Our significant debt level, a portion of which is subject to variable interest rates, makes us vulnerable to downturns and may limit our ability to respond to market conditions or to obtain additional financing.
We have significant outstanding debt. As of December 31, 2012, our total consolidated outstanding debt was approximately $4.4 billion (including a note payable to our parent); our debt to total capitalization ratio was approximately 78%; our combined outstanding variable rate borrowings were approximately $2.8 billion; and our current portion of debt totaled approximately $288 million. Our debt level, and the fact that a significant percentage of our cash flow is required to make payments on our debt, could have important consequences for our business, including but not limited to the following:
Our debt level also impacts our credit ratings. Any decision by credit rating agencies to downgrade our debt ratings could restrict our ability to obtain additional financing and could result in increased interest and other costs.
Despite our current levels of indebtedness, we may incur substantially more debt, which could further increase the risks associated with our substantial indebtedness.
Although the agreements governing our outstanding indebtedness contain and the indenture governing the notes contains restrictions on the incurrence of additional indebtedness by us and our restricted subsidiaries, these restrictions are subject to a number of qualifications and exceptions, and the indebtedness incurred in compliance with these restrictions could be substantial. As of December 31, 2012, we had approximately $4.4 billion of indebtedness (including a note payable to our parent). We may incur substantial additional indebtedness from time to time for a variety of purposes. Although a covenant in the indenture governing the notes restricts our ability to incur additional secured indebtedness, this covenant is subject to certain significant exceptions. See "Description of Notes—Certain Covenants—Limitation on Secured Debt" and "—Certain Definitions." Since the operating results of many of our businesses are cyclical, we could incur significant amounts of
22
additional indebtedness at the peak of the operating cycle. If new debt is added to the current debt levels, the related risks that we now face could intensify.
The indenture governing the notes and other agreements governing our debt may restrict our ability to engage in certain business activities or to obtain additional financing.
The agreements governing our debt arrangements and the indenture governing the notes contain certain restrictive covenants. These covenants may limit or prohibit our ability to incur more debt; make certain prepayments of debt; pay dividends, redeem stock or make other distributions; issue stock; make investments; create liens; enter into transactions with affiliates; enter into sale and leaseback transactions; merge or consolidate; and transfer or sell assets.
Our failure to comply with any of our debt covenants, or our failure to make payments of principal or interest on our debt, could result in a default, or trigger cross-default or acceleration provisions, under our debt agreements. An event of default could result in our debt obligations becoming immediately due and payable, cause our creditors to terminate their lending commitments, or force us or one or more of our subsidiaries into bankruptcy or liquidation. Any of the foregoing occurrences could have a material adverse effect on our business, results of operations and financial condition. For more information regarding our debt covenants, see "Note 14. Debt—Compliance with Covenants" to our audited consolidated financial statements.
The instruments governing our debt contain cross default provisions that may cause all of the debt issued under such instruments to become immediately due and payable as a result of a default under an unrelated debt instrument.
The indentures governing our outstanding senior notes and senior subordinated notes contain numerous covenants, and the agreements governing our Senior Credit Facilities and our A/R Programs contain numerous covenants and require us to meet certain financial ratios and tests. Our failure to comply with the obligations contained in the indentures governing our outstanding senior notes and senior subordinated notes, our Senior Credit Facilities and A/R Programs or other instruments governing our indebtedness could result in an event of default under the applicable instrument, which could result in the related debt and the debt issued under other instruments becoming immediately due and payable. In such event, we would need to raise funds from alternative sources, which funds may not be available to us on favorable terms, on a timely basis or at all. Alternatively, such a default could require us to sell our assets and otherwise curtail operations in order to pay our creditors.
The notes and the subsidiary guarantees are unsecured and effectively subordinated to our and the subsidiary guarantors' secured debt.
The notes are not secured. The borrowings under our Senior Credit Facilities are secured by liens on substantially all of our assets and the assets of the subsidiary guarantors. If we or any of our guarantors liquidates, dissolves or declares bankruptcy, or if payment under the credit agreement or any of our other secured debt is accelerated, our secured creditors would be entitled to exercise the remedies available to a secured creditor under applicable law and will have a claim on those assets that is effectively senior to the claims of holders of the notes. The guarantees of the notes are unsecured senior obligations of the guarantors, effectively subordinated to secured debt of the guarantors to the extent of the value of the assets securing such indebtedness, and in the event of the bankruptcy or insolvency of a guarantor, such guarantor's secured creditors will have a prior secured claim to any collateral securing the debt owed to them. As of December 31, 2012, we and the guarantors had approximately $1.6 billion of secured debt outstanding to which the notes and the guarantees are effectively subordinated. In addition, under the indenture governing the notes, we may incur additional secured debt.
23
The notes are structurally subordinated to all indebtedness of our subsidiaries that are not guarantors of the notes.
We derive substantially all of our revenue from our consolidated subsidiaries. While certain of our subsidiaries guarantee the notes, other subsidiaries are not guaranteeing the notes. You will not have any claim as a creditor against our other subsidiaries that are not guarantors of the notes. Accordingly, all obligations of our nonguarantor subsidiaries, including trade payables, will have to be satisfied before any of the assets of such subsidiaries would be available for distribution, upon a liquidation or otherwise, to us or a guarantor of the notes. As of December 31, 2012, our nonguarantor subsidiaries had approximately $661 million of total indebtedness, excluding intercompany subsidiary indebtedness. Under the indenture, if we meet a specified fixed charge coverage ratio, our nonguarantor subsidiaries may incur additional indebtedness, which would be structurally senior to the notes. See "Note 28. Condensed Consolidating Financial Information" to our audited consolidated financial statements for certain financial information about our nonguarantor subsidiaries.
We may not have the ability to repurchase notes upon a change of control as required by the indenture.
Upon the occurrence of certain change of control events (which, as defined in our indentures, generally exclude transactions approved by our board of managers), each holder of notes may require us to repurchase all or a portion of its notes at a purchase price equal to 101% of their principal amount plus accrued interest to the date of purchase. Our ability to repurchase the notes upon a change of control is restricted by the terms of our Senior Credit Facilities. As such, prior to repurchasing the notes upon a change of control, we would have to either repay outstanding indebtedness under our Senior Credit Facilities or obtain the consent of lenders thereunder. If we do not obtain the required consents or repay our outstanding indebtedness under our Senior Credit Facilities, we would remain effectively prohibited from offering to purchase the notes. In any event, we cannot assure you that we will have sufficient funds to repurchase the notes upon a change of control. Our failure to repurchase the notes upon a change of control would result in a default under the indenture governing the notes, which would, in turn, result in a default under our Senior Credit Facilities and our outstanding senior notes and senior subordinated notes.
The notes and guarantees may be void, avoided or subordinated under laws governing fraudulent transfers and insolvency.
We have incurred substantial debt, including our outstanding senior notes and senior subordinated notes and our Senior Credit Facilities. Various fraudulent conveyance laws enacted for the protection of creditors may apply to our issuance of the notes and the guarantors' issuance of the guarantees. To the extent that a court were to find that:
and that we or a guarantor
24
then the court could void the notes and the guarantees or subordinate the notes or the guarantees in favor of our or the guarantor's other creditors. Furthermore, to the extent that the notes or a guarantee were voided as a fraudulent conveyance or held unenforceable for any other reason:
You may find it difficult to sell your notes because no public trading market for the notes exists.
The notes constitute a new class of securities for which there is no established trading market. We cannot assure you that an active trading market will develop for the notes. If no active trading market develops, you may not be able to resell your notes at their fair market value or at all. Future trading prices of the notes will depend on many factors, including, among other things, prevailing interest rates, our operating results and the market for similar securities.
Historically, the market for non-investment grade debt has been subject to disruptions that have caused substantial volatility in prices. The market for the notes, if any, may be subject to similar disruptions. A disruption may have a negative effect on you as a holder of the notes, regardless of our prospects or performance.
We may purchase a portion of our debt securities, which could impact the market for our debt securities and likely would negatively affect our liquidity.
During 2012, we redeemed certain of our debt securities. We may from time to time seek to repurchase or redeem more of our debt securities in open market purchases, privately negotiated transactions, tender offers, partial or full call for redemption or otherwise. Any such repurchases or redemptions and the timing and amount thereof would depend on prevailing market conditions, liquidity requirements, contractual restrictions and other factors. Such transactions could negatively affect our liquidity.
25
DISCLOSURE REGARDING FORWARD-LOOKING STATEMENTS
All statements other than statements of historical facts included in this prospectus, including, without limitation, statements regarding our plans, objectives, goals, strategies, future events, future revenues or performance, capital expenditures, financing needs, plans or intentions relating to acquisitions or dispositions and other information that is not historical information, are forward-looking statements. In some cases, forward-looking statements can be identified by terminology such as "believes," "expects," "may," "will," "should," "anticipates" or "intends" or the negative of such terms or other comparable terminology or by discussions of strategy. We may also make additional forward-looking statements from time to time. All such subsequent forward-looking statements, whether written or oral, by us or on our behalf, are also expressly qualified by these cautionary statements.
All forward-looking statements, including without limitation, management's examination of historical operating trends, are based upon our current expectations and various assumptions. Our expectations, beliefs and projections are expressed in good faith and we believe there is a reasonable basis for them, but there can be no assurance that management's expectations, beliefs and projections will occur or be achieved. Accordingly, investors should not place undue reliance on our forward-looking statements. All forward-looking statements apply only as of the date made. We do not assume any obligation to update any forward-looking statements as a result of new information or future events or developments, except as required by law.
There are a number of risks and uncertainties that could cause our actual results to differ materially from the forward-looking statements contained in or contemplated by this prospectus. Any forward-looking statements should be considered in light of the risks set forth under the heading "Risk Factors" and elsewhere in this prospectus.
This prospectus includes information with respect to market share, market position, industry conditions and forecasts that we obtained from internal industry research, publicly available information (including industry publications and surveys), and surveys and market research provided by consultants. The publicly available information and the reports, forecasts and other research provided by consultants generally state that the information contained therein has been obtained from sources believed to be reliable. We have not independently verified any of the data from third party sources, nor have we ascertained the underlying economic assumptions relied upon therein. Similarly, our internal research and forecasts are based upon our management's understanding of industry conditions, and such information has not been verified by any independent sources.
26
Purpose of the Exchange Offer
When we sold the old notes in March of 2013, we conveyed the rights contained in an exchange and registration rights agreement with the initial purchasers of those notes. Under the exchange and registration rights agreement, we agreed to file the registration statement of which this prospectus forms a part regarding the exchange of the old notes for new notes which are registered under the Securities Act. We also agreed to use our reasonable best efforts to cause the registration statement to become effective with the SEC no later than November 29, 2013, and to commence and complete this exchange offer within 45 days after the date the registration statement was declared effective. We will use our best efforts to keep the registration statement effective until the exchange offer is completed. The exchange and registration rights agreement provides that we will be required to pay liquidated damages to the holders of the old notes if the exchange offer has not been completed within 45 business days after the effective date of the registration statement. A copy of the exchange and registration rights agreement is filed as an exhibit to the registration statement of which this prospectus is a part.
Terms of the Exchange Offer
This prospectus and the accompanying letter of transmittal together constitute the exchange offer. Upon the terms and subject to the conditions set forth in this prospectus and in the letter of transmittal, we will accept for exchange old notes that are properly tendered on or before the expiration date and are not withdrawn as permitted below. The expiration date for this exchange offer is 5:00 p.m., New York City time, on May 6, 2013, or such later date and time to which we, in our sole discretion, extend the exchange offer. The exchange offer, however, will be in effect no longer than 45 days from the effective date of the registration statement of which this prospectus is a part.
The form and terms of the new notes being issued in the exchange offer are the same as the form and terms of the old notes, except that:
Old notes tendered in the exchange offer must be in denominations of the principal amount of $2,000 and integral multiples of $1,000 in excess thereof.
We expressly reserve the right, in our sole discretion:
We will give notice of any extension, delay, non-acceptance, termination or amendment as promptly as practicable in writing or by a public announcement, and in the case of an extension, no later than 9:00 a.m., New York City time, on the next business day after the previously scheduled expiration date. Any notice relating to the extension of the exchange offer will disclose the number of securities tendered as of the date of the notice, as required by Rule 14e-1(d) under the Exchange Act.
27
During an extension, all old notes previously tendered will remain subject to the exchange offer and may be accepted for exchange by us. Any old notes not accepted for exchange for any reason will be returned without cost to the holder that tendered them promptly after the expiration or termination of the exchange offer.
If we delay accepting any old notes or terminate the exchange offer, we will promptly pay the consideration offered, or return any old notes deposited, pursuant to the exchange offer as required by Rule 14e-1(c).
How to Tender Old Notes for Exchange
We have forwarded to you, along with this prospectus, a letter of transmittal relating to this exchange offer. Because all of the old notes are held in book-entry accounts maintained by the relevant exchange agent at DTC, a holder need not submit a letter of transmittal if the holder tenders old notes in accordance with the procedures mandated by DTC's Automated Tender Offer Program, or ATOP. To tender old notes without submitting a letter of transmittal, the electronic instructions sent to DTC and transmitted to the exchange agent must contain your acknowledgment of receipt of, and your agreement to be bound by and to make all of the representations contained in, the letter of transmittal. In all other cases, a letter of transmittal must be manually executed and delivered as described in this prospectus. Wells Fargo Bank, National Association has been appointed as the exchange agent with responsibility for the tender and exchange of all old notes for new notes.
Only a holder of record of old notes may tender old notes in the exchange offer. To tender in the exchange offer, a holder must comply with the procedures of DTC, and either:
In addition, the exchange agent must receive, before expiration of the exchange offer, certificates for old notes to which such letter of transmittal relates or timely confirmation of book-entry transfer of old notes into the exchange agent's account at DTC, according to the procedure for book-entry transfer described below.
With respect to any old notes, letters of transmittal or other documents that must be physically delivered to the exchange agent, such documents must be received by the exchange agent at the exchange agent's address set forth below under the caption "—The Exchange Agent" before expiration of the exchange offer. To receive confirmation of valid tender of old notes, a holder should contact the exchange agent at the telephone number listed under the caption "—The Exchange Agent." If old notes, the letter of transmittal or any other required documents are physically delivered to the exchange agent, the method of delivery is at the holder's election and risk. Rather than mail these items, we recommend that holders use an overnight or hand delivery service. In all cases, holders should allow sufficient time to assure delivery to the exchange agent before expiration of the exchange offer. Holders should not send the letter of transmittal or old notes to us. Holders may request their respective brokers, dealers, commercial banks, trust companies or other nominees to effect the above transactions for them.
28
The tender by a holder that is not withdrawn before expiration of the exchange offer will constitute an agreement between that holder and us in accordance with the terms and subject to the conditions set forth in this prospectus and in the letter of transmittal. Only a registered holder of old notes may tender the old notes in the exchange offer. If a holder completing a letter of transmittal tenders less than all of the old notes held by such holder, such tendering holder should fill in the applicable box of the letter of transmittal. The amount of old notes delivered to the exchange agent will be deemed to have been tendered, unless otherwise indicated.
Any beneficial owner whose old notes are registered in the name of a broker, dealer, commercial bank, trust company or other nominee and who wishes to tender should contact the registered holder promptly and instruct it to tender on the owner's behalf. If the beneficial owner wishes to tender on its own behalf, it must, prior to completing and executing the letter of transmittal and delivering its old notes, either:
The transfer of registered ownership may take considerable time and may not be completed prior to the expiration date.
If the letter of transmittal is signed by the record holder(s) of the old notes tendered, the signature must correspond with the name(s) written on the face of the old note without alteration, enlargement or any change whatsoever. If the letter of transmittal is signed by a participant in DTC, the signature must correspond with the name as it appears on the security position listing as the holder of the old notes.
Signatures on a letter of transmittal or a notice of withdrawal, as the case may be, must be guaranteed unless the old notes surrendered for exchange are tendered:
An "eligible institution" is a financial institution, including most banks, savings and loan associations and brokerage houses, that is a participant in the Securities Transfer Agents Medallion Program, the New York Stock Exchange Medallion Signature Program or the Stock Exchanges Medallion Program.
If signatures on a letter of transmittal or notice of withdrawal are required to be guaranteed, the guarantor must be an eligible institution. If old notes are registered in the name of a person other than the signer of the letter of transmittal, the old notes surrendered for exchange must be endorsed by the registered holder, or accompanied by a written instrument or instruments of transfer or exchange, in satisfactory form as determined by us in our sole discretion, duly executed by the registered holder, in either case, with the holder's signature guaranteed by an eligible institution.
If trustees, executors, administrators, guardians, attorneys-in-fact, officers of corporations or others acting in a fiduciary or representative capacity sign the letter of transmittal or any old notes or any power of attorney, such persons should so indicate when signing, and you must submit proper evidence satisfactory to us of such person's authority to so act unless we waive this requirement.
We will determine all questions as to the validity, form, eligibility (including time of receipt) and acceptance of old notes tendered for exchange in our sole discretion. Our determination will be final and binding. We reserve the absolute right to:
29
Our interpretation of the terms and conditions of tender as to any particular old note either before or after the expiration date, including the letter of transmittal and the instructions to it, will be final and binding on all parties. Holders must cure any defects and irregularities in connection with tenders of old notes for exchange within such reasonable period of time as we will determine, unless we waive such defects or irregularities. Neither we, the exchange agent nor any other person shall be under any duty to give notification of any defect or irregularity with respect to any tender of old notes for exchange, nor shall any of us incur any liability for failure to give such notification.
By tendering, each holder will represent to us, among other things, that (i) any new notes to be received by such holder will be acquired in the ordinary course of its business, (ii) at the time of the commencement of the exchange offer, such holder has no arrangement or understanding with any person to participate in the distribution of the new notes issued in this exchange offer and (iii) such holder is not an "affiliate," as defined under Rule 405 of the Securities Act, of our Company. A holder that uses the exchange offer to participate in a distribution of the new notes:
Each holder will be required to represent to us in a letter of transmittal that it is not engaged in, and does not intend to engage in, the distribution of the new notes. In addition, each broker-dealer who acquired its old notes as a result of market-making activities or other trading activities and thereafter receives new notes issued for its own account in this exchange offer may be an "underwriter" within the meaning of the Securities Act and must represent to us in a letter of transmittal that it will deliver a prospectus meeting the requirements of the Securities Act in connection with any resale of such new notes issued in this exchange offer, and a broker-dealer that is not able to make this representation will not be permitted to participate in the exchange offer. The letter of transmittals states that by so acknowledging and by delivering a prospectus, a broker-dealer will not be deemed to admit that it is an "underwriter" within the meaning of the Securities Act. See "Plan of Distribution" for a discussion of the exchange and resale obligations of broker-dealers in connection with this exchange offer.
Acceptance of Old Notes for Exchange; Delivery of New Notes
Upon satisfaction or waiver of all of the conditions to this exchange offer, we will accept, promptly after the expiration date, all old notes properly tendered and will issue the new notes registered under the Securities Act. For purposes of this exchange offer, we shall be deemed to have accepted properly tendered old notes for exchange when, as and if we have given oral or written notice to the exchange agent, with written confirmation of any oral notice to be given promptly thereafter. See "—Conditions to the Exchange Offer" for a discussion of the conditions that must be satisfied before we accept any old notes for exchange.
For each old note accepted for exchange, the holder will receive a new note registered under the Securities Act having a principal amount equal to, and in the denomination of, that of the surrendered old note. Accordingly, registered holders of new notes on the relevant record date for the first interest
30
payment date following the consummation of this exchange offer will receive interest accruing from the most recent date to which interest has been paid or, if no interest has been paid on the old notes, from the respective dates such old notes were originally issued. Old notes that we accept for exchange will cease to accrue interest from and after the date of consummation of this exchange offer. Under the exchange and registration rights agreement, we may be required to make additional payments in the form of liquidated damages to the holders of the old notes under circumstances relating to the timing of this exchange offer.
In all cases, we will issue new notes in this exchange offer for old notes that are accepted for exchange only after the exchange agent timely receives:
If for any reason set forth in the terms and conditions of this exchange offer we do not accept any tendered old notes, or if a holder submits old notes for a greater principal amount than the holder desires to exchange, we will return such unaccepted or non-exchanged notes without cost to the tendering holder. In the case of old notes tendered by book-entry transfer into the exchange agent's account at DTC, such non-exchanged old notes will be credited to an account maintained with DTC promptly after the expiration or termination of this exchange offer.
DTC Book Entry Transfers
The exchange agent will make a request to establish an account at DTC with respect to old notes for purposes of this exchange offer promptly upon receipt of this prospectus. Any financial institution that is a participant in DTC's systems must make book-entry delivery of old notes by causing DTC to transfer those old notes into the exchange agent's account at DTC in accordance with DTC's electronic ATOP procedures for such transfer. Such participant should transmit its acceptance to DTC on or prior to the expiration date or comply with the guaranteed delivery procedures described below. DTC will verify such acceptance, execute a book-entry transfer of the tendered old notes into the exchange agent's account at DTC and then send to the exchange agent confirmation of such book-entry transfer. The confirmation of such book-entry transfer will include an agent's message confirming that DTC has received an express acknowledgment from such participant that such participant has received and agrees to be bound by the letter of transmittal and that we may enforce the letter of transmittal against such participant. Delivery of new notes may be effected through book-entry transfer at DTC. However, the letter of transmittal or facsimile thereof, with any required signature guarantees, or an agent's message, and any other required documents, must be transmitted to and received by the exchange agent at the address set forth below under "—The Exchange Agent" on or prior to the expiration date or comply with the guaranteed delivery procedures described below.
A holder who holds old notes through Euroclear or Clearstream must comply with the procedures of Euroclear or Clearstream, as applicable, when tendering its old notes.
Guaranteed Delivery Procedures
If a registered holder of old notes desires to tender the old notes, and the old notes are not immediately available, or time will not permit the holder's old notes or other required documents to
31
reach the exchange agent before the expiration date, or the procedure for book-entry transfer described above cannot be completed on a timely basis, a tender may nonetheless be made if:
Withdrawal Rights
You may withdraw tenders of your old notes at any time prior to 5:00 p.m., New York City time, on the expiration date.
For a withdrawal to be effective, you must send a written notice of withdrawal to the exchange agent at the exchange agent's address set forth below under "—The Exchange Agent." Any such notice of withdrawal must:
If certificates for old notes have been delivered or otherwise identified to the exchange agent, then, prior to the release of such certificates the withdrawing holder must also submit the serial numbers of the particular certificates to be withdrawn and signed notice of withdrawal with signatures guaranteed by an eligible institution unless such holder is an eligible institution. If old notes have been tendered pursuant to the procedure for book-entry transfer described above, any notice of withdrawal must specify the name and number of the account at DTC to be credited with the withdrawn old notes and otherwise comply with the procedures of such facility. We will determine all questions as to the validity, form and eligibility (including time of receipt) of such notices and our determination will be final and binding on all parties. Any tendered old notes so withdrawn will be deemed not to have been validly tendered for exchange for purposes of this exchange offer. Any old notes tendered for exchange that are not exchanged for any reason will be returned to the holder without cost to such holder. In the case of old notes tendered by book-entry transfer into the exchange agent's account at DTC, such old notes will be credited to an account maintained with DTC for the old notes as soon as practicable after withdrawal, rejection of tender or termination of this exchange offer. Properly withdrawn old notes may
32
be re-tendered by following one of the procedures described under "—How to Tender Old Notes for Exchange" above at any time on or prior to 5:00 p.m., New York City time, on the expiration date.
Conditions to the Exchange Offer
Notwithstanding any other provision of this exchange offer, we will not be required to accept for exchange, or to issue new notes in this exchange offer for any old notes, and we may terminate or amend this exchange offer, if at any time before the expiration of this exchange offer:
The non-occurrence of each of the preceding events is a condition to this exchange offer. We expressly reserve the right to amend or terminate this exchange offer upon the occurrence of any of these events. The conditions are for our sole benefit and we may assert them regardless of the circumstances giving rise to them. We may waive the preceding conditions in whole or in part at any time and from time to time in our sole discretion prior to the expiration of this exchange offer. If we do so, this exchange offer will remain open for at least three (3) business days following any waiver of the preceding conditions and, if we determine that any waiver constitutes a material change to the terms of this exchange offer, this exchange offer will remain open for at least five (5) business days following any such waiver. If we waive any condition as to any particular old note, such waiver will apply to all old notes tendered in the exchange offer. Our failure at any time to exercise the foregoing rights shall not be deemed a waiver of any such right and each such right shall be deemed an ongoing right which we may assert at any time and from time to time, except that all conditions to this exchange offer must be satisfied or waived by us prior to the expiration of this exchange offer. We will give notice in writing or by public announcement of any waiver by us of any condition and any related amendment, termination or extension of this exchange offer. In the case of any extension, such notice in writing or by public announcement will disclose the number of securities tendered as of the date of the notice, as required by Rule 14e-1(d) of the Exchange Act, and will be issued no later than 9:00 a.m., New York City time, on the business day after the previously scheduled expiration date.
33
The Exchange Agent
As explained above, Wells Fargo Bank, National Association has been appointed as our exchange agent. All executed letters of transmittal should be directed to our exchange agent at the address set forth below. You should direct questions and requests for assistance, requests for additional copies of this prospectus or of the letter of transmittal and requests for notices of guaranteed delivery to the exchange agent addressed as follows:
By registered mail or certified mail:
Wells Fargo Bank, National Association
Corporate Trust Operations
MAC N9303-121
P.O. Box 1517
Minneapolis, MN 55480-1517
By regular mail or overnight courier:
Wells Fargo Bank, National Association
Corporate Trust Operations
MAC N9303-121
Sixth Street & Marquette Avenue
Minneapolis, MN 55479
By hand delivery before 4:30 p.m.:
Wells Fargo Bank, National Association
Northstar East Building
608 Second Avenue South
12th Floor—Corporate Trust Services
Minneapolis, MN 55402
For information, call:
(800) 344-5128
By facsimile transmission:
(for eligible institutions only)
(612) 667-6282
Attn: Bondholder Communications
Confirm by Email:
bondholdercommunications@wellsfargo.com
Confirm by telephone:
(800) 344-5128
Attn: Bondholder Communications
Delivery of the letter of transmittal to an address other than as set forth above, or transmission of such letter of transmittal via facsimile other than as set forth above, does not constitute a valid delivery of such letter of transmittal.
34
Fees and Expenses
We will bear the expenses of soliciting tenders. We have not retained any dealer or manager in connection with the exchange offer and will not make any payment to brokers, dealers or others soliciting acceptances of the exchange offer. We will however, pay the exchange agent reasonable and customary fees for its services and will reimburse it for its reasonable out-of-pocket expenses.
We will pay the cash expenses incurred in connection with the exchange offer. These expenses include registration fees, fees and expenses of the exchange agent and the trustee, accounting and legal fees and printing costs, among others.
Accounting Treatment
We will not recognize any gain or loss for accounting purposes upon the consummation of this exchange offer. We will amortize the expense of this exchange offer over the term of the new notes in accordance with GAAP.
Transfer Taxes
You will not be obligated to pay any transfer taxes in connection with the tender of your old notes in this exchange offer. If, however, new notes are to be delivered to, or are to be issued in the name of, any person other than the holder of the old notes tendered, or if a transfer tax is imposed for any reason other than the exchange of old notes in connection with this exchange offer, then you must pay any such transfer taxes, whether imposed on the registered holder or on any other person. If satisfactory evidence of payment of, or exemption from, such taxes is not submitted with the letter of transmittal, the amount of such transfer taxes will be billed directly to you.
Consequences of Failing to Exchange Old Notes
Holders who desire to tender their old notes in exchange for new notes registered under the Securities Act should allow sufficient time to ensure timely delivery. Neither the exchange agent nor our Company is under any duty to give notification of defects or irregularities with respect to the tenders of old notes for exchange.
Old notes that are not tendered or are tendered but not accepted will, following the consummation of this exchange offer, continue to be subject to the provisions in the indenture regarding the transfer and exchange of the old notes and the existing restrictions on transfer set forth in the legend on the old notes and in the offering memorandum dated February 28, 2013 relating to the old notes. Except in limited circumstances with respect to specific types of holders of old notes, we will have no further obligation to provide for the registration under the Securities Act of such old notes. In general, old notes, unless registered under the Securities Act, may not be offered or sold except pursuant to an exemption from, or in a transaction not subject to, the Securities Act and applicable state securities laws. We do not currently anticipate that we will take any action to register the untendered old notes under the Securities Act or under any state securities laws.
Upon completion of this exchange offer, holders of the old notes will not be entitled to any further registration rights under the exchange and registration rights agreement, except under limited circumstances.
Holders of the new notes and any old notes which remain outstanding after consummation of this exchange offer will vote together as a single class for purposes of determining whether holders of the requisite percentage of the class have taken certain actions or exercised certain rights under the indenture.
35
Consequences of Exchanging Old Notes
Based on interpretations of the staff of the SEC, as set forth in no-action letters to third parties, we believe that the new notes may be offered for resale, resold or otherwise transferred by holders of such notes, other than by any holder which is an "affiliate" of our Company within the meaning of Rule 405 under the Securities Act. The new notes may be offered for resale, resold or otherwise transferred without compliance with the registration and prospectus delivery provisions of the Securities Act, if:
However, the SEC has not considered this exchange offer in the context of a no-action letter and we cannot guarantee that the staff of the SEC would make a similar determination with respect to this exchange offer as in such other circumstances.
As a condition to participation in the exchange offer, each holder must furnish a written representation that:
Each holder will be required to represent to us in a letter of transmittal that it is not engaged in, and does not intend to engage in, the distribution of the new notes. In addition, each broker-dealer that receives new notes in this exchange offer for its own account in exchange for old notes that it acquired as a result of market-making or other trading activities may be an "underwriter" within the meaning of the Securities Act and must represent to us in a letter of transmittal that it will deliver a prospectus meeting the requirements of the Securities Act in connection with any resale of the new notes. The letter of transmittal states that by so acknowledging and by delivering a prospectus, a broker-dealer will not be deemed to admit that it is an "underwriter" within the meaning of the Securities Act. See "Plan of Distribution" for a discussion of the exchange and resale obligations of broker-dealers in connection with this exchange offer.
In addition, to comply with state securities laws of certain jurisdictions, the new notes may not be offered or sold in any state unless they have been registered or qualified for sale in such state or an exemption from registration or qualification is available and complied with by the holders selling the new notes.
Any holder using the exchange offer to participate in a distribution of the new notes (i) may not rely on applicable interpretations of the staff of the SEC and (ii) must comply with the registration and prospectus delivery requirements of the Securities Act in connection with any resale transaction.
36
We will not receive any proceeds from the issuance of the new notes. The new notes will be exchanged for old notes in like principal amount, and the exchanged old notes will be canceled. As a result, the issuance of new notes in exchange for old notes as contemplated in this prospectus will not result in any change in our indebtedness.
We used the proceeds from the offering of the old notes and available cash to redeem $200 million in aggregate principal amount of our 5.5% Senior Notes due 2016 and to pay associated accrued interest and for general corporate purposes.
RATIO OF EARNINGS TO FIXED CHARGES
The following table shows our consolidated ratio of earnings to fixed charges for the periods indicated (dollars in millions):
| |
Year Ended December 31, | |||||||||||||||
|---|---|---|---|---|---|---|---|---|---|---|---|---|---|---|---|---|
| |
2012 | 2011 | 2010 | 2009 | 2008 | |||||||||||
Fixed Charges: |
||||||||||||||||
Interest expensed and capitalized (includes amortization of deferred financing costs) |
$ | 242 | $ | 264 | $ | 249 | $ | 243 | $ | 279 | ||||||
Interest portion of rent expense |
30 | 30 | 28 | 27 | 30 | |||||||||||
Total fixed charges |
$ | 272 | $ | 294 | $ | 277 | $ | 270 | $ | 309 | ||||||
Earnings: |
||||||||||||||||
Pretax income (loss) from continuing operations less equity income |
$ | 552 | $ | 362 | $ | 160 | $ | (243 | ) | $ | (75 | ) | ||||
Fixed charges |
272 | 294 | 277 | 270 | 309 | |||||||||||
Amortization of capitalized interest |
3 | 3 | 3 | 3 | 2 | |||||||||||
Less: |
||||||||||||||||
Interest capitalized |
(4 | ) | (2 | ) | (1 | ) | (3 | ) | (17 | ) | ||||||
Total earnings plus fixed charges |
$ | 823 | $ | 657 | $ | 439 | $ | 27 | $ | 219 | ||||||
Ratio of earnings to fixed charges |
3.0 | 2.2 | 1.6 | — | — | |||||||||||
Deficiency of earnings to fixed charges |
$ | — | $ | — | $ | — | $ | 243 | $ | 90 | ||||||
37
The following table sets forth our cash and capitalization as of December 31, 2012, as adjusted to give effect to the issuance of the old notes and the use of a portion of the net proceeds therefrom and available cash to redeem $200 million outstanding principal amount of our 5.5% Senior Notes due 2016 as described in "Use of Proceeds," excluding the payment of accrued interest in connection therewith.
The information set forth below should be read in conjunction with our audited consolidated financial statements, "Management's Discussion and Analysis of Financial Condition and Results of Operations" and "Selected Historical Financial Data" included in this prospectus and, in each case, any related notes thereto. We will not receive any cash proceeds from the issuance of the new notes. In consideration for issuing the new notes as contemplated in this prospectus, we will receive in exchange old notes in like principal amount, which will be cancelled and as such will not result in any increase in our capitalization.
| |
Pro Forma as of December 31, 2012 |
|||
|---|---|---|---|---|
| |
(in millions) |
|||
Cash, cash equivalents and restricted cash |
$ | 262 | ||
Long-term debt (including current portion)(a): |
||||
Senior credit facilities: |
||||
Term loans(a) |
$ | 1,565 | ||
Amounts outstanding under A/R Programs |
241 | |||
Senior notes, net of discount |
646 | |||
Senior subordinated notes(b) |
892 | |||
Variable Interest Entities |
270 | |||
Other |
166 | |||
Total debt—excluding debt to affiliates |
$ | 3,780 | ||
Notes payable to affiliates(c) |
699 | |||
Total debt |
$ | 4,479 | ||
Members' equity(d) |
$ | 1,182 | ||
Total capitalization |
$ | 5,661 | ||
38
SELECTED FINANCIAL AND OPERATING DATA
The selected historical financial data set forth below presents our historical financial data as of and for the dates and periods indicated. The selected financial data as of December 31, 2012 and 2011 and for the years ended December 31, 2012, 2011 and 2010 has been derived from the audited consolidated financial statements included in this prospectus. The selected financial data as of December 31, 2010, 2009 and 2008 and for the years ended December 31, 2009 and 2008 has been derived from our audited consolidated financial statements not included in this prospectus. You should read the selected financial data in conjunction with "Management's Discussion and Analysis of Financial Condition and Results of Operations," and our audited consolidated financial statements and accompanying notes.
| |
Year Ended December 31, | |||||||||||||||
|---|---|---|---|---|---|---|---|---|---|---|---|---|---|---|---|---|
| (in millions) |
2012 | 2011 | 2010 | 2009 | 2008 | |||||||||||
Statements of Operations Data: |
||||||||||||||||
Revenues |
$ | 11,187 | $ | 11,221 | $ | 9,250 | $ | 7,665 | $ | 10,056 | ||||||
Gross profit |
2,041 | 1,858 | 1,478 | 1,095 | 1,297 | |||||||||||
Restructuring, impairment and plant closing costs |
92 | 167 | 29 | 88 | 31 | |||||||||||
Operating income |
869 | 629 | 443 | 41 | 215 | |||||||||||
Income (loss) from continuing operations |
380 | 257 | 144 | (399 | ) | (59 | ) | |||||||||
(Loss) income from discontinued operations, net of tax(a) |
(7 | ) | (1 | ) | 42 | (19 | ) | 84 | ||||||||
Extraordinary gain (loss) on the acquisition of a business, net of tax of nil(b) |
2 | 4 | (1 | ) | 6 | 14 | ||||||||||
Net income (loss) |
375 | 260 | 185 | (412 | ) | 39 | ||||||||||
Net income (loss) attributable to Huntsman International LLC |
365 | 253 | 180 | (410 | ) | 38 | ||||||||||
Other Data: |
||||||||||||||||
Depreciation and amortization |
$ | 408 | $ | 416 | $ | 382 | $ | 420 | $ | 374 | ||||||
Capital expenditures |
412 | 330 | 236 | 189 | 418 | |||||||||||
Balance Sheet Data (at period end): |
||||||||||||||||
Total assets |
$ | 8,870 | $ | 8,330 | $ | 8,307 | $ | 7,693 | $ | 7,424 | ||||||
Total debt |
4,401 | 4,481 | 4,685 | 4,531 | 4,076 | |||||||||||
Total liabilities |
7,653 | 7,239 | 7,219 | 6,846 | 6,505 | |||||||||||
39
MANAGEMENT'S DISCUSSION AND ANALYSIS OF FINANCIAL CONDITION AND
RESULTS OF OPERATIONS
The following discussion should be read in conjunction with the historical financial statements and other financial information appearing elsewhere in this prospectus, including "Prospectus Summary—Summary Historical Financial Data," "Capitalization" and "Selected Financial and Operating Data." The following discussion contains forward-looking statements that reflect our plans, estimates and beliefs. Our actual results could differ materially from those discussed in the forward-looking statements. Factors that could cause or contribute to these differences include those discussed below and elsewhere in this prospectus, particularly in "Risk Factors." All references to years relate to the calendar year ended December 31 of the particular year.
OVERVIEW
We are a global manufacturer of differentiated organic chemical products and of inorganic chemical products. Our products comprise a broad range of chemicals and formulations, which we market globally to a diversified group of consumer and industrial customers. Our products are used in a wide range of applications, including those in the adhesives, aerospace, automotive, construction products, personal care and hygiene, durable and non-durable consumer products, electronics, medical, packaging, paints and coatings, power generation, refining, synthetic fiber, textile chemicals and dye industries. We are a leading global producer in many of our key product lines, including MDI, amines, surfactants, epoxy-based polymer formulations, textile chemicals, dyes, maleic anhydride and titanium dioxide. Our administrative, research and development and manufacturing operations are primarily conducted at facilities located in 30 countries. We employed approximately 12,000 associates worldwide at December 31, 2012.
We operate in five segments: Polyurethanes, Performance Products, Advanced Materials, Textile Effects and Pigments. Our Polyurethanes, Performance Products, Advanced Materials and Textile Effects segments produce differentiated organic chemical products and our Pigments segment produces inorganic chemical products. In a series of transactions beginning in 2006, we have sold or shutdown substantially all of our former Australian styrenics operations and our North American polymers and base chemicals operations. We report the results from these businesses as discontinued operations. See "Note 25. Discontinued Operations" to our audited consolidated financial statements.
Growth in our Polyurethanes and Advanced Materials segments has been driven by the continued substitution of our products for other materials across a broad range of applications, as well as by the level of global economic activity. Historically, demand for many of these products has grown at rates in excess of GDP growth. In Polyurethanes, this growth, driven largely by Asia, has in recent years resulted in improved demand and higher industry capacity utilization rates for many of our key products, including MDI.
In our Performance Products segment, demand for our performance specialties has generally continued to grow at rates in excess of GDP as overall demand is significantly influenced by new product and application development. Demand for most of our performance intermediates has grown in line with GDP growth. Over time, demand for maleic anhydride has generally grown at rates that slightly exceed GDP growth. However, given its dependence on the UPR market, which is influenced by construction end markets, maleic anhydride demand can be cyclical.
Demand in our Textile Effects segment is driven primarily by consumer activity. Consumer spending for goods incorporating our Textile Effects products is impacted significantly by a wide range of economic factors, including personal incomes, housing and energy prices and other highly volatile factors. Accordingly, demand for our Textile Effects products has been volatile and appears likely to remain volatile.
40
Historically, demand for titanium dioxide pigments has grown at rates approximately equal to global GDP growth. Pigment prices have historically reflected industry-wide operating rates but have typically lagged behind movements in these rates by up to twelve months due to the effects of product stocking and destocking by customers and producers, contract arrangements and seasonality. The industry experiences some seasonality in its sales because sales of paints, the largest end use for titanium dioxide, generally peak during the spring and summer months in the northern hemisphere. This results in greater sales volumes in the second and third quarters of the year. During 2012, we benefited from certain ore supply contracts in our Pigments segment that effectively supplied approximately 50% of our ore requirements at prices close to 2011 market levels, which are significantly below current market prices. A majority of these contracts expired at the end of 2012, with the resulting benefits reflected through most of the first quarter of 2013.
For further information regarding sales price and demand trends, see "Results of Operations—Segment Analysis—Year Ended December 31, 2012 Compared to Year Ended December 31, 2011" and the tables captioned "Year ended December 31, 2012 vs. 2011, Period-Over-Period Increase (Decrease)" and "Fourth Quarter 2012 vs. Third Quarter 2012, Period-Over-Period Increase (Decrease)" below.
RECENT DEVELOPMENTS
For a discussion of recent developments, see "Business—Recent Developments" below.
OUTLOOK
We experienced strong growth in our Polyurethanes segment, particularly in our MDI business, and anticipate favorable market conditions in the future. While the factors we describe below are subject to general economic conditions, we expect our Pigments segment to continue going through a business cycle with improvements beginning in the second half of 2013. We anticipate that the future benefits from our ongoing restructuring and cost cutting efforts will result in a lower cost structure and more competitive business when complete in the middle of 2014.
The following summarizes trends and key considerations that could impact future performance of our operating segments:
Polyurethanes:
Performance Products:
Advanced Materials:
41
Textile Effects:
Pigments:
We expect to spend approximately $450 million in 2013 on capital expenditures, net of reimbursements, for growth initiatives and maintenance.
We expect our full year 2013 adjusted effective tax rate to be approximately 35% primarily due to the effect of the tax valuation allowances and expected regional mix of income. We believe our long-term effective income tax rate will be approximately 30% to 35%.
42
RESULTS OF OPERATIONS
The following table sets forth the consolidated results of operations for the years ended December 31, 2012, 2011 and 2010 (dollars in millions):
| |
|
|
|
Percent Change | ||||||||||||
|---|---|---|---|---|---|---|---|---|---|---|---|---|---|---|---|---|
| |
Year ended December 31, | |||||||||||||||
| |
2012 vs. 2011 | 2011 vs. 2010 | ||||||||||||||
| |
2012 | 2011 | 2010 | |||||||||||||
Revenues |
$ | 11,187 | $ | 11,221 | $ | 9,250 | — | 21 | % | |||||||
Cost of goods sold |
9,146 | 9,363 | 7,772 | (2 | )% | 20 | % | |||||||||
Gross profit |
2,041 | 1,858 | 1,478 | 10 | % | 26 | % | |||||||||
Operating expenses |
1,080 | 1,062 | 1,006 | 2 | % | 6 | % | |||||||||
Restructuring, impairment and plant closing costs |
92 | 167 | 29 | (45 | )% | 476 | % | |||||||||
Operating income |
869 | 629 | 443 | 38 | % | 42 | % | |||||||||
Interest expense, net |
(238 | ) | (262 | ) | (248 | ) | (9 | )% | 6 | % | ||||||
Equity in income of investment in unconsolidated affiliates |
7 | 8 | 24 | (13 | )% | (67 | )% | |||||||||
Loss on early extinguishment of debt |
(80 | ) | (7 | ) | (37 | ) | NM | (81 | )% | |||||||
Other income |
1 | 2 | 2 | (50 | )% | — | ||||||||||
Income from continuing operations before income taxes |
559 | 370 | 184 | 51 | % | 101 | % | |||||||||
Income tax expense |
(179 | ) | (113 | ) | (40 | ) | 58 | % | 183 | % | ||||||
Income from continuing operations |
380 | 257 | 144 | 48 | % | 78 | % | |||||||||
(Loss) income from discontinued operations, net of tax |
(7 | ) | (1 | ) | 42 | 600 | % | NM | ||||||||
Extraordinary gain (loss) on the acquisition of a business, net of tax of nil |
2 | 4 | (1 | ) | (50 | )% | NM | |||||||||
Net income |
375 | 260 | 185 | 44 | % | 41 | % | |||||||||
Net income attributable to noncontrolling interests |
(10 | ) | (7 | ) | (5 | ) | 43 | % | 40 | % | ||||||
Net income attributable to Huntsman International LLC |
365 | 253 | 180 | 44 | % | 41 | % | |||||||||
Interest expense, net |
238 | 262 | 248 | (9 | )% | 6 | % | |||||||||
Income tax expense from continuing operations |
179 | 113 | 40 | 58 | % | 183 | % | |||||||||
Income tax (benefit) expense from discontinued operations |
(3 | ) | (5 | ) | 10 | (40 | )% | NM | ||||||||
Depreciation and amortization |
408 | 416 | 382 | (2 | )% | 9 | % | |||||||||
EBITDA(1) |
$ | 1,187 | $ | 1,039 | $ | 860 | 14 | % | 21 | % | ||||||
Net cash provided by (used in) operating activities |
860 | 432 | (46 | ) | 99 | % | NM | |||||||||
Net cash used in investing activities |
(578 | ) | (337 | ) | (238 | ) | 72 | % | 42 | % | ||||||
Net cash used in financing activities |
(306 | ) | (418 | ) | (78 | ) | (27 | )% | 436 | % | ||||||
Other nonGAAP measures: |
||||||||||||||||
Adjusted EBITDA(1) |
$ | 1,396 | $ | 1,214 | $ | 885 | 15 | % | 37 | % | ||||||
Adjusted net income(2) |
$ | 544 | 414 | 212 | 31 | % | 95 | % | ||||||||
Capital expenditures, net of reimbursements(3) |
412 | 327 | 202 | 26 | % | 62 | % | |||||||||
NM—Not meaningful
43
Adjusted EBITDA is computed by eliminating the following from EBITDA: loss on early extinguishment of debt; certain legal settlements and related expenses; EBITDA from discontinued operations; acquisition expenses; gain on disposition of businesses/assets; extraordinary (gain) loss on the acquisition of a business; loss (gain) on initial consolidation of subsidiaries; and restructuring, impairment and plant closing and transition costs (credits).
Adjusted EBITDA is presented solely as a supplemental disclosure to EBITDA and reported GAAP measures because we believe that it is indicative of our operating performance and is
44
frequently used as a valuation measure of chemical companies. Our management also uses adjusted EBITDA to evaluate the core operating performance of our segments and business.
In addition to the limitations of EBITDA noted above, adjusted EBITDA excludes items that may be recurring in nature and should not be disregarded in the evaluation of performance. However, we believe it is useful to exclude such items to provide a supplemental analysis of current results and trends compared to other periods for the following reasons: certain excluded items can vary significantly depending on specific underlying transactions or events, and the variability of such items may not relate specifically to current operating results or trends; and certain excluded items, while potentially recurring in future periods, may not be indicative of future results.
Adjusted EBITDA should not be construed as an alternative to net income applicable to Huntsman International as an indicator of performance, or as any other measure determined in accordance with GAAP.
We believe that net income attributable to Huntsman International is the performance measure calculated and presented in accordance with GAAP that is most directly comparable to EBITDA and adjusted EBITDA.
The following table sets forth certain items of (income) expense included in EBITDA (in millions):
| |
Year ended December 31, |
|||||||||
|---|---|---|---|---|---|---|---|---|---|---|
| |
2012 | 2011 | 2010 | |||||||
Net income attributable to Huntsman International |
$ | 365 | $ | 253 | $ | 180 | ||||
Interest expense, net |
238 | 262 | 248 | |||||||
Income tax expense from continuing operations |
179 | 113 | 40 | |||||||
Income tax (benefit) expense from discontinued operations |
(3 | ) | (5 | ) | 10 | |||||
Depreciation and amortization |
408 | 416 | 382 | |||||||
EBITDA |
1,187 | 1,039 | 860 | |||||||
Loss on early extinguishment of debt |
80 | 7 | 37 | |||||||
Certain legal settlements and related expenses |
11 | 46 | 8 | |||||||
EBITDA from discontinued operations |
5 | 6 | (53 | ) | ||||||
Acquisition expenses |
5 | 5 | 3 | |||||||
Gain on disposition of businesses/assets |
(3 | ) | (40 | ) | — | |||||
Extraordinary (gain) loss on the acquisition of a business |
(2 | ) | (4 | ) | 1 | |||||
Loss (gain) on initial consolidation of subsidiaries |
4 | (12 | ) | — | ||||||
Restructuring, impairment and plant closing and transition costs (credits): |
||||||||||
Polyurethanes |
38 | — | — | |||||||
Performance Products |
— | — | 3 | |||||||
Advanced Materials |
38 | 20 | (2 | ) | ||||||
Textile Effects |
26 | 135 | 15 | |||||||
Pigments |
4 | 10 | 8 | |||||||
Corporate and other |
3 | 2 | 5 | |||||||
Total restructuring, impairment and plant closing and transition costs |
109 | 167 | 29 | |||||||
Adjusted EBITDA |
$ | 1,396 | $ | 1,214 | $ | 885 | ||||
45
financing;
(d) loss (income) from discontinued operations; (e) acquisition expenses; (f) gain on disposition of businesses/assets; (g) extraordinary (gain) loss on the
acquisition of a business; (h) loss (gain) on initial consolidation of subsidiaries; and (i) restructuring, impairment and plant closing and transition costs. The income tax impacts of
each adjusting item is calculated using the statutory rates in the applicable taxing jurisdiction and considering valuation allowances on deferred tax assets in each jurisdiction. We do not adjust for
changes in tax valuation allowances because we do not believe it provides more meaningful information than is provided under GAAP.
Adjusted
net income is presented solely as a supplemental disclosure to net income applicable to Huntsman International because we believe that this measure is indicative of our
operating performance. Adjusted net income excludes items that may be recurring in nature and should not be disregarded in the evaluation of performance. However, we believe it is useful to exclude
such items to provide a supplemental analysis of current results and trends compared to other periods for the following reasons: certain excluded items can vary significantly depending on specific
underlying transactions or events, and the variability of such items may not relate specifically to current operating results or trends; and certain excluded items, while potentially recurring in
future periods, may not be indicative of future results.
The following table sets forth certain items of (income) expense included in adjusted net income (in millions):
| |
Year ended December 31, | |||||||||
|---|---|---|---|---|---|---|---|---|---|---|
| |
2012 | 2011 | 2010 | |||||||
Net income attributable to Huntsman International |
$ | 365 | $ | 253 | $ | 180 | ||||
Loss on early extinguishment of debt, net of tax of $(29), $(3) and $(14) in 2012, 2011 and 2010, respectively |
51 | 4 | 23 | |||||||
Certain legal settlements and related expenses, net of tax of $(4), $(17) and $(3) in 2012, 2011 and 2010, respectively |
7 | 29 | 5 | |||||||
Discount amortization on settlement financing, net of tax of $(11), $(10) and $(10) in 2012, 2011 and 2010, respectively |
20 | 18 | 16 | |||||||
Loss (income) from discontinued operations, net of tax of (3), $(5) and $10 in 2012, 2011 and 2010, respectively |
7 | 1 | (42 | ) | ||||||
Acquisition expenses, net of tax of $(1) in 2012, 2011 and 2010, each |
4 | 4 | 2 | |||||||
Gain on disposition of businesses/assets, net of tax of nil, $3 and nil in 2012, 2011 and 2010, respectively |
(3 | ) | (37 | ) | — | |||||
Extraordinary (gain) loss on the acquisition of a business, net of tax of nil for 2012, 2011 and 2010, each |
(2 | ) | (4 | ) | 1 | |||||
Loss (gain) on initial consolidation of subsidiaries, net of tax of nil, $2 and nil in 2012, 2011 and 2010, respectively |
4 | (10 | ) | — | ||||||
Restructuring, impairment and plant closing and transition costs, net of tax of $(18), $(11) and $(2) in 2012, 2011 and 2010, respectively |
91 | 156 | 27 | |||||||
Adjusted net income |
$ | 544 | $ | 414 | $ | 212 | ||||
46
Year Ended December 31, 2012 Compared with Year Ended December 31, 2011
For the year ended December 31, 2012, net income attributable to Huntsman International was $365 million on revenues of $11,187 million, compared with net income attributable to Huntsman International of $253 million on revenues of $11,221 million for 2011. The increase of $112 million in net income attributable to Huntsman International was the result of the following items:
47
Segment Analysis
Year Ended December 31, 2012 Compared to Year Ended December 31, 2011
| |
Year ended December 31, |
|
||||||||
|---|---|---|---|---|---|---|---|---|---|---|
| |
Percent Change Favorable (Unfavorable) |
|||||||||
| |
2012 | 2011 | ||||||||
Revenues |
||||||||||
Polyurethanes |
$ | 4,894 | $ | 4,434 | 10 | % | ||||
Performance Products |
3,065 | 3,301 | (7 | )% | ||||||
Advanced Materials |
1,325 | 1,372 | (3 | )% | ||||||
Textile Effects |
752 | 737 | 2 | % | ||||||
Pigments |
1,436 | 1,642 | (13 | )% | ||||||
Eliminations |
(285 | ) | (265 | ) | (8 | )% | ||||
Total |
$ | 11,187 | $ | 11,221 | — | |||||
Segment EBITDA |
||||||||||
Polyurethanes |
$ | 726 | $ | 469 | 55 | % | ||||
Performance Products |
360 | 385 | (6 | )% | ||||||
Advanced Materials |
54 | 125 | (57 | )% | ||||||
Textile Effects |
(49 | ) | (199 | ) | 75 | % | ||||
Pigments |
352 | 501 | (30 | )% | ||||||
Corporate and other |
(251 | ) | (236 | ) | (6 | )% | ||||
Subtotal |
1,192 | 1,045 | 14 | % | ||||||
Discontinued Operations |
(5 | ) | (6 | ) | 17 | % | ||||
Total |
$ | 1,187 | $ | 1,039 | 14 | % | ||||
| |
Year ended December 31, 2012 vs. 2011 | ||||||||||||
|---|---|---|---|---|---|---|---|---|---|---|---|---|---|
| |
Average Selling Price(1) |
|
|
||||||||||
| |
Local Currency |
Foreign Currency Translation Impact |
Mix & Other |
Sales Volumes(1) |
|||||||||
Period-Over-Period Increase (Decrease) |
|||||||||||||
Polyurethanes |
4 | % | (2 | )% | — | 8 | % | ||||||
Performance Products |
(3 | )% | (3 | )% | 2 | % | (3 | )% | |||||
Advanced Materials |
(6 | )% | (4 | )% | — | 7 | % | ||||||
Textile Effects |
— | (4 | )% | (1 | )% | 7 | % | ||||||
Pigments |
14 | % | (5 | )% | — | (22 | )% | ||||||
Total Company |
2 | % | (3 | )% | 1 | % | — | ||||||
48
| |
Fourth Quarter 2012 vs. Third Quarter 2012 | ||||||||||||
|---|---|---|---|---|---|---|---|---|---|---|---|---|---|
| |
Average Selling Price(1) |
|
|
||||||||||
| |
Local Currency |
Foreign Currency Translation Impact |
Mix & Other |
Sales Volumes(1) |
|||||||||
Period-Over-Period Increase (Decrease) |
|||||||||||||
Polyurethanes |
(2 | )% | 1 | % | (2 | )% | (1 | )% | |||||
Performance Products |
2 | % | 1 | % | 1 | % | (8 | )% | |||||
Advanced Materials |
1 | % | 2 | % | 1 | % | (9 | )% | |||||
Textile Effects |
(3 | )% | 1 | % | 3 | % | 3 | % | |||||
Pigments |
(10 | )% | 1 | % | 1 | % | (2 | )% | |||||
Total Company |
(2 | )% | 1 | % | — | (3 | )% | ||||||
Polyurethanes
The increase in revenues in our Polyurethanes segment for 2012 compared to 2011 was due to higher sales volumes and higher average selling prices, partially offset by the strength of the U.S. dollar against the euro. MDI sales volumes increased as a result of improved demand in all regions and across most major markets. PO/MTBE sales volumes increased due to strong demand. MDI average selling prices increased in all regions, partially offset by the strength of the U.S. dollar against the euro. PO/MTBE average selling prices increased primarily due to favorable market conditions. The increase in segment EBITDA was primarily due to higher margins and higher sales volumes, partially offset by higher restructuring, impairment and plant closing costs. During 2012 and 2011, our Polyurethanes segment recorded restructuring, impairment and plant closing costs of $38 million and nil, respectively. For more information concerning restructuring activities, see "Note 11. Restructuring, Impairment and Plant Closing Costs" to our audited consolidated financial statements.
Performance Products
The decrease in revenues in our Performance Products segment for 2012 compared to 2011 was primarily due to lower average selling prices and lower sales volumes. Average selling prices decreased across almost all businesses primarily in response to lower raw material costs and the strength of the U.S. dollar against major international currencies. Sales volumes decreased primarily due to a shift to tolling arrangements. The decrease in segment EBITDA was primarily due to lower sales volumes and higher operating expenses. In addition, in 2011 we recorded a gain of $12 million in connection with the consolidation of our Sasol-Huntsman joint venture.
Advanced Materials
The decrease in revenues in our Advanced Materials segment for 2012 compared to 2011 was primarily due to lower average selling prices, partially offset by higher sales volumes. Average selling prices decreased in all regions and across most markets in response to competitive market pressure, lower raw material costs in most regions and the strength of the U.S. dollar against major international currencies. Sales volumes increased across most regions, primarily due to stronger global demand in our base resins business, while sales volumes in the Asia-Pacific region decreased due to lower demand in the wind energy, electrical engineering and electronics markets. The decrease in segment EBITDA was primarily due to higher restructuring and impairment costs and lower margins due in part to the change in sales mix from increased base resin sales volumes, partially offset by lower selling, general
49
and administrative costs as a result of recent restructuring efforts. During 2012 and 2011, our Advanced Materials segment recorded restructuring, impairment and plant closing costs of $38 million and $20 million, respectively. For more information concerning restructuring activities, see "Note 11. Restructuring, Impairment and Plant Closing Costs" to our audited consolidated financial statements.
Textile Effects
The increase in revenues in our Textile Effects segment for 2012 compared to 2011 was primarily due to higher sales volumes, partially offset by the strength of the U.S. dollar against major international currencies. Sales volumes increased due to increased market share in key markets. The increase in segment EBITDA was primarily due to lower restructuring, impairment and plant closing and transition costs and lower manufacturing and selling, general and administrative costs as a result of recent restructuring efforts, partially offset by lower margins. During 2012 and 2011, our Textile Effects segment recorded restructuring, impairment and plant closing costs of $9 million and $135 million, respectively, and expenses for the transition of production from Basel, Switzerland to a tolling facility of $17 million and nil, respectively. For more information concerning restructuring activities, see "Note 11. Restructuring, Impairment and Plant Closing Costs" to our audited consolidated financial statements.
Pigments
The decrease in revenues in our Pigments segment for 2012 compared to 2011 was due to lower sales volumes, partially offset by higher average selling prices. Sales volumes decreased primarily due to lower global demand. Average selling prices increased in all regions of the world primarily in response to higher raw material costs, partially offset by the strength of the U.S. dollar against major international currencies. The decrease in segment EBITDA was primarily due to lower margins and lower sales volumes. During 2012 and 2011, our Pigments segment recorded restructuring, impairment and plant closing costs of $4 million and $10 million, respectively. For more information concerning restructuring activities, see "Note 11. Restructuring, Impairment and Plant Closing Costs" to our audited consolidated financial statements.
Corporate and other
Corporate and other includes unallocated corporate overhead, unallocated foreign exchange gains and losses, last-in first-out ("LIFO") inventory valuation reserve adjustments, loss on early extinguishment of debt, unallocated restructuring, impairment and plant closing costs, nonoperating income and expense, benzene sales and gains and losses on the disposition of corporate assets. For 2012, EBITDA from Corporate and other decreased by $15 million to a loss of $251 million from a loss of $236 million for 2011. The decrease in EBITDA from Corporate and other was primarily the result of an increase in loss on early extinguishment of debt of $73 million ($80 million of loss in 2012 compared to $7 million of loss in 2011). For more information regarding the loss on early extinguishment of debt, see "Note 14. Debt—Redemption of Notes and Loss on Early Extinguishment of Debt" to our audited consolidated financial statements. The decrease was also due to higher incentive compensation costs of $19 million and a decrease in unallocated foreign exchange gains of $9 million ($2 million gain in 2012 compared to $11 million gain in 2011). The decrease in EBITDA was partially offset by a decrease in legal settlements of $39 million ($1 million in 2012 compared to $40 million in 2011), an increase in LIFO inventory valuation income of $35 million ($14 million of income in 2012 compared to $21 million of expense in 2011) and an increase of $15 million in income from benzene sales ($10 million of income in 2012 compared to $5 million of loss in 2011).
50
Discontinued Operations
The operating results of our former polymers, base chemicals and Australian styrenics businesses are classified as discontinued operations, and, accordingly, the revenues of these businesses are excluded from revenues for all periods presented. The EBITDA of these former businesses are included in discontinued operations for all periods presented. The loss from discontinued operations represents the operating results, legal costs, restructuring, impairment and plant closing costs and gain (loss) on disposal with respect to our former businesses. The decrease in loss from discontinued operations, net of tax, resulted primarily from higher legal costs in 2011. See "Note 25. Discontinued Operations" to our audited consolidated financial statements.
Year Ended December 31, 2011 Compared with Year Ended December 31, 2010
For the year ended December 31, 2011, the net income attributable to Huntsman International was $253 million on revenues of $11,221 million, compared with net income attributable to Huntsman International of $180 million on revenues of $9,250 million for 2010. The increase of $73 million in net income attributable to Huntsman International was the result of the following items:
51
Sasol-Huntsman. For more information, see "Note 6. Investment in Unconsolidated Affiliates" to our audited consolidated financial statements.
52
Segment Analysis
Year Ended December 31, 2011 Compared to Year Ended December 31, 2010
| |
Year ended December 31, |
|
||||||||
|---|---|---|---|---|---|---|---|---|---|---|
| |
Percent Change Favorable (Unfavorable) |
|||||||||
| |
2011 | 2010 | ||||||||
Revenues |
||||||||||
Polyurethanes |
$ | 4,434 | $ | 3,605 | 23 | % | ||||
Performance Products |
3,301 | 2,659 | 24 | % | ||||||
Advanced Materials |
1,372 | 1,244 | 10 | % | ||||||
Textile Effects |
737 | 787 | (6 | )% | ||||||
Pigments |
1,642 | 1,213 | 35 | % | ||||||
Eliminations |
(265 | ) | (258 | ) | (3 | )% | ||||
Total |
$ | 11,221 | $ | 9,250 | 21 | % | ||||
Segment EBITDA |
||||||||||
Polyurethanes |
$ | 469 | $ | 319 | 47 | % | ||||
Performance Products |
385 | 363 | 6 | % | ||||||
Advanced Materials |
125 | 143 | (13 | )% | ||||||
Textile Effects |
(199 | ) | 1 | NM | ||||||
Pigments |
501 | 205 | 144 | % | ||||||
Corporate and other |
(236 | ) | (224 | ) | (5 | )% | ||||
Subtotal |
1,045 | 807 | 29 | % | ||||||
Discontinued Operations |
(6 | ) | 53 | NM | ||||||
Total |
$ | 1,039 | $ | 860 | 21 | % | ||||
| |
Year ended December 31, 2011 vs. 2010 | ||||||||||||
|---|---|---|---|---|---|---|---|---|---|---|---|---|---|
| |
Average Selling Price(1) |
|
|
||||||||||
| |
Local Currency |
Foreign Currency Translation Impact |
Mix & Other |
Sales Volumes(1) |
|||||||||
Period-Over-Period Increase (Decrease) |
|||||||||||||
Polyurethanes |
16 | % | 2 | % | (3 | )% | 8 | % | |||||
Performance Products |
20 | % | 2 | % | (1 | )% | 3 | % | |||||
Advanced Materials |
7 | % | 3 | % | — | — | |||||||
Textile Effects |
— | 3 | % | — | (9 | )% | |||||||
Pigments |
34 | % | 4 | % | (1 | )% | (2 | )% | |||||
Total Company |
16 | % | 3 | % | 3 | % | 5 | % | |||||
Polyurethanes
The increase in revenues in our Polyurethanes segment for 2011 compared to 2010 was primarily due to higher average selling prices and higher sales volumes. MDI average selling prices increased primarily in response to higher raw material costs, improved demand and the strength of major European currencies against the U.S. dollar. PO/MTBE average selling prices increased primarily in
53
response to higher raw material costs and industry supply constraints in the first half of 2011. MDI sales volumes increased primarily in response to improved demand in the insulation, automotive and composite wood panels sectors. PO/MTBE sales volumes increased compared to 2010 primarily due to a planned maintenance outage at our Port Neches, Texas facility during 2010. The increase in segment EBITDA was primarily due to higher sales volumes and margins, partially offset by higher manufacturing and selling, general and administrative costs. Segment EBITDA in 2010 was also negatively impacted by an estimated $40 million as a result of the planned maintenance outage at our Port Neches, Texas facility.
Performance Products
The increase in revenues in our Performance Products segment for 2011 compared to 2010 was primarily due to higher average selling prices and higher sales volumes. Average selling prices increased across all product groups principally in response to higher raw material costs and the strength of major European currencies against the U.S. dollar. Sales volumes increased mainly due to higher demand for ethyleneamines and EG, offset by lower sales of other amines and European surfactants. In addition, sales volumes increased as a result of our consolidation of the Sasol-Huntsman joint venture and our acquisition of the chemical business of Laffans Petrochemicals Limited (the "Laffans Acquisition"), both in April 2011. The increase in segment EBITDA was primarily due to higher sales volumes and higher margins as selling prices increased faster than raw material prices, partially offset by increased fixed costs. In addition, in 2011, we recorded a gain of $12 million in connection with the consolidation of the Sasol-Huntsman joint venture, and in 2010, we recorded a nonrecurring $18 million credit to appropriately reflect our investment in the Sasol-Huntsman joint venture.
Advanced Materials
The increase in revenues in our Advanced Materials segment for 2011 compared to 2010 was primarily due to higher average selling prices partially offset by lower sales volumes. Average selling prices increased in all regions and across the entire product portfolio in response to higher raw material costs and the strength of major European currencies against the U.S. dollar. Sales volumes decreased in the Asia-Pacific region, primarily as a result of lower demand in the wind energy market, as well as in Europe and the Americas, while sales volumes increased in India. The decrease in segment EBITDA was primarily due to lower margins, the impact of stronger major European currencies against the U.S. dollar, higher manufacturing and selling, general and administrative costs and higher restructuring, impairment and plant closing costs. During 2011 and 2010, our Advanced Materials segment recorded restructuring, impairment and plant closing charges (credits) of $20 million and $(2) million, respectively. For more information concerning restructuring activities, see "Note 11. Restructuring, Impairment and Plant Closing Costs" to our audited consolidated financial statements.
Textile Effects
The decrease in revenues in our Textile Effects segment for 2011 compared to 2010 was due to lower sales volumes, partially offset by higher average selling prices. Sales volumes decreased due to weak retail demand and customer manufacturing constraints. Average selling prices increased primarily from the strength of major international currencies against the U.S. dollar. The decrease in segment EBITDA was primarily due to higher restructuring, impairment and plant closing costs, lower sales volumes and the negative foreign currency impact of a stronger Swiss franc against the U.S. dollar on our manufacturing and selling, general and administrative costs. During 2011 and 2010, our Textile Effects segment recorded restructuring, impairment and plant closing charges of $135 and $15 million, respectively. For more information concerning restructuring activities, see "Note 11. Restructuring, Impairment and Plant Closing Costs" to our audited consolidated financial statements.
54
Pigments
The increase in revenues in our Pigments segment for 2011 compared to 2010 was due to higher average selling prices partially offset by lower sales volumes. Average selling prices increased in all regions of the world driven principally by higher raw materials costs and stronger overall market demand during the first half of 2011. Sales volumes decreased primarily due to decreased global demand in the last quarter of 2011, particularly in the Asia-Pacific, Africa, Middle East and Latin America regions. The increase in segment EBITDA was primarily due to higher margins, partially offset by higher manufacturing and selling, general and administrative costs.
Corporate and other
Corporate and other includes unallocated corporate overhead, unallocated foreign exchange gains and losses, LIFO inventory valuation reserve adjustments, loss on early extinguishment of debt, unallocated restructuring, impairment and plant closing costs, nonoperating income and expense and gains and losses on the disposition of corporate assets. For 2011, EBITDA from Corporate and other decreased by $12 million to a loss of $236 million from a loss of $224 million for 2010. The decrease in EBITDA from Corporate and other for 2011 resulted primarily from a $32 million increase in Legal Settlements ($40 million loss in 2011 compared to $8 million loss in 2010), a $4 million increase in LIFO inventory valuation expense ($22 million of expense in 2011 compared to $18 million of expense in 2010), a $5 million loss during 2011 in benzene purchases, raw material purchased to supply our Polyurethanes and Performance Products businesses, and a $10 million decrease in operating income due to the sale of corporate assets to Huntsman Corporation in 2010, and was partially offset by a decrease in loss on early extinguishment of debt of $30 million ($7 million of losses in 2011 compared to $37 million of losses in 2010), an increase in treasury gains of $7 million ($11 million in gains in 2011 compared to $4 million in gains in 2010), a decrease in restructuring costs of $3 million ($2 million in losses in 2011 compared to $5 million in losses in 2010) and an increase in the extraordinary gain on the Textile Effects Acquisition of $5 million ($4 million gain in 2011 compared to $1 million loss in 2010). For more information regarding the loss on early extinguishment of debt, see "Note 14. Debt—Redemption of Notes and Loss on Early Extinguishment of Debt" to our audited consolidated financial statements. For more information regarding extraordinary gain associated with the Textile Effects Acquisition, see "Note 3. Business Combinations and Dispositions—Textile Effects Acquisition" to our audited consolidated financial statements.
Discontinued Operations
The operating results of our former polymers, base chemicals and Australian styrenics businesses are classified as discontinued operations, and, accordingly, the revenues of these businesses are excluded from revenues for all periods presented. The EBITDA of these former businesses are included in discontinued operations for all periods presented. The income (loss) from discontinued operations represents the operating results, legal costs, partial fire insurance settlement gains and related litigation costs, and restructuring, impairment and plant closing costs and gain (loss) on disposal with respect to our former businesses. During 2010, we recognized a $110 million pretax gain in connection with the final settlement of our insurance claims related to the 2006 fire at our former Port Arthur, Texas plant, offset in part by related income taxes, legal and other costs. For more information, see "Note 25. Discontinued Operations" to our audited consolidated financial statements.
55
LIQUIDITY AND CAPITAL RESOURCES
The following is a discussion of our liquidity and capital resources.
Cash Flows for Year Ended December 31, 2012 Compared to the Year Ended December 31, 2011
Net cash provided by operating activities for 2012 and 2011 was $860 million and $432 million, respectively. The increase in net cash provided by operating activities during 2012 compared to 2011 was primarily attributable to an increase in operating income as described in "—Results of Operations" above and to a $154 million favorable variance in operating assets and liabilities for 2012 as compared with 2011.
Net cash used in investing activities for 2012 and 2011 was $578 million and $337 million, respectively. During 2012 and 2011, we paid $412 million and $327 million, respectively, for capital expenditures, net of reimbursements. During 2012, we paid €13 million (approximately $16 million) for the Russian Systems House Acquisition. During 2011, we paid $34 million, net of cash acquired, for the Laffans Acquisition and the acquisition of an MDI-based polyurethanes systems house in Istanbul, Turkey. On April 1, 2011, we began consolidating our Sasol-Huntsman joint venture and assumed its cash balance of $28 million. During 2011, we sold businesses and assets for $48 million, including the sale of our former stereolithography resin and Digitalis® machine manufacturing businesses for $41 million. During 2012 and 2011, we made investments in Louisiana Pigments Company, L.P. of $100 million and $26 million, respectively, and received dividends from our unconsolidated joint ventures, Louisiana Pigments Company, L.P. and BASF Huntsman Shanghai Isocyanate Investment B.V., of $82 million and $32 million, respectively. During 2012, we made investments in our Nanjing Jinling joint venture and our cost method investment in White Mountain Titanium Corporation of $24 million and $3 million, respectively. Additionally, the increase in net cash used in investing activities was partially attributable to an unfavorable variance in our receivable from affiliate for 2012 as compared with 2011.
Net cash used in financing activities for 2012 and 2011 was $306 million and $418 million, respectively. The decrease in net cash used in financing activities was primarily due to an increase in net proceeds from notes payable to affiliate in 2012 as compared to 2011, offset in part by higher net repayments of debt in 2012 as compared to 2011.
During 2012, we issued $400 million aggregate principal amount of 4.875% senior notes due 2020 ("2020 Senior Notes") and used the net proceeds to redeem a portion of our 2016 Senior Notes. Additionally, during 2012 we repaid $139 million on our senior secured credit facilities ("Senior Credit Facilities"). For more information, see "Note 14. Debt" to our consolidated financial statements.
Cash Flows for Year Ended December 31, 2011 Compared to the Year Ended December 31, 2010
Net cash provided by (used in) operating activities for 2011 and 2010 was $432 million and $(46) million, respectively. The increase in cash provided by operating activities during 2011 compared to 2010 was primarily attributable to an increase in operating income as described in "—Results of Operations" above and a $416 million favorable variance in operating assets and liabilities for 2011 as compared with 2010. Upon the adoption of new accounting guidance on January 1, 2010, sales of accounts receivable under our accounts receivable programs (our "A/R Programs") no longer meet the criteria for derecognition and off-balance sheet treatment. Accordingly, the amounts outstanding under our A/R Programs are accounted for as secured borrowings and were included on our balance sheet. As a result of the adoption of this new guidance, accounts receivable increased by $254 million and a corresponding increase in cash used in operating activities was reflected in the statement of cash flows for 2010.
56
Net cash used in investing activities for 2011 and 2010 was $337 million and $238 million, respectively. During 2011 and 2010, we paid $327 million and $202 million, respectively, for capital expenditures, net of reimbursements. During 2011, we paid $34 million, net of cash acquired, for the Laffans Acquisition and the acquisition of an MDI-based polyurethanes systems house in Istanbul, Turkey. On April 1, 2011, we began consolidating the Sasol-Huntsman joint venture and assumed its cash balance of $28 million. During 2011, we sold businesses and assets for $48 million, including the sale of our former stereolithography resin and Digitalis® machine manufacturing businesses for $41 million. During 2011, we received $32 million of dividends from our unconsolidated joint ventures, Louisiana Pigment Company, L.P. and BASF Huntsman Shanghai Isocyanate Investment B.V., and made investments in Louisiana Pigment Company, L.P. of $26 million. During 2010, we received proceeds of $110 million from the settlement of our insurance claims related to the 2006 fire at our former Port Arthur, Texas facility, $34 million of which was reflected in the statement of cash flows as investing activities.
Net cash used in financing activities for 2011 and 2010 was $418 million and $78 million, respectively. This increase in net cash used in financing activities was primarily due to higher net repayments of debt in 2010 as compared to 2011, dividends of $79 million paid to parent in 2011 and a $22 million reduction in call premiums paid related to early extinguishment of debt in 2010, offset in part by the on-balance sheet treatment of our A/R Programs in 2010. For more information regarding the call premiums paid, see "Note 14. Debt—Redemption of Notes and Loss on Early Extinguishment of Debt" to our audited consolidated financial statements.
Changes in Financial Condition
The following information summarizes our working capital (dollars in millions):
| |
December 31, 2012 |
Less: the Russian Systems House Acquisition(1) |
Subtotal | December 31, 2011 |
(Decrease) Increase |
Percent Change |
|||||||||||||
|---|---|---|---|---|---|---|---|---|---|---|---|---|---|---|---|---|---|---|---|
Cash and cash equivalents |
$ | 210 | $ | — | $ | 210 | $ | 231 | $ | (21 | ) | (9 | )% | ||||||
Restricted cash |
9 | — | 9 | 8 | 1 | 13 | % | ||||||||||||
Accounts receivable, net |
1,833 | (2 | ) | 1,831 | 1,677 | 154 | 9 | % | |||||||||||
Inventories |
1,819 | (9 | ) | 1,810 | 1,539 | 271 | 18 | % | |||||||||||
Prepaid expenses |
48 | — | 48 | 46 | 2 | 4 | % | ||||||||||||
Deferred income taxes |
51 | — | 51 | 40 | 11 | 28 | % | ||||||||||||
Other current assets |
222 | (1 | ) | 221 | 220 | 1 | — | % | |||||||||||
Total current assets |
4,192 | (12 | ) | 4,180 | 3,761 | 419 | 11 | % | |||||||||||
Accounts payable |
1,163 | (4 | ) | 1,159 | 926 | 233 | 25 | % | |||||||||||
Accrued liabilities |
723 | (1 | ) | 722 | 694 | 28 | 4 | % | |||||||||||
Deferred income taxes |
39 | (2 | ) | 37 | 29 | 8 | 28 | % | |||||||||||
Note payable to affiliate |
100 | — | 100 | 100 | — | — | % | ||||||||||||
Current portion of debt |
288 | — | 288 | 212 | 76 | 36 | % | ||||||||||||
Total current liabilities |
2,313 | (7 | ) | 2,306 | 1,961 | 345 | 18 | % | |||||||||||
Working capital |
$ | 1,879 | $ | (5 | ) | $ | 1,874 | $ | 1,800 | $ | 74 | 4 | % | ||||||
Excluding the effects of the Russian Systems House Acquisition, our working capital increased by $74 million as a result of the net impact of the following significant changes:
57
Direct and Subsidiary Debt
Senior Credit Facilities
As of December 31, 2012, our Senior Credit Facilities consisted of our revolving facility ("Revolving Facility"), our term loan B facility ("Term Loan B"), our extended term loan B facility ("Extended Term Loan B"), our extended term loan B facility—series 2 ("Extended Term Loan B—Series 2"), and our term loan C facility ("Term Loan C") as follows (dollars in millions):
Facility
|
Committed Amount |
Principal Outstanding |
Carrying Value |
Interest Rate(2) |
Maturity | ||||||||||
|---|---|---|---|---|---|---|---|---|---|---|---|---|---|---|---|
Revolving Facility |
$ | 400 | $ | — | (1) | $ | — | (1) | USD LIBOR plus 2.50% | 2017 | (3) | ||||
Term Loan B |
NA | 193 | 193 | USD LIBOR plus 1.50% | 2014 | ||||||||||
Extended Term Loan B |
NA | 637 | 637 | USD LIBOR plus 2.50% | 2017 | (3) | |||||||||
Extended Term Loan B—Series 2 |
NA | 342 | 342 | USD LIBOR plus 2.75% | 2017 | (3) | |||||||||
Term Loan C |
NA | 419 | 393 | USD LIBOR plus 2.25% | 2016 | ||||||||||
Our obligations under the Senior Credit Facilities are guaranteed by our guarantors, which consist of substantially all of our domestic subsidiaries and certain of our foreign subsidiaries, and are secured by a first priority lien on substantially all of our domestic property, plant and equipment, the stock of all of our material domestic subsidiaries and certain foreign subsidiaries, and pledges of intercompany notes between certain of our subsidiaries.
58
During the year ended December 31, 2012, we made the following payments on our Senior Credit Facilities:
In connection with these debt repayments, we recognized a loss on early extinguishment of debt of approximately $2 million during the year ended December 31, 2012.
Amendment to Credit Agreement
On March 6, 2012, we entered into a seventh amendment to our Senior Credit Facilities. Among other things, the amendment:
On March 7, 2011, we entered into a sixth amendment to our credit agreement. The amendment, among other things, extended $650 million of aggregate principal of Term Loan B to a stated maturity of April 2017 (now referred to as Extended Term Loan B) and increased the interest rate on the Extended Term Loan B to LIBOR plus 2.50%.
59
A/R Programs
Our A/R Programs are structured so that we grant a participating undivided interest in certain of our trade receivables to a U.S. special purpose entity ("U.S. SPE") and a European special purpose entity ("EU SPE"). We retain the servicing rights and a retained interest in the securitized receivables. Information regarding the A/R Programs was as follows (monetary amounts in millions):
| December 31, 2012 | ||||||||
|---|---|---|---|---|---|---|---|---|
Facility
|
Maturity | Maximum Funding Availability(1) |
Amount Outstanding |
Interest Rate(2)(3) | ||||
U.S. A/R Program |
April 2014 | $250 | $90(4) | Applicable Rate plus 1.50% - 1.65% | ||||
EU A/R Program |
April 2014 | €225 (approximately $297) |
€114 (approximately $151) |
Applicable Rate plus 2.0% | ||||
| December 31, 2011 | ||||||||
|---|---|---|---|---|---|---|---|---|
Facility
|
Maturity | Maximum Funding Availability(1) |
Amount Outstanding |
Interest Rate(2)(3) | ||||
U.S. A/R Program |
April 2014 | $250 | $90(4) | Applicable Rate plus 1.50% - 1.65% | ||||
EU A/R Program |
April 2014 | €225 (approximately $291) |
€114 (approximately $147) |
Applicable Rate plus 2.0% | ||||
As of December 31, 2012 and December 31, 2011, $520 million and $633 million, respectively, of accounts receivable were pledged as collateral under the A/R Programs.
On April 15, 2011, we entered into an amendment to our EU A/R Program. This amendment, among other things, extended the scheduled commitment termination date of the program to April 2014, added an additional lender to the program and reduced the applicable margin on borrowings to 2.0%.
On April 18, 2011, we entered into an amendment to our U.S. A/R Program. This amendment, among other things, extended the scheduled commitment termination date of the program to April 2014, added an additional lender to the program and reduced the applicable margin on borrowings to a range of 1.50% to 1.65%.
60
Notes
As of December 31, 2012, we had outstanding the following notes (monetary amounts in millions):
Notes
|
Maturity | Interest Rate | Amount Outstanding | ||||
|---|---|---|---|---|---|---|---|
2016 Senior Notes |
June 2016 | 5.50 | %(1) | $200 ($168 carrying value) | |||
2020 Senior Notes |
November 2020 | 4.875 | % | $400 | |||
Senior Subordinated Notes |
March 2020 | 8.625 | % | $350 | |||
Senior Subordinated Notes |
March 2021 | 8.625 | % | $530 ($542 carrying value) | |||
Our notes are governed by indentures which impose certain limitations on our Company including, among other things limitations on the incurrence of debt, distributions, certain restricted payments, asset sales, and affiliate transactions. The notes are unsecured obligations and are guaranteed by certain subsidiaries named as guarantors.
On November 19, 2012, we completed a $400 million offering of the 2020 Senior Notes. We used the net proceeds to redeem a portion of the 2016 Senior Notes. See "—Redemption of Notes and Loss on Early Extinguishment of Debt" below.
The 2020 Senior Notes bear interest at the rate of 4.875% per year payable semi-annually on May 15 and November 15 of each year, beginning on May 15, 2013 and are due on November 15, 2020. We may redeem the 2020 Senior Notes in whole or in part at any time prior to August 17, 2020 at a price equal to 100% of the principal amount thereof plus a "make-whole" premium and accrued and unpaid interest. We may redeem the 2020 Senior Notes in whole or in part on or after August 17, 2020 at a price equal to 100% of the principal amount thereof plus accrued and unpaid interest.
The 2020 Senior Notes are general unsecured senior obligations and are guaranteed on a general unsecured senior basis by the Guarantors. The indenture with respect to the 2020 Senior Notes imposes certain limitations on the ability of us and our subsidiaries to, among other things, incur additional indebtedness secured by any principal properties, incur indebtedness of nonguarantor subsidiaries, enter into sale and leaseback transactions with respect to any principal properties and consolidate or merge with or into any other person or lease, sell or transfer all or substantially all of its properties and assets. Upon the occurrence of certain change of control events, holders of the 2020 Senior Notes will have the right to require that we purchase all or a portion of such holder's 2020 Senior Notes in cash at a purchase price equal to 101% of the principal amount thereof plus accrued and unpaid interest to the date of repurchase.
61
Redemption of Notes and Loss on Early Extinguishment of Debt
During the years ended December 31, 2012 and 2011, we redeemed or repurchased the following notes (monetary amounts in millions):
Date of Redemption
|
Notes | Principal Amount of Notes Redeemed |
Amount Paid (Excluding Accrued Interest) |
Loss on Early Extinguishment of Debt |
||||||
|---|---|---|---|---|---|---|---|---|---|---|
December 3, 2012 |
5.50% Senior Notes due 2016 | $400 | $400 | $ | 77 | |||||
March 26, 2012 |
7.50% Senior Subordinated Notes due 2015 | €64 (approximately $86) |
€65 (approximately $87) |
$ | 1 | |||||
Three months ended December 31, 2011 |
6.875% Senior Subordinated Notes due 2013 | €70 (approximately $94) |
€71 (approximately $96) |
$ | 2 | |||||
Three months ended September 30, 2011 |
6.875% Senior Subordinated Notes due 2013 | €14 (approximately $19) |
€14 (approximately $19) |
$ | — | |||||
Three months ended September 30, 2011 |
7.50% Senior Subordinated Notes due 2015 | €12 (approximately $17) |
€12 (approximately $17) |
$ | — | |||||
July 25, 2011 |
7.375% Senior Subordinated Notes due 2015 | $75 | $77 | $ | 2 | |||||
January 18, 2011 |
7.375% Senior Subordinated Notes due 2015 | $100 | $102 | $ | 3 | |||||
Variable Interest Entity Debt
As of December 31, 2012, Arabian Amines Company had $180 million outstanding under its loan commitments and debt financing arrangements described below. Arabian Amines Company, our consolidated 50%-owned joint venture, is currently not in compliance with certain financial covenants contained under these loan commitments. We do not guaranty these loan commitments and Arabian Amines Company is not a guarantor of any of our other debt obligations, and the noncompliance with these financial covenants does not affect any of our other debt obligations. Arabian Amines Company is currently in discussions with the lenders under these loan commitments and expects to resolve the noncompliance. The amounts outstanding under these loan commitments were classified as current on the accompanying audited consolidated balance sheets as of December 31, 2012.
As of December 31, 2012, Sasol-Huntsman had a facility agreement which included a €5 million (approximately $6 million) revolving facility and €68 million (approximately $90 million) outstanding under the term loan facility. The facility will be repaid over semiannual installments that began in 2011,
62
with the final repayment scheduled for December 2018. Obligations under the facility agreement are secured by, among other things, first priority right on the property, plant and equipment of Sasol-Huntsman
Other Debt
During the year ended December 31, 2012, HPS repaid $4 million and RMB 120 million (approximately $19 million) on term loans and working capital loans under its secured facilities. As of December 31, 2012, HPS had $8 million and RMB 354 million (approximately $56 million) outstanding under its secured facilities. The interest rate on these facilities is LIBOR plus 0.48% for U.S. dollar borrowings and approximately 90% of the Peoples Bank of China rate for RMB borrowings. As of December 31, 2012, the interest rate was approximately 1% for the U.S. dollar borrowings and approximately 6% for RMB borrowings.
During the year ended December 31, 2012, HPS repaid RMB 309 million (approximately $50 million) under its loan facility for working capital loans and discounting of commercial drafts. As of December 31, 2012, HPS had RMB 190 million (approximately $30 million) outstanding, which is classified as current portion of debt on the accompanying consolidated balance sheets . Interest is calculated using a Peoples Bank of China rate plus the applicable margin. The average all-in rate as of December 31, 2012 was approximately 6%.
On March 30, 2012, we repaid the remaining A$26 million (approximately $27 million) outstanding under our Australian Credit Facility, which represents repayment of A$14 million (approximately $15 million) under the revolving facility and A$12 million (approximately $12 million) under the term loan facility.
Note Payable from Huntsman International to Huntsman Corporation
As of December 31, 2012, there was $695 million outstanding under the Intercompany Note owed by us to Huntsman Corporation. The Intercompany Note is unsecured and $100 million of the outstanding amount is classified as current as of December 31, 2012 on the accompanying audited consolidated balance sheets. As of December 31, 2012, under the terms of the Intercompany Note, we promise to pay Huntsman Corporation interest on the unpaid principal amount at a rate per annum based on the previous monthly average borrowing rate obtained under our U.S. A/R Program, less 10 basis points (provided that the rate shall not exceed an amount that is 25 basis points less than the monthly average borrowing rate obtained for the U.S. LIBOR-based borrowings under our Revolving Facility).
Compliance with Covenants
We believe that we are in compliance with the covenants contained in the agreements governing our material debt instruments, including our Senior Credit Facilities, our A/R Programs and our notes. However, Arabian Amines Company, our consolidated 50%-owned joint venture, is currently not in compliance with certain financial covenants under its loan commitments. See "—Variable Interest Entity Debt" above.
Our material financing arrangements contain certain covenants with which we must comply. A failure to comply with a covenant could result in a default under a financing arrangement unless we obtained an appropriate waiver or forbearance (as to which we can provide no assurance). A default under these material financing arrangements generally allows debt holders the option to declare the underlying debt obligations immediately due and payable. Furthermore, certain of our material financing arrangements contain cross-default and cross-acceleration provisions under which a failure to comply with the covenants in one financing arrangement may result in an event of default under another financing arrangement.
63
Our Senior Credit Facilities are subject to a single financial covenant (the "Leverage Covenant") which applies only to the Revolving Facility. The Leverage Covenant is applicable only if borrowings, letters of credit or guarantees are outstanding under the Revolving Facility (cash collateralized letters of credit or guarantees are not deemed outstanding). The Leverage Covenant is a net senior secured leverage ratio covenant which requires that our ratio of senior secured debt to EBITDA (as defined in the applicable agreement) is not more than 3.75 to 1.
If in the future we fail to comply with the Leverage Covenant, then we may not have access to liquidity under our Revolving Facility. If we fail to comply with the Leverage Covenant at a time when we had uncollateralized loans or letters of credit outstanding under the Revolving Facility, we would be in default under the Senior Credit Facilities, and, unless we obtain a waiver or forbearance with respect to such default (as to which we can provide no assurance), we could be required to pay off the balance of the Senior Credit Facilities in full, and we may not have further access to such facilities.
The agreements governing our A/R Programs also contain certain receivable performance metrics. Any material failure to meet the applicable A/R Programs' metrics in the future could lead to an early termination event under the A/R Programs, which could require us to cease our use of such facilities, prohibiting us from additional borrowings against our receivables or, at the discretion of the lenders, requiring that we repay the A/R Programs in full. An early termination event under the A/R Programs would also constitute an event of default under our Senior Credit Facilities, which could require us to pay off the balance of the Senior Credit Facilities in full and could result in the loss of our Senior Credit Facilities.
Short-Term and Long-Term Liquidity
We depend upon our cash, credit facilities, A/R Programs and other debt instruments to provide liquidity for our operations and working capital needs. As of December 31, 2012, we had $710 million of combined cash and unused borrowing capacity, consisting of $219 million in cash and restricted cash, $381 million in availability under our Revolving Facility, and $110 million in availability under our A/R Programs. Our liquidity can be significantly impacted by various factors. The following matters had, or are expected to have, a significant impact on our liquidity:
64
On September 8, 2009, we announced the closure of our styrenics facility located at West Footscray, Australia. We ceased the Australian styrenics operations during the first quarter of 2010. As of December 31, 2012, we had restructuring accruals of $6 million and environmental remediation accruals of $29 million. We can provide no assurance that the eventual environmental remediation costs will not be materially different from our current estimate. The plant closure and environmental remediation costs are expected to be funded as they are incurred over the next several years.
As of December 31, 2012, we had $288 million classified as current portion of debt which consists of certain scheduled term payments and various short-term facilities including an HPS borrowing facility in China with $39 million outstanding, debt at our variable interest entities of $193 million, $15 million related to the annual financing of our insurance premiums, and certain other short-term facilities and scheduled amortization payments totaling $41 million. Although we cannot provide assurances, we intend to renew or extend the majority of these short-term facilities in the current period. For more information, see "Note 14. Debt" to our audited consolidated financial statements
As of December 31, 2012, we had approximately $191 million of cash and cash equivalents, including restricted cash, held by our foreign subsidiaries, including our variable interest entities. Additionally, we have material intercompany debt obligations owed to us by our non-U.S. subsidiaries. We intend to use cash held in our foreign subsidiaries to fund our local operations. Nevertheless, we could repatriate cash as dividends or as repayments of intercompany debt. If foreign cash were repatriated as dividends, the dividends could be subject to adverse tax consequences. At present, we estimate that we will generate sufficient cash in our U.S. operations, together with the payments of intercompany debt if necessary, to meet our cash needs in the U.S and we do not expect to repatriate material cash amounts to the U.S. as dividends in the near term. Cash held by certain foreign subsidiaries, including our variable interest entities, may also be subject to legal restrictions, including those arising from the interests of our partners, which could limit the amounts available for repatriation.
CONTRACTUAL OBLIGATIONS AND COMMERCIAL COMMITMENTS
Our obligations under long-term debt (including the current portion), lease agreements and other contractual commitments as of December 31, 2012 are summarized below (dollars in millions):
| |
2013 | 2014 - 2015 | 2016 - 2017 | After 2017 | Total | |||||||||||
|---|---|---|---|---|---|---|---|---|---|---|---|---|---|---|---|---|
Long-term debt, including current portion(1) |
$ | 288 | $ | 554 | $ | 1,544 | $ | 1,316 | $ | 3,702 | ||||||
Interest(2) |
202 | 356 | 268 | 276 | 1,102 | |||||||||||
Operating leases(3) |
79 | 121 | 85 | 60 | 345 | |||||||||||
Purchase commitments(4) |
1,138 | 672 | 118 | 30 | 1,958 | |||||||||||
Total(5)(6) |
$ | 1,707 | $ | 1,703 | $ | 2,015 | $ | 1,682 | $ | 7,107 | ||||||
65
| |
2013 | 2014 - 2015 | 2016 - 2017 | 5-Year Average Annual |
|||||||||
|---|---|---|---|---|---|---|---|---|---|---|---|---|---|
Pension plans |
$ | 155 | $ | 353 | $ | 289 | $ | 121 | |||||
Other postretirement obligations |
11 | 23 | 23 | 10 | |||||||||
RESTRUCTURING, IMPAIRMENT AND PLANT CLOSING COSTS
For a discussion of restructuring, impairment and plant closing costs, see "Note 11. Restructuring, Impairment and Plant Closing Costs" to our audited consolidated financial statements.
ENVIRONMENTAL, HEALTH AND SAFETY MATTERS
For a discussion of environmental, health and safety matters, see "Note 20. Environmental, Health and Safety Matters" to our audited consolidated financial statements.
RECENTLY ISSUED ACCOUNTING PRONOUNCEMENTS
For a discussion of recently issued accounting pronouncements, see "Note 2. Summary of Significant Accounting Policies—Recently Issued Accounting Pronouncements" to our audited consolidated financial statements.
CRITICAL ACCOUNTING POLICIES
The preparation of financial statements and related disclosures in conformity with U.S. GAAP requires management to make judgments, estimates and assumptions that affect the reported amounts in the audited consolidated financial statements. Our significant accounting policies are summarized in "Note 2. Summary of Significant Accounting Policies" to our audited consolidated financial statements. Summarized below are our critical accounting policies:
Contingent Loss Accruals
Environmental remediation costs for our facilities are accrued when it is probable that a liability has been incurred and the amount can be reasonably estimated. Estimates of environmental reserves
66
require evaluating government regulation, available technology, site-specific information and remediation alternatives. We accrue an amount equal to our best estimate of the costs to remediate based upon the available information. The extent of environmental impacts may not be fully known and the processes and costs of remediation may change as new information is obtained or technology for remediation is improved. Our process for estimating the expected cost for remediation considers the information available, technology that can be utilized and estimates of the extent of environmental damage. Adjustments to our estimates are made periodically based upon additional information received as remediation progresses. For further information, see "Note 20. Environmental, Health and Safety Matters" to our audited consolidated financial statements.
We are subject to legal proceedings and claims arising out of our business operations. We routinely assess the likelihood of any adverse outcomes to these matters, as well as ranges of probable losses. A determination of the amount of the reserves required, if any, for these contingencies is made after analysis of each known claim. We have an active risk management program consisting of numerous insurance policies secured from many carriers. These policies often provide coverage that is intended to minimize the financial impact, if any, of the legal proceedings. The required reserves may change in the future due to new developments in each matter. For further information, see "Note 19. Commitments and Contingencies—Legal Matters" to our audited consolidated financial statements.
Employee Benefit Programs
We sponsor several contributory and non-contributory defined benefit plans, covering employees primarily in the U.S., the U.K., The Netherlands, Belgium and Switzerland, but also covering employees in a number of other countries. We fund the material plans through trust arrangements (or local equivalents) where the assets are held separately from us. We also sponsor unfunded postretirement plans which provide medical and, in some cases, life insurance benefits covering certain employees in the U.S., Canada and South Africa. Amounts recorded in the consolidated financial statements are recorded based upon actuarial valuations performed by various independent actuaries. Inherent in these valuations are numerous assumptions regarding expected long-term rates of return on plan assets, discount rates, compensation increases, mortality rates and health care cost trends. These assumptions are described in "Note 17. Employee Benefit Plans" to our audited consolidated financial statements.
Management, with the advice of actuaries, uses judgment to make assumptions on which our employee pension and postretirement benefit plan obligations and expenses are based. The effect of a 1% change in three key assumptions is summarized as follows (dollars in millions):
Assumptions
|
Statement of Operations(1) |
Balance Sheet Impact(2) |
|||||
|---|---|---|---|---|---|---|---|
Discount rate |
|||||||
—1% increase |
$ | (28 | ) | $ | (507.5 | ) | |
—1% decrease |
34 | 589.4 | |||||
Expected long-term rates of return on plan assets |
|||||||
—1% increase |
(26 | ) | — | ||||
—1% decrease |
26 | — | |||||
Rate of compensation increase |
|||||||
—1% increase |
18 | 114.3 | |||||
—1% decrease |
(17 | ) | (108.8 | ) | |||
67
Fair Value
Pursuant to the settlement agreement reached in our parent's litigation with the banks that had entered into a commitment letter to provide funding for the Hexion Merger (the "Texas Bank Litigation Settlement Agreement"), on June 22, 2009, we entered into an amendment of its Senior Credit Facilities that provided for Term Loan C with a $500 million principal amount, and we also issued $600 million aggregate principal amount of 2016 Senior Notes. In accordance with accounting guidance regarding fair value measurements, we recorded the Term Loan C and the 2016 Senior Notes in our accounting records at fair values of $439 million and $425 million, respectively, upon initial recognition in June 2009. In November 2012, we completed a $400 million offering of its 2020 Senior Notes and used the net proceeds to redeem $400 million of the aggregate principal amount of its 2016 Senior Notes.
We primarily used the income approach to determine the fair value of these instruments. Fair value represents the present value of estimated future cash flows calculated using interest rates that were available to us for issuance of debt with similar terms, adjusted for differences in remaining maturity using relevant debt yield curves.
Management used judgment with respect to assumptions used in estimating the fair values of the Term Loan C and the 2016 Senior Notes. The effect of the following changes in certain key assumptions is summarized as follows (dollars in millions):
Assumptions
|
Balance Sheet Impact(1) |
|||
|---|---|---|---|---|
Effective market yield |
||||
—1% increase |
$ | (30 | ) | |
—1% decrease |
32 | |||
Goodwill
We test our goodwill for impairment at least annually (at the beginning of the third quarter) and when events and circumstances change that would more likely than not reduce the fair value of a reporting unit below its carrying amount. Goodwill has been assigned to reporting units for purposes of impairment testing. Currently, more than 70% of our goodwill balance relates to our Advanced Materials reporting unit. The remaining goodwill relates to four other reporting units.
Fair value is estimated using the market approach, as well as the income approach based on discounted cash flow projections. The estimated fair values of our reporting units are dependent on several significant assumptions including, among others, market information, operating results, earnings projections and anticipated future cash flows.
We tested goodwill for impairment at the beginning of the third quarter of 2012 as part of the annual impairment testing procedures and determined that no goodwill impairment existed. Our most recent fair value determination resulted in an amount that exceeded the carrying amount of our Advanced Materials reporting unit by a significant margin.
Income Taxes
We use the asset and liability method of accounting for income taxes. Deferred income taxes reflect the net tax effects of temporary differences between the carrying amounts of assets and liabilities for financial and tax reporting purposes. We evaluate deferred tax assets to determine whether it is more likely than not that they will be realized. Valuation allowances are reviewed on a tax
68
jurisdiction basis to analyze whether there is sufficient positive or negative evidence to support a change in judgment about the realizability of the related deferred tax assets for each jurisdiction. These conclusions require significant judgment. In evaluating the objective evidence that historical results provide, we consider the cyclicality of businesses and cumulative income or losses during the applicable period. Cumulative losses incurred over the period limits our ability to consider other subjective evidence such as our projections for the future. Changes in expected future income in applicable jurisdictions could affect the realization of deferred tax assets in those jurisdictions. As of December 31, 2012, we had total valuation allowances of $736 million. Please see "Note 18. Income Taxes" to our audited consolidated financial statements for more information regarding our valuation allowances.
For non-U.S. entities that were not treated as branches for U.S. tax purposes, we do not provide for income taxes on the undistributed earnings of these subsidiaries as earnings are reinvested and, in the opinion of management, will continue to be reinvested indefinitely. The undistributed earnings of foreign subsidiaries that are deemed to be permanently invested were approximately $215 million at December 31, 2012. It is not practicable to determine the unrecognized deferred tax liability on those earnings. We have material inter-company debt obligations owed by our non-U.S. subsidiaries to the U.S. We do not intend to repatriate earnings to the U.S. via dividend based on estimates of future domestic cash generation, combined with the ability to return cash to the U.S. through payments of inter-company debt owned by our non-U.S. subsidiaries to the U.S. To the extent that cash is required in the U.S., rather than repatriate earnings to the U.S. via dividend we will utilize our inter-company debt. If any earnings were repatriated via dividend, we would need to accrue and pay taxes on the distributions.
Accounting for uncertainty in income taxes prescribes a recognition threshold and measurement attribute for the financial statement recognition and measurement of a tax position taken or expected to be taken in a tax return. The application of income tax law is inherently complex. We are required to determine if an income tax position meets the criteria of more-likely-than-not to be realized based on the merits of the position under tax law, in order to recognize an income tax benefit. This requires us to make significant judgments regarding the merits of income tax positions and the application of income tax law. Additionally, if a tax position meets the recognition criteria of more-likely-than-not we are required to make judgments and apply assumptions in order to measure the amount of the tax benefits to recognize. These judgments are based on the probability of the amount of tax benefits that would be realized if the tax position was challenged by the taxing authorities. Interpretations and guidance surrounding income tax laws and regulations change over time. As a consequence, changes in assumptions and judgments can materially affect amounts recognized in the audited consolidated financial statements.
Long-Lived Assets
The useful lives of our property, plant and equipment are estimated based upon our historical experience, engineering estimates and industry information and are reviewed when economic events indicate that we may not be able to recover the carrying value of the assets. The estimated lives of our property range from 3 to 33 years and depreciation is recorded on the straight-line method. Inherent in our estimates of useful lives is the assumption that periodic maintenance and an appropriate level of annual capital expenditures will be performed. Without on-going capital improvements and maintenance, the productivity and cost efficiency declines and the useful lives of our assets would be shorter.
Management uses judgment to estimate the useful lives of our long-lived assets. At December 31, 2012, if the estimated useful lives of our property, plant and equipment had either been one year greater or one year less than their recorded lives, then depreciation expense for 2012 would have been approximately $30 million less or $35 million greater, respectively.
69
We are required to evaluate the carrying value of our long-lived tangible and intangible assets whenever events indicate that such carrying value may not be recoverable in the future or when management's plans change regarding those assets, such as idling or closing a plant. We evaluate impairment by comparing undiscounted cash flows of the related asset groups that are largely independent of the cash flows of other asset groups to their carrying values. Key assumptions in determining the future cash flows include the useful life, technology, competitive pressures, raw material pricing and regulations. In connection with our asset evaluation policy, we reviewed all of our long-lived assets for indicators that the carrying value may not be recoverable. We determined that such indicators did not exist during the year ended December 31, 2012.
Restructuring and Plant Closing Costs
We have recorded restructuring charges in recent periods in connection with closing certain plant locations, workforce reductions and other cost savings programs in each of our segments, other than Performance Products. These charges are recorded when management has committed to a plan and incurred a liability related to the plan. Estimates for plant closing costs include the write-off of the carrying value of the plant, any necessary environmental and/or regulatory costs, contract termination and demolition costs. Estimates for workforce reductions and other costs savings are recorded based upon estimates of the number of positions to be terminated, termination benefits to be provided and other information, as necessary. Management evaluates the estimates on a quarterly basis and will adjust the reserve when information indicates that the estimate is above or below the currently recorded estimate. For further discussion of our restructuring activities, see "Note 11. Restructuring, Impairment and Plant Closing Costs" to our audited consolidated financial statements.
Revenue Recognition
We generate substantially all of our revenues through sales in the open market and long-term supply agreements. We recognize revenue when it is realized or realizable and earned. Revenue for product sales is recognized when a sales arrangement exists, risk and title to the product transfer to the customer, collectability is reasonably assured and pricing is fixed or determinable. The transfer of risk and title to the product to the customer usually occurs at the time shipment is made.
Revenue arrangements that contain multiple deliverables, which relate primarily to the licensing of technology, are evaluated in accordance with ASC 605-25, Revenue Recognition—Multiple-Element Arrangements, to determine whether the arrangements should be divided into separate units of accounting and how the arrangement consideration should be measured and allocated among the separate units of accounting.
Variable Interest Entities—Primary Beneficiary
We evaluate each of our variable interest entities on an on-going basis to determine whether we are the primary beneficiary. Management assesses, on an on-going basis, the nature of our relationship to the variable interest entity, including the amount of control that we exercise over the entity as well as the amount of risk that we bear and rewards we receive in regards to the entity, to determine if we are the primary beneficiary of that variable interest entity. Management judgment is required to assess whether these attributes are significant. We consolidate all variable interest entities for which we have concluded that we are the primary beneficiary.
70
QUANTITATIVE AND QUALITATIVE DISCLOSURES ABOUT MARKET RISK
We are exposed to market risks, such as changes in interest rates, foreign exchange rates and commodity pricing risks. From time to time, we enter into transactions, including transactions involving derivative instruments, to manage certain of these exposures. We also hedge our net investment in certain European operations. Changes in the fair value of the hedge in the net investment of certain European operations are recorded in accumulated other comprehensive loss.
Interest Rate Risks
Through our borrowing activities, we are exposed to interest rate risk. Such risk arises due to the structure of our debt portfolio, including the duration of the portfolio and the mix of fixed and floating interest rates. Actions taken to reduce interest rate risk include managing the mix and rate characteristics of various interest bearing liabilities, as well as entering into interest rate derivative instruments.
From time to time, we may purchase interest rate swaps and/or interest rate collars to reduce the impact of changes in interest rates on our floating-rate long-term debt. Under interest rate swaps, we agree with other parties to exchange, at specified intervals, the difference between fixed-rate and floating-rate interest amounts calculated by reference to an agreed notional principal amount. The collars entitle us to receive from the counterparties (major banks) the amounts, if any, by which our interest payments on certain of our floating-rate borrowings exceed a certain rate, and require us to pay to the counterparties (major banks) the amount, if any, by which our interest payments on certain of our floating-rate borrowings are less than a certain rate.
On December 9, 2009, we entered into a five-year interest rate contract to hedge the variability caused by monthly changes in cash flow due to associated changes in LIBOR under our Senior Credit Facilities. The notional value of the contract is $50 million, and it has been designated as a cash flow hedge. The effective portion of the changes in the fair value of the swap was recorded in other comprehensive loss. We will pay a fixed 2.6% on the hedge and receive the one-month LIBOR rate. As of December 31, 2012 and 2011 the fair value of the hedge was $2 million and $3 million, respectively, and was recorded in other noncurrent liabilities.
On January 19, 2010, we entered into an additional five-year interest rate contract to hedge the variability caused by monthly changes in cash flow due to associated changes in LIBOR under our Senior Credit Facilities. The notional value of the contract is $50 million, and it has been designated as a cash flow hedge. The effective portion of the changes in the fair value of the swap was recorded as other comprehensive loss. We will pay a fixed 2.8% on the hedge and receive the one-month LIBOR rate. As of December 31, 2012 and 2011, the fair value of the hedge was $3 million and $3 million, respectively, and was recorded in other noncurrent liabilities.
On September 1, 2011, we entered into a $50 million forward interest rate contract that will begin in December 2014 with maturity in April 2017 and a $50 million forward interest rate contract that will begin in January 2015 with maturity in April 2017. These two forward contracts are to hedge the variability caused by monthly changes in cash flow due to associated changes in LIBOR under our Senior Credit Facilities once our existing interest rate hedges mature. These swaps are designated as a cash flow hedges and the effective portion of the changes in the fair value of the swaps were recorded in other comprehensive income. Both interest rate contracts will pay a fixed 2.5% on the hedge and receive the one-month LIBOR rate once the contracts begin in 2014 and 2015, respectively. As of December 31, 2012 and 2011, the combined fair value of these two hedges was $4 million and $1 million, respectively and was recorded in other noncurrent liabilities.
In 2009, Sasol-Huntsman entered into derivative transactions to hedge the variable interest rate associated with its local credit facility. These derivative rate hedges include a floating to fixed interest
71
rate contract providing Sasol-Huntsman with EURIBOR interest payments for a fixed payment of 3.62% and a cap for future periods with a strike price of 3.62%. In connection with the consolidation of Sasol-Huntsman as of April 1, 2011, the interest rate contract is now included in our consolidated results. See "Note 7. Variable Interest Entities" to our audited consolidated financial statements. The notional amount of the hedge as of December 31, 2012 was €47 million (approximately $62 million) and the derivative transactions do not qualify for hedge accounting. As of December 31, 2012 and 2011, the fair value of this hedge was €2 million (approximately $3 million) and €3 million (approximately $3 million), respectively, and was recorded in other noncurrent liabilities on the accompanying audited consolidated balance sheets. For 2012 and 2011, we recorded additional (reduction of) interest expense of less than €(1) million (approximately $(1) million) and €2 million (approximately $2 million) respectively, due to changes in the fair value of the swap.
Beginning in 2009, Arabian Amines Company entered into a 12-year floating to fixed interest rate contract providing for a receipt of LIBOR interest payments for a fixed payment of 5.02%. In connection with the consolidation of Arabian Amines Company as of July 1, 2010, the interest rate contract is now included in our consolidated results. See "Note 7. Variable Interest Entities" to our audited consolidated financial statements. The notional amount of the swap as of December 31, 2012 was $36 million, and the interest rate contract is not designated as a cash flow hedge. As of December 31, 2012 and 2011, the fair value of the swap was $6 million and $6 million, respectively, and was recorded as other noncurrent liabilities on the accompanying audited consolidated balance sheets. For 2012 and 2011, we recorded additional (reduction of) interest expense of less than $(1) million and $1 million, respectively, due to changes in fair value of the swap. As of December 31, 2012 Arabian Amines Company was not in compliance with certain financial covenants contained in its loan commitments. For more information, see "Note 14. Debt—Variable Interest Entity Debt" to our audited consolidated financial statements.
For the years ended December 31, 2012 and 2011, the changes in accumulated other comprehensive loss associated with these cash flow hedging activities was approximately $1 million and $4 million, respectively.
During 2013, accumulated other comprehensive loss of nil is expected to be reclassified to earnings. The actual amount that will be reclassified to earnings over the next twelve months may vary from this amount due to changing market conditions. We would be exposed to credit losses in the event of nonperformance by a counterparty to our derivative financial instruments. We anticipate, however, that the counterparties will be able to fully satisfy their obligations under the contracts. Market risk arises from changes in interest rates.
Foreign Exchange Rate Risk
Our cash flows and earnings are subject to fluctuations due to exchange rate variation. Our revenues and expenses are denominated in various currencies. We enter into foreign currency derivative instruments to minimize the short-term impact of movements in foreign currency rates. Where practicable, we generally net multicurrency cash balances among our subsidiaries to help reduce exposure to foreign currency exchange rates. Certain other exposures may be managed from time to time through financial market transactions, principally through the purchase of spot or forward foreign exchange contracts (generally with maturities of three months or less). We do not hedge our currency exposures in a manner that would eliminate the effect of changes in exchange rates on our cash flows and earnings. As of December 31, 2012 and 2011, we had approximately $217 million and $263 million notional amount (in U.S. dollar equivalents) outstanding, respectively, in foreign currency contracts with a term of approximately one month.
In conjunction with the issuance of our 8.625% senior subordinated notes due 2020, we entered into cross-currency interest rate contracts with three counterparties. On March 17, 2010, we made
72
payments of $350 million to these counterparties and received €255 million from these counterparties, and on maturity (March 15, 2015) we are required to pay €255 million to these counterparties and will receive $350 million from these counterparties. On March 15 and September 15 of each year, we will receive U.S. dollar interest payments of approximately $15 million (equivalent to an annual rate of 8.625%) and make interest payments of approximately €11 million (equivalent to an annual rate of approximately 8.41%). This swap is designated as a hedge of net investment for financial reporting purposes. As of December 31, 2012 and 2011, the fair value of this swap was $18 million and $27 million, respectively, and was recorded in noncurrent assets.
A portion of our debt is denominated in euros. We also finance certain of our non-U.S. subsidiaries with intercompany loans that are, in many cases, denominated in currencies other than the entities' functional currency. We manage the net foreign currency exposure created by this debt through various means, including cross-currency swaps, the designation of certain intercompany loans as permanent loans because they are not expected to be repaid in the foreseeable future ("permanent loans") and the designation of certain debt and swaps as net investment hedges.
Foreign currency transaction gains and losses on intercompany loans that are not designated as permanent loans are recorded in earnings. Foreign currency transaction gains and losses on intercompany loans that are designated as permanent loans are recorded in other comprehensive income. From time to time, we review such designation of intercompany loans.
We review our non-U.S. dollar denominated debt and derivative instruments to determine the appropriate amounts designated as hedges. As of December 31, 2012, we have designated approximately €255 million (approximately $336 million) of euro-denominated debt and cross- currency interest rate contracts as a hedge of our net investment. For the years ended December 31, 2012, 2011 and 2010, the amount of gain (loss) recognized on the hedge of our net investment was $(11) million, $5 million and $34 million, respectively, and was recorded in other comprehensive (loss) income. As of December 31, 2012, we had approximately €1,083 million (approximately $1,431 million) in net euro assets.
Commodity Prices Risk
Our exposure to changing commodity prices is somewhat limited since the majority of our raw materials are acquired at posted or market related prices, and sales prices for many of our finished products are at market related prices which are largely set on a monthly or quarterly basis in line with industry practice. Consequently, we do not generally hedge our commodity exposures.
73
GENERAL
We are a global manufacturer of differentiated organic chemical products and of inorganic chemical products. Our Company, a Delaware corporation, was formed in 2004 to hold the businesses of Huntsman Holdings, LLC, a company founded by Jon M. Huntsman. Mr. Huntsman founded the predecessor to our Company in 1970 as a small polystyrene plastics packaging company. Since then, we have grown through a series of significant acquisitions and now own a global portfolio of businesses.
Our principal executive offices are located at 500 Huntsman Way, Salt Lake City, Utah 84108, and our telephone number at that location is (801) 584-5700.
RECENT DEVELOPMENTS
Amendment to Credit Agreement
On March 11, 2013, we entered into an eighth amendment to the credit agreement with respect to our Senior Credit Facilities. The amendment provides for $225 million of additional term loans (the "Additional Term Loans"), the net proceeds of which will be used to repay in full the remaining outstanding balance of approximately $193 million under our existing Term Loan B that matures on April 14, 2014 and for other permitted purposes under our credit agreement. The Additional Term Loans have terms identical to our existing Extended Term Loan B that matures on April 19, 2017. The Additional Term Loans will amortize in an amount equal to 1% of the principal amount of the Additional Term Loans, payable annually commencing on March 31, 2014. JPMorgan Chase Bank is the administrative agent under the amended credit agreement.
PO/MTBE Joint Venture in China
On November 13, 2012, we entered into an agreement to form a joint venture with Sinopec ("Nanjing Jinling"). The joint venture will involve the construction and operation of a PO/MTBE facility in China. Under the joint venture agreement, we will have a 49% interest in the joint venture and Sinopec will hold a 51% interest. Our equity investment is anticipated to be approximately $120 million, and we expect to receive significant license fees from the joint venture. The timing of equity contributions and license fee payments depends on various factors, but the majority are intended to be made over the course of the construction period of the plant (expected to be completed by the end of 2014).
OVERVIEW
Our products comprise a broad range of chemicals and formulations which we market globally to a diversified group of consumer and industrial customers. Our products are used in a wide range of applications, including those in the adhesives, aerospace, automotive, construction products, personal care and hygiene, durable and non-durable consumer products, electronics, medical, packaging, paints and coatings, power generation, refining, synthetic fiber, textile chemicals and dye industries. We are a leading global producer in many of our key product lines, including MDI, amines, surfactants, epoxy-based polymer formulations, textile chemicals, dyes, maleic anhydride and titanium dioxide. Our administrative, research and development and manufacturing operations are primarily conducted at the facilities listed in "—Item 2. Properties" below, which are located in 30 countries. As of December 31, 2012, we employed approximately 12,000 associates worldwide. Our revenues for the years ended December 31, 2012, 2011 and 2010 were $11,187 million, $11,221 million and $9,250 million, respectively.
We operate in five segments: Polyurethanes, Performance Products, Advanced Materials, Textile Effects and Pigments. In a series of transactions beginning in 2006, we sold our North American
74
polymers and base chemicals operations and substantially shutdown all of our Australian styrenics operations. We report the results of these businesses as discontinued operations in our statements of operations. See "Note 25. Discontinued Operations" to our audited consolidated financial statements.
Our Products
We produce differentiated organic and inorganic chemical products. Our Polyurethanes, Performance Products, Advanced Materials and Textile Effects segments produce differentiated organic chemical products and our Pigments segment produces inorganic chemical products.
Growth in our differentiated products has been driven by the substitution of our products for other materials and by the level of global economic activity. Accordingly, the profitability of our differentiated products has been somewhat less influenced by the cyclicality that typically impacts the petrochemical industry. Our Pigments business, while cyclical, is influenced by seasonal demand patterns in the coatings industry.
| 2012 Segment Revenues(1) | 2012 Segment Adjusted EBITDA(1) |
| $11,187 million | $1,396 million |
75
The following table identifies the key products, their principal end markets and applications and representative customers of each of our segments:
Segment
|
Products | End Markets and Applications | Representative Customers | |||
|---|---|---|---|---|---|---|
| Polyurethanes | MDI, PO, polyols, PG, TPU, aniline and MTBE | Refrigeration and appliance insulation, construction products, adhesives, automotive, footwear, furniture, cushioning, specialized engineering applications and fuel additives | BMW, CertainTeed, Electrolux, Firestone, GE, Haier, Louisiana Pacific, PMI, Recticel, Weyerhaeuser | |||
Performance Products |
Amines, surfactants, LAB, maleic anhydride, other performance chemicals, EG, olefins and technology licenses |
Detergents, personal care products, agrochemicals, lubricant and fuel additives, adhesives, paints and coatings, construction, marine and automotive products, composites, and PET fibers and resins |
Afton, Chevron, Dow, Henkel, L'Oreal, Lubrizol, Monsanto, Procter & Gamble, Reichhold, Sun Products, Unilever |
|||
Advanced Materials |
Basic liquid and solid epoxy resins; specialty resin compounds; cross- linking, matting and curing agents; epoxy, acrylic and polyurethane-based formulations |
Aerospace and industrial adhesives, composites for aerospace, automotive, and wind power generation; construction and civil engineering; industrial coatings; electrical power transmission; consumer electronics |
ABB, AkzoNobel, Bodo Moller, Cytec, Freeman, Henkel, Hexcel, ISOLA, Lianyungang, Omya, PPG, Ribelin, RPM, Sanarrow, Schneider, Sherwin Williams, Siemens, Sika, Speed Fair, Syngenta, Toray, |
|||
Textile Effects |
Textile chemicals and dyes |
Apparel, home and technical textiles |
Aunde, Esquel Group, Fruit of the Loom, Guilford Mills, Hanesbrands, Nice Dyeing, Polartec, Tencate, Y.R.C., Zaber & Zubair |
|||
Pigments |
Titanium dioxide |
Paints and coatings, plastics, paper, printing inks, fibers and ceramics |
AkzoNobel, Clariant, Jotun, PolyOne, PPG |
Polyurethanes
General
We are a leading global manufacturer and marketer of a broad range of polyurethane chemicals, including MDI products, PO, polyols, PG and TPU. Polyurethane chemicals are used to produce rigid and flexible foams, as well as coatings, adhesives, sealants and elastomers. We focus on the
76
higher-margin, higher-growth markets for MDI and MDI-based polyurethane systems. Growth in our Polyurethanes segment has been driven primarily by the continued substitution of MDI-based products for other materials across a broad range of applications. We operate 5 primary Polyurethanes manufacturing facilities in the U.S., Europe and China. We also operate 17 Polyurethanes formulation facilities, which are located in close proximity to our customers worldwide.
Our customers produce polyurethane products through the combination of an isocyanate, such as MDI or TDI, with polyols, which are derived largely from PO and EO. While the range of TDI-based products is relatively limited, we are able to produce over 2,000 distinct MDI-based polyurethane products by modifying the MDI molecule through varying the proportion and type of polyol used and by introducing other chemical additives to our MDI formulations. As a result, polyurethane products, especially those derived from MDI, are continuing to replace traditional products in a wide range of end use markets, including insulation in construction and appliances, cushioning for automotive and furniture, adhesives, wood binders, footwear and other specialized engineering applications.
We are one of three North American producers of PO. We and some of our customers process PO into derivative products, such as polyols for polyurethane products, PG and various other chemical products. End uses for these derivative products include applications in the home furnishings, construction, appliances, packaging, automotive and transportation, food, paints and coatings and cleaning products industries. We also produce MTBE as a co-product of our PO manufacturing process. MTBE is an oxygenate that is blended with gasoline to reduce harmful vehicle emissions and to enhance the octane rating of gasoline. See "Risk Factors."
In 1992, we were the first global supplier of polyurethane chemicals to open a technical service center in China. We have since expanded this facility to include an integrated polyurethanes formulation facility. In January 2003, we entered into two related joint ventures to build MDI production and finishing facilities near Shanghai, China. Production at our MDI finishing plant near Shanghai, China operated by HPS, a consolidated joint venture, was commissioned on June 30, 2006. Production at the MNB, aniline and crude MDI plants operated by SLIC, an unconsolidated joint venture, commenced on September 30, 2006. These world-scale facilities strengthen our ability to service our customers in the critical Chinese market and will support the significant demand growth that we believe this region will continue to experience. Additionally, in November 2012, we entered into an agreement to form a joint venture to build a world scale PO and MTBE plant in Nanjing, China. The facility is expected to be completed by the end of 2014, and it will utilize our proprietary PO/MTBE manufacturing technology. We will own a 49% interest in the joint venture.
During 2012, our Polyurethanes segment implemented a restructuring program to reduce annualized fixed costs by $75 million by the third quarter of 2013. In connection with this program, we recorded restructuring expenses of $38 million during 2012 primarily for workforce reductions.
Products and Markets
MDI is used primarily in rigid foam applications and in a wide variety of customized, higher-value flexible foam and coatings, adhesives, sealants and elastomers. Polyols, including polyether and polyester polyols, are used in conjunction with MDI and TDI in rigid foam, flexible foam and other
77
non-foam applications. PO is one of the principal raw materials for producing polyether polyols. The following chart illustrates the range of product types and end uses for polyurethane chemicals.
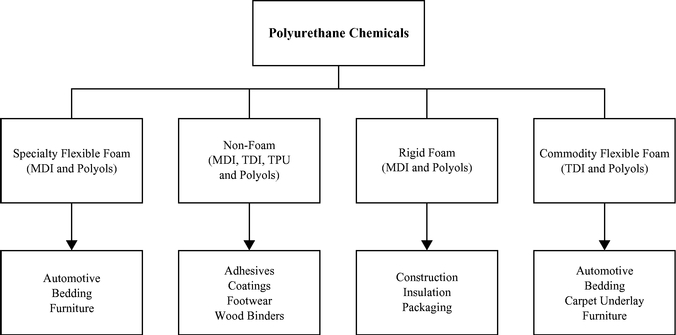
Polyurethane chemicals are sold to customers who combine the chemicals to produce polyurethane products. Depending on their needs, customers will use either commodity polyurethane chemicals produced for mass sales or polyurethane systems tailored for their specific requirements. By varying the blend, additives and specifications of the polyurethane chemicals, manufacturers are able to develop and produce a breadth and variety of polyurethane products.
MDI. MDI has a substantially larger market size and a higher growth rate than TDI. This is primarily because MDI can be used to make polyurethanes with a broader range of properties and can therefore be used in a wider range of applications than TDI. We believe that future growth of MDI is expected to be driven by the continued substitution of MDI-based polyurethane for fiberglass and other materials currently used in rigid insulation foam for construction. We expect that other markets, such as binders for reconstituted wood board products, specialty cushioning applications and coatings will further contribute to the continued growth of MDI.
With the recent rapid growth of the developing Asian economies, the Asian markets have now become the largest market for MDI.
TPU. TPU is a high-quality, fully formulated thermal plastic derived from the reaction of MDI or an aliphatic isocyanate with polyols to produce unique qualities such as durability, flexibility, strength, abrasion-resistance, shock absorbency and chemical resistance. We can tailor the performance characteristics of TPU to meet the specific requirements of our customers. TPU is used in injection molding and small components for the automotive and footwear industries. It is also extruded into films, wires and cables for use in a wide variety of applications in the coatings, adhesives, sealants and elastomers markets.
Polyols. Polyols are combined with MDI, TDI and other isocyanates to create a broad spectrum of polyurethane products. Demand for specialty polyols has been growing at approximately the same rate at which MDI consumption has grown.
Aniline. Aniline is an intermediate chemical used primarily to manufacture MDI. Generally, aniline is either consumed internally by the producers of the aniline or is sold to third parties under
78
long-term supply contracts. We believe that the lack of a significant spot market for aniline means that in order to remain competitive, MDI manufacturers must either be integrated with an aniline manufacturing facility or have a long-term, cost-competitive aniline supply contract.
PO. PO is an intermediate chemical used mainly to produce a wide range of polyols and PG. Demand for PO depends largely on overall economic demand, especially that of consumer durables. The following chart illustrates the primary end markets and applications for PO.
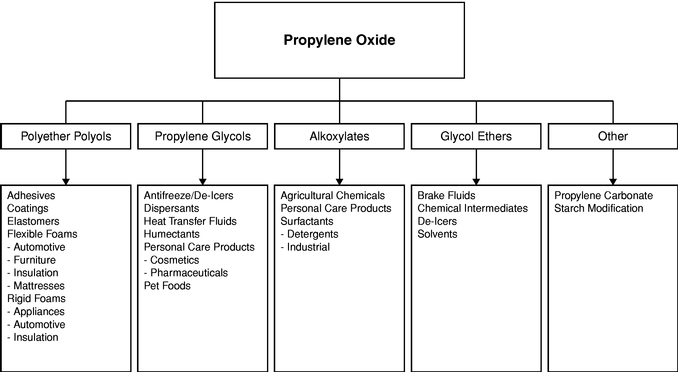
MTBE. MTBE is an oxygenate that is blended with gasoline to reduce harmful vehicle emissions and to enhance the octane rating of gasoline. While MTBE has been effectively eliminated in the United States, demand continues to grow in other regions of the world. In 2011 we announced the signing of a license agreement with Chinese chemicals manufacturer Yantai Wanhua Polyurethanes Co., Ltd, for the production of PO and MTBE. See "Risk Factors." We continue to sell MTBE for use as a gasoline additive, substantially all of which is sold for use outside the U.S. See "—Manufacturing and Operations" below and "Management's Discussion and Analysis of Financial Condition and Results of Operations."
Sales and Marketing
Our global sales group markets our polyurethane chemicals to over 3,500 customers in more than 90 countries. Our sales and technical resources are organized to support major regional markets, as well as key end use markets which require a more global approach. These key end use markets include the appliance, automotive, footwear, furniture and coatings, construction products, adhesives, sealants and elastomers industries.
We provide a wide variety of polyurethane solutions as components (i.e., the isocyanate or the polyol) or in the form of "systems" in which we provide the total isocyanate and polyol formulation to our customers in ready-to-use form. Our ability to deliver a range of polyurethane solutions and technical support tailored to meet our customers' needs is critical to our long-term success. We have strategically located our polyurethane formulation facilities, commonly referred to in the chemicals industry as "systems houses," close to our customers, enabling us to focus on customer support and
79
technical service. We believe this customer support and technical service system contributes to customer retention and also provides opportunities for identifying further product and service needs of customers. We manufacture polyols primarily to support our MDI customers' requirements.
We believe that the extensive market knowledge and industry experience of our sales teams and technical experts, in combination with our strong emphasis on customer relationships, have facilitated our ability to establish and maintain long-term customer supply positions. Our strategy is to continue to increase sales to existing customers and to attract new customers by providing innovative solutions, quality products, reliable supply, competitive prices and superior customer service.
Manufacturing and Operations
Our MDI production facilities are located in Geismar, Louisiana; Rozenburg, The Netherlands; and through our joint ventures in Caojing, China. These facilities receive aniline, which is a primary material used in the production of MDI, from our facilities located in Geismar, Louisiana; Wilton, U.K.; and Caojing, China. We believe that this relative scale and product integration of our large facilities provide a significant competitive advantage over other producers. In addition to reducing transportation costs for our raw materials, integration helps reduce our exposure to cyclical prices.
The following table sets forth the annual production capacity of polyurethane chemicals at each of our polyurethanes facilities:
| |
MDI | Polyols | TPU | Aniline | Nitrobenzene | PO | PG | MTBE | |||||||||||||||||
|---|---|---|---|---|---|---|---|---|---|---|---|---|---|---|---|---|---|---|---|---|---|---|---|---|---|
| |
(millions of pounds) |
(millions of gallons) |
|||||||||||||||||||||||
Geismar, Louisiana |
990 | 160 | 715 | (2) | 953 | (2) | |||||||||||||||||||
Osnabrück, Germany |
26 | 59 | |||||||||||||||||||||||
Port Neches, Texas |
525 | 145 | 260 | ||||||||||||||||||||||
Ringwood, Illinois |
20 | ||||||||||||||||||||||||
Caojing, China |
330 | (1) | |||||||||||||||||||||||
Rozenburg, The Netherlands |
880 | 130 | |||||||||||||||||||||||
Wilton, U.K. |
715 | 953 | |||||||||||||||||||||||
Total |
2,200 | 316 | 79 | 1,430 | 1,906 | 525 | 145 | 260 | |||||||||||||||||
At both our Geismar and Rozenburg facilities we utilize sophisticated proprietary technology to produce our MDI. This technology, which is also used in our Chinese joint venture, contributes to our position as a low cost MDI producer. In addition to MDI, we use a proprietary manufacturing process to manufacture PO. We own or license all technology and know-how developed and utilized at our PO facility. Our process combines isobutane and oxygen in proprietary oxidation (peroxidation) reactors, thereby forming TBHP and TBA, which are further processed into PO and MTBE, respectively. Because our PO production process is less expensive relative to other technologies and allows all of our PO co-products to be processed into saleable or useable materials, we believe that our PO production technology possesses several distinct advantages over its alternatives.
We operate polyurethane systems houses in Buenos Aires, Argentina; Deer Park, Australia; Taboão da Serra, Brazil; Shanghai, China; Cartagena, Colombia; Deggendorf, Germany; Osnabrück, Germany; Pune, India; Gandaria, Jakarta, Indonesia; Ternate, Italy; Tlalnepantla, Mexico; Mississauga, Ontario; Obninsk, Russia; Dammam, Saudi Arabia; Kuan Yin, Taiwan; Samutprakarn, Thailand; and Istanbul, Turkey.
80
In July 2012, we completed our acquisition of the remaining 55% ownership interest in International Polyurethane Investments B.V. (the "Russian Systems House Acquisition"). This company's wholly-owned subsidiary, Huntsman NMG ZAO, is a leading supplier of polyurethane systems to the adhesives, coatings and footwear markets in Russia, Ukraine and Belarus and is headquartered in Obninsk, Russia.
Joint Ventures
Rubicon Joint Venture. Chemtura Corporation is our joint venture partner in Rubicon LLC, which owns aniline, nitrobenzene and DPA manufacturing facilities in Geismar, Louisiana. We are entitled to approximately 78% of the nitrobenzene and aniline production capacity of Rubicon LLC, and Chemtura Corporation is entitled to 100% of the DPA production. In addition to operating the joint venture's aniline, nitrobenzene and DPA facilities, Rubicon LLC also operates our wholly owned MDI, polyol and Maleic Anhydride facilities at Geismar and is responsible for providing other auxiliary services to the entire Geismar complex. As a result of this joint venture, we are able to achieve greater scale and lower costs for our products than we would otherwise have been able to obtain. Rubicon LLC is consolidated in our financial statements.
Chinese MDI Joint Ventures. We are involved in two related joint ventures which operate MDI production facilities near Shanghai, China. SLIC, our manufacturing joint venture with BASF and three Chinese chemical companies, produces MNB, aniline and crude MDI. We effectively own 35% of SLIC and account for our investment under the equity method. HPS, our splitting joint venture with Shanghai Chlor-Alkali Chemical Company, Ltd, manufactures pure MDI, polymeric MDI and MDI variants. We own 70% of HPS and it is a consolidated affiliate. These projects have been funded by a combination of equity invested by the joint venture partners and borrowed funds. The total production capacity of the SLIC facilities is 660 million pounds per year of MDI and the splitting capacity of the HPS facility is 339 million pounds per year of MDI.
Chinese PO/MTBE Joint Venture. On November 13, 2012, we entered into an agreement to form a joint venture with Sinopec. The joint venture will involve the construction and operation of a PO/MTBE facility in China. Under the joint venture agreement, we will have a 49% interest in the joint venture and Sinopec will hold a 51% interest. Our equity investment is anticipated to be approximately $120 million, and we expect to receive significant license fees from the joint venture. The timing of equity contributions and license fee payments depends on various factors, but the majority are intended to be made over the course of the construction period of the plant (expected to be completed by the end of 2014).
Raw Materials
The primary raw materials for MDI-based polyurethane chemicals are benzene and PO. Benzene is a widely available commodity that is the primary feedstock for the production of MDI and aniline. Historically, benzene has been the largest component of our raw material costs. We purchase benzene from third parties to manufacture nitrobenzene and aniline, almost all of which we then use to produce MDI.
A major cost in the production of polyols is attributable to the costs of PO. The integration of our PO business with our polyurethane chemicals business gives us access to a competitively priced, strategic source of PO and the opportunity to develop polyols that enhance our range of MDI products. The primary raw materials used in our PO production process are butane/isobutane, propylene, methanol and oxygen. We purchase a large portion of our raw materials under long-term contracts.
81
Competition
Our major competitors in the polyurethane chemicals market include BASF, Bayer, Dow, Yantai Wanhua and LyondellBasell. While these competitors and others produce various types and quantities of polyurethane chemicals, we focus on MDI and MDI-based polyurethane systems. Our polyurethane chemicals business competes in two basic ways: (1) where price is the dominant element of competition, our polyurethane chemicals business differentiates itself by its high level of customer support, including cooperation on technical and safety matters; and (2) elsewhere, we compete on the basis of product performance and our ability to react quickly to changing customer needs and by providing customers with innovative solutions to their needs.
Some of our competitors in the Polyurethanes segment are among the world's largest chemical companies and major integrated petroleum companies. These competitors may have their own raw material resources. Some of these companies may be able to produce products more economically than we can. In addition, some of our competitors have greater financial resources, which may enable them to invest significant capital into their businesses, including expenditures for research and development. If any of our current or future competitors develop proprietary technology that enables them to produce products at a significantly lower cost, our technology could be rendered uneconomical or obsolete.
Performance Products
General
Our Performance Products segment has leading positions in the manufacture and sale of amines, surfactants and maleic anhydride and serves a wide variety of consumer and industrial end markets. We are organized by strategic business units ("SBUs") which differentiate between specialties and intermediates.
In our specialty SBUs (energy, materials, additives, processing chemicals and agrochemicals) we are a leading global producer of amines, carbonates, maleic anhydride and specialty surfactants. Growth in demand in our specialty markets tends to be driven by the end-performance characteristics that our products deliver to our customers. These products are manufactured for use in a growing number of niche industrial end uses and have been characterized by growing demand, technology substitution and stable profitability. For example, we are one of two significant global producers of polyetheramines, for which our sales volumes have grown at a compound annual rate of over 8% in the last 10 years due to strong demand in a number of industrial applications, such as epoxy curing agents, oil drilling, agrochemicals, fuel additives and civil construction materials. We are the leading global licensor of maleic anhydride manufacturing technology and are also the largest supplier of butane fixed bed catalyst used in the manufacture of maleic anhydride. Our licensing group also licenses technology on behalf of other Performance Products businesses and other segments.
In our intermediate SBUs we consume internally produced and third-party- sourced base petrochemicals in the manufacture of our surfactants, LAB, and ethanolamines products, which are primarily used in detergency, consumer products and industrial applications. We also produce EG, which is primarily used in the production of polyester fibers and PET packaging. We operate 19 Performance Products manufacturing facilities in North America, Europe, Middle East, India, Asia and Australia.
We have the annual capacity to produce approximately 1.4 billion pounds of more than 200 amines and other performance chemicals. We believe we are the largest global producer of polyetheramines, one of the largest producers of 2-(2-Amino ethoxy) Ethanol, sold under our DGA® brand, the second largest producer of ethyleneamines and morpholine and the second largest North American producer of ethanolamines. We are the only producer and largest supplier of propylene carbonate and ethylene
82
carbonate in North America. We also produce substituted propylamines. We use internally produced ethylene, EO, EG and PO in the manufacture of many of our amines, carbonates, and surfactants. Our products are manufactured at our Port Neches, Conroe, Dayton, and Freeport, Texas facilities and at our facilities in Llanelli, U.K.; Petfurdo, Hungary; Ankleshwar, India; Jurong Island, Singapore; and Jubail, Saudi Arabia. Our amines are used in a wide variety of consumer and industrial applications, including personal care products, polyurethane foam, fuel and lubricant additives, paints and coatings, composites, solvents and catalysts. Our key amines customers include AkzoNobel, Chevron, Dow, Ashland, Afton, Unilever, Monsanto and PPG.
We have the capacity to produce approximately 2.5 billion pounds of surfactant products annually at our nine facilities located in North America, Europe, India and Australia. We are a leading global manufacturer of nonionic, anionic, cationic and amphoteric surfactants products and are characterized by our breadth of product offering and market coverage. Our surfactant products are primarily used in consumer detergent and industrial cleaning applications. We are a leading European producer of components for powder and liquid laundry detergents and other cleaners. In addition, we manufacture and market a diversified range of mild surfactants and specialty formulations for use in personal care applications. We continue to strengthen and diversify our surfactant product offering into formulated specialty surfactant products for use in various industrial applications such as leather and textile treatment, foundry and construction, agrochemicals, fuels and lubricants, and polymers and coatings. We are growing our global agrochemical surfactant technology and product offerings. Our key surfactants customers include Sun Products, L'Oreal, Monsanto, Nufarm, Clorox, Henkel, Colgate, Procter & Gamble and Unilever.
We are North America's largest producer of LAB, with alkylation capacity of 400 million pounds per year at our plant in Chocolate Bayou, Texas. LAB is a surfactant intermediate which is converted into LAS, a major anionic surfactant used worldwide for the production of consumer, industrial and institutional laundry detergents. We also manufacture a higher-molecular-weight alkylate which is used as an additive to lubricants. Our key customers for LAB and specialty alkylates include Colgate, Lubrizol, Procter & Gamble, Unilever and Sun Products.
We believe we are the largest global producer of maleic anhydride, a highly versatile chemical intermediate that is used to produce UPRs, which are mainly used in the production of fiberglass reinforced resins for marine, automotive and construction products. Maleic anhydride is also used in the production of lubricants, food additives and artificial sweeteners. We have the capacity to produce approximately 572 million pounds annually at our facilities located in Pensacola, Florida; Geismar, Louisiana; and Moers, Germany. We also license our maleic anhydride technology and supply our catalysts to licensees and to worldwide merchant customers. As a result of our long-standing research and development efforts aided by our pilot and catalyst preparation plants, we have successfully introduced six generations of our maleic anhydride catalysts and now have a seventh generation catalyst commercially available. Revenue from licensing and catalyst comes from new plant commissioning, as well as current plant retrofits and catalyst change schedules. Our key maleic anhydride customers include AkzoNobel, Chevron Oronite, CCP Composites, Lubrizol, Infineum, Reichhold, Tate & Lyle, Cranston Print, and Gulf Bayport.
We also have the capacity to produce approximately 945 million pounds of EG annually at our facilities in Port Neches, Texas and Botany, Australia.
83
Products and Markets
Specialties. Our specialty SBUs are organized around the following end markets: energy, materials, additives, processing chemicals and agrochemicals. The following table shows the end-market applications specialty products:
Product Group
|
Applications | |
|---|---|---|
Specialty Amines |
liquid soaps, personal care, lubricant and fuel additives, polyurethane foams, fabric softeners, paints and coatings, refinery processing, water treating | |
Polyetheramines |
polyurethane foams and insulation, construction and flooring, paints and coatings, lubricant and fuel additives, adhesives, epoxy composites, agrochemicals, oilfield chemicals, printing inks, pigment dispersion |
|
Ethyleneamines |
lubricant and fuel additives, epoxy hardeners, wet strength resins, chelating agents, fungicides |
|
Ethanolamines |
wood preservatives, herbicides, construction products, gas treatment, metalworking |
|
Morpholine/DGA® agent and Gas Treating |
hydrocarbon processing, construction chemicals, synthetic rubber, water treating, electronics applications, gas treatment, agriculture |
|
Maleic anhydride |
boat hulls, automotive, construction, lubricant and fuel additives, countertops, agrochemicals, paper, and food additives |
|
Maleic Anhydride catalyst and technology licensing |
maleic anhydride, BDO and its derivatives, and PBT manufacturers |
|
Specialty Surfactants |
agricultural herbicides, construction, paper de-inking, lubricants |
|
Specialty Alkylates |
lubricant additive |
Amines. Amines broadly refers to the family of intermediate chemicals that are produced by reacting ammonia with various ethylene and propylene derivatives. Generally, amines are valued for their properties as a reactive agent, emulsifier, dispersant, detergent, solvent or corrosion inhibitor. Growth in demand for amines is highly correlated with GDP growth due to its strong links to general industrial and consumer products markets. However, certain segments of the amines market, such as polyetheramines, have grown at rates well in excess of GDP growth due to new product development, technical innovation, and substitution and replacement of competing products. For example, polyetheramines are used by customers who demand increasingly sophisticated performance characteristics as an additive in the manufacture of highly customized epoxy formulations, enabling customers to penetrate new markets and substitute for traditional curing materials. Ethanolamines are a range of chemicals produced by the reaction of EO with ammonia. They are used in the production of a variety of industrial, agricultural and consumer products. There are a limited number of competitors due to the technical and cost barriers to entry. As amines are generally sold based upon the performance characteristics that they provide to customer-specific end use application, pricing does not generally fluctuate directly with movements in underlying raw materials.
Morpholine/DGA® Agent. Morpholine and DGA® agent are produced as co-products by reacting ammonia with DEG. Morpholine is used in a number of niche industrial applications including rubber
84
curing (as an accelerator) and flocculants for water treatment. DGA® agent is primarily used in gas treating, electronics, herbicides and metalworking end use applications.
Carbonates. Ethylene and propylene carbonates are manufactured by reacting EO and PO with carbon dioxide. Carbonates are used as solvents and as reactive diluents in polymer and coating applications. They are also increasingly being used as a photo-resist solvent in the manufacture of printed circuit boards, solar panels, LCD screens and the production of lithium batteries.
Maleic Anhydride and Licensing Maleic anhydride is a chemical intermediate that is produced by oxidizing either benzene or normal butane through the use of a catalyst. The largest use of maleic anhydride in the U.S. is in the production of UPRs, which we believe account for approximately 48% of North American maleic anhydride demand. UPR is the main ingredient in fiberglass reinforced resins, which are used for marine and automotive applications and commercial and residential construction products.
Our maleic anhydride technology is a proprietary fixed bed process with solvent recovery and is characterized by low butane consumption and an energy- efficient, high-percentage solvent recovery system. This process competes against two other processes, the fluid bed process and the fixed bed process with water recovery. We believe that our process is superior in the areas of feedstock and energy efficiency and solvent recovery. The maleic anhydride-based route to BDO manufacture is currently the preferred process technology and is favored over the other routes, which include PO, butadiene and acetylene as feedstocks. As a result, the growth in demand for BDO has resulted in increased demand for our maleic anhydride technology and catalyst.
Total North American demand for maleic anhydride in 2012 was approximately 621 million pounds. Generally, changes in price have resulted from changes in industry capacity utilization as opposed to changes in underlying raw material costs.
Intermediates. The following table sets forth the end-market applications for our intermediate products:
Product Group
|
Applications | |
|---|---|---|
Surfactants |
||
Alkoxylates |
household detergents, industrial cleaners, anti-fog chemicals for glass, asphalt emulsions, shampoos, polymerization additives, de-emulsifiers for petroleum production | |
Sulfonates/Sulfates |
powdered detergents, liquid detergents, shampoos, body washes, dishwashing liquids, industrial cleaners, emulsion polymerization, concrete superplasticizers, gypsum wallboard |
|
Esters and Derivatives |
shampoo, body wash, textile and leather treatment |
|
Nitrogen Derivatives |
bleach thickeners, baby shampoo, fabric conditioners, other personal care products |
|
Formulated Blends |
household detergents, textile and leather treatment, personal care products, pharmaceutical intermediates |
|
EO/PO Block Co-Polymers |
automatic dishwasher detergents |
|
LAB |
consumer detergents, industrial and institutional detergents |
|
EG |
polyester fibers and PET bottle resins, heat transfer and hydraulic fluids, chemical intermediates, natural gas and hydrocarbon treating agents, unsaturated polyester resins, polyester polyols, plasticizers, solvents |
85
Surfactants. Surfactants or "surface active agents" are substances that combine a water soluble component with a water insoluble component in the same molecule. While surfactants are most commonly used for their detergency in cleaning applications, they are also valued for their emulsification, foaming, dispersing, penetrating and wetting properties in a variety of industries.
Demand growth for surfactants is relatively stable and exhibits little cyclicality. The main consumer product applications for surfactants can demand new formulations with improved performance characteristics, which affords considerable opportunity for innovative surfactants manufacturers like us to provide surfactants and blends with differentiated specifications and properties. For basic surfactants, pricing tends to have a strong relationship to underlying raw material prices and usually lags raw material price movements.
LAB. LAB is a surfactant intermediate which is produced through the reaction of benzene with either normal paraffins or linear alpha olefins. Nearly all the LAB produced globally is converted into LAS, a major anionic surfactant used worldwide for the production of consumer, industrial and institutional laundry detergents.
Three major manufacturers lead the traditional detergency market for LAB in North America: Procter & Gamble, Henkel and Sun Products. We believe that two-thirds of the LAB global capacity lies in the hands of ten producers, with three or four major producers in each of the three regional markets. Although the North American market for LAB is mature, we expect Latin American and other developing countries to grow as detergent demand grows at a faster rate than GDP. Growth in demand for specialty alkylates for use in lubricants is expected to be higher than GDP. We have developed a unique manufacturing capability for a high molecular weight alkylate for this market. With a significant technical barrier to entry, our specialty alkylate capability has allowed us greater diversity in our portfolio and strengthened our competitive position versus LAB-only producers.
EG. We consume our internally produced EO to produce three types of EG: MEG, DEG and TEG. MEG is consumed primarily in the polyester (fiber and bottle resin) and antifreeze end markets and is also used in a wide variety of industrial applications including synthetic lubricants, plasticizers, solvents and emulsifiers. DEG is consumed internally for the production of Morpholine and DGA® agent and polyols. TEG is used internally for the production of polyols and is sold into the market for dehydration of natural gas. We continue to optimize our EO and EG operations depending on the fundamental market demand for EG.
Sales and Marketing
We sell over 2,000 products to over 4,000 customers globally through our Performance Products marketing groups, which have extensive market knowledge, considerable chemical industry experience and well established customer relationships.
In our specialty markets (energy, materials, additives, processing chemicals and agrochemicals), our marketing efforts are focused on how our product offerings perform in certain customer applications. We believe that this approach enhances the value of our product offerings and creates opportunities for ongoing differentiation in our development activities with our customers.
Our intermediates are sold mainly into the global home and personal care market for which we have a dedicated marketing group. We also sell EG.
We also provide extensive pre- and post-sales technical service support to our customers where our technical service professionals work closely with our research and development functions to tailor our product offerings to meet our customers unique and changing requirements. Finally, these technical service professionals interact closely with our market managers and business leadership teams to help guide future offerings and market approach strategies. In addition to our focused direct sales efforts, we maintain an extensive global network of distributors and agents that also sell our products. These
86
distributors and agents typically promote our products to smaller end use customers who cannot be served cost effectively by our direct sales forces.
Manufacturing and Operations
Our Performance Products segment has the capacity to produce more than seven billion pounds annually of a wide variety of products and formulations at 19 manufacturing locations in North America, Europe, Africa, the Middle East ("EAME"), Asia and Australia. These production capacities are as follows:
| |
Current capacity | ||||||||||||
|---|---|---|---|---|---|---|---|---|---|---|---|---|---|
Product Area
|
North America |
EAME | APAC(1) | Total | |||||||||
| |
(millions of pounds) |
||||||||||||
Amines |
706 | 197 | (2) | 58 | 961 | ||||||||
Carbonates |
77 | 77 | |||||||||||
Surfactants |
648 | 1681 | 158 | 2487 | |||||||||
Maleic anhydride |
340 | 232 | (3) | 572 | |||||||||
EG |
890 | 55 | 945 | ||||||||||
EO |
1,000 | 100 | 1,100 | ||||||||||
Ethanolamines |
400 | 400 | |||||||||||
LAB |
400 | 400 | |||||||||||
Ethylene |
400 | 400 | |||||||||||
Propylene |
300 | 300 | |||||||||||
Our surfactants and amines facilities are located globally, with broad capabilities in amination, sulfonation and ethoxylation. These facilities have a competitive cost base and use modern manufacturing units that allow for flexibility in production capabilities and technical innovation.
Our primary ethylene, propylene, EO, EG and ethanolamines facilities are located in Port Neches, Texas alongside our Polyurethanes' PO/MTBE facility. The Port Neches, Texas facility benefits from extensive logistics infrastructure, which allows for efficient sourcing of other raw materials and distribution of finished products.
A number of our facilities are located within large integrated petrochemical manufacturing complexes. We believe this results in greater scale and lower costs for our products than we would be able to obtain if these facilities were stand-alone operations. These include our LAB facility in Chocolate Bayou, Texas, our maleic anhydride facilities in Pensacola, Florida and Moers, Germany and our Ethyleneamines facility in Freeport, Texas.
Joint Ventures
Ethyleneamines Joint Venture. Since July 1, 2010, we have consolidated the results of Arabian Amines Company, our 50%-owned joint venture with the Zamil Group. Arabian Amines Company operates an ethyleneamines manufacturing plant in Jubail, Saudi Arabia. The plant has an approximate annual capacity of 60 million pounds. We purchase and sell all of the production from this joint venture.
87
Maleic Anhydride Joint Venture. Since the second quarter of 2011, we have consolidated the results of Sasol-Huntsman, our 50%-owned maleic anhydride joint venture. This entity operates a manufacturing facility in Moers, Germany with the capacity to produce 232 million pounds of maleic anhydride. The output from the facility is sold in the European region.
Raw Materials
We have the capacity to produce 400 million pounds of ethylene and 300 million pounds of propylene, depending on feedstocks, at our Port Neches, Texas facility. All of the ethylene is used to produce EO and all of the propylene is used to produce PO at our Port Neches, Texas facility (primarily for our Polyurethanes business). We have the capacity to use approximately 900 million pounds of ethylene each year in the production of EO and ethyleneamines. Accordingly, we purchase or toll the remainder of our ethylene requirements from third parties. We consume all of our EO in the manufacture of our EG, surfactants, carbonates and amines products. We also use internally produced PO and DEG in the manufacture of these products.
In addition to internally produced raw materials, the main raw materials used in the production of our amines are ethylene dichloride, caustic soda, ammonia, hydrogen, methylamines and acrylonitrile. The majority of these raw materials are available from multiple sources in the merchant market at competitive prices.
In the production of surfactants and LAB, our primary raw materials, in addition to internally produced and third-party sourced EO and ethylene, are synthetic and natural alcohols, paraffin, alpha olefins, benzene and nonyl phenol. All of these raw materials are widely available in the merchant market at competitive prices.
Maleic anhydride is produced by the reaction of n-butane with oxygen using our proprietary catalyst. The principal raw material is n-butane which is purchased pursuant to long-term contracts and delivered to our Pensacola, Florida site by barge, to our facility in Geismar, Louisiana via pipeline and to our Moers, Germany site by railcar. Our maleic anhydride catalyst is toll-manufactured by a third party under a long-term contract according to our proprietary methods. These raw materials are available from multiple sources at competitive prices.
Competition
In our specialty markets, there are few competitors for many of our products due to the considerable customization of product formulations, the proprietary nature of many of our product applications and manufacturing processes and the relatively high research and development and technical costs involved. Some of our global competitors include BASF, Air Products, Dow, Tosoh and AkzoNobel. We compete primarily on the basis of product performance, new product innovation and, to a lesser extent, on the basis of price. In our maleic anhydride market, we compete primarily on the basis of price, customer service and plant location. Our competitors include Lanxess, Flint Hills Resources, Bartek and Ashland. We are the leading global producer of maleic anhydride catalyst. Competitors in our maleic anhydride catalyst market include Scientific Design, Ineos, BASF and Polynt. In our maleic anhydride technology licensing market, our primary competitor is Scientific Design. We compete primarily on the basis of technological performance and service.
There are numerous global producers of many of our intermediate products. Our main competitors include global companies such as Dow/MEGlobal, Sasol, BASF, Petresa, Clariant, Shell, Stepan, Croda and Kao, as well as various smaller or more local competitors. We compete on the basis of price with respect to the majority of our product offerings and, to a lesser degree, on the basis of product availability, performance and service with respect to certain of our more value-added products.
88
The market in which our Performance Products segment operates is highly competitive. Among our competitors are some of the world's largest chemical companies and major integrated petroleum companies that have their own raw material resources. Some of these companies may be able to produce products more economically than we can. In addition, some of our competitors have greater financial resources, which may enable them to invest significant capital into their businesses, including expenditures for research and development. If any of our current or future competitors develop proprietary technology that enables them to produce products at a significantly lower cost, our technology could be rendered uneconomical or obsolete.
Advanced Materials
General
Our Advanced Materials segment is a leading global manufacturer and marketer of technologically advanced epoxy, acrylic and polyurethane-based polymer products. We focus on formulations and systems that are used to address customer-specific needs in a wide variety of industrial and consumer applications. Our products are used either as replacements for traditional materials or in applications where traditional materials do not meet demanding engineering specifications. For example, structural adhesives are used to replace metal rivets and advanced composites are used to replace traditional aluminum panels in the manufacture of aerospace components. Our Advanced Materials segment is characterized by the breadth of our product offering, our expertise in complex chemistry, our long-standing relationships with our customers, our ability to develop and adapt our technology and our applications expertise for new markets and new applications.
We operate synthesis, formulating and production facilities in North America, Europe, Asia, South America and Africa. We sell to more than 3,000 customers in the following end markets: civil engineering, consumer appliances, food and beverage packaging, industrial appliances, consumer/do it yourself ("DIY"), aerospace, DVD, LNG transport, electrical power transmission and distribution, printed circuit boards, consumer and industrial electronics, wind power generation, automotive, recreational sports equipment and medical appliances.
During the fourth quarter of 2012, our Advanced Materials segment began implementing a global transformational change program, subject to consultation with relevant employee representatives, designed to improve the segment's manufacturing efficiencies, enhance commercial excellence and ensure its long-term global competitiveness and expects to improve its earnings in the range of $70 million by the middle of 2014. In connection with this global transformational change program, we recorded charges of $28 million related primarily to workforce reduction costs. We expect to record additional expenses related to this global transformational change program of approximately $19 million through the first half of 2014.
On November 1, 2011, we completed the sale of our stereolithography resin and Digitalis® machine manufacturing businesses to 3D Systems Corporation for $41 million in cash. The stereolithography business had revenues of $7 million in 2010 and its products are used primarily in three-dimensional part building systems. The Digitalis® business is a stereolithography rapid manufacturing system previously under development by our Advanced Materials business.
Products and Markets
Our product range spans from basic liquid and solid resins, to specialty components like curing agents, matting agents, accelerators, cross-linkers, reactive diluents, thermoplastic polyamides and additives. In addition to these components, which we typically sell to formulators in various industries, we also produce and sell ready to use formulated polymer systems.
89
Base Resins and Specialty Component Markets. Our products are used in the formulation of products for the protection of steel and concrete substrates, such as flooring, metal furniture and appliances, buildings, linings for storage tanks and food and beverage cans, and the primer coat of automobile bodies and ships. Epoxy-based surface coatings are among the most widely used industrial coatings due to their structural stability and broad application functionality combined with overall economic efficiency.
Base resins and specialty components are also used for composite applications. A structural composite is made by combining two or more different materials, such as fibers, resins and other specialty additives, to create a product with enhanced structural properties. Specifically, structural composites are lightweight, high-strength, rigid materials with high resistance to chemicals, moisture and high temperatures. Our product range comprises basic and advanced epoxy resins, curing agents and other advanced chemicals, additives and formulated polymer systems. The four key target markets for our structural composites are aerospace, windmill blades for wind power generation, general industrial and automotive applications, and recreational products (mainly sports equipment such as skis). Structural composites continue to substitute for traditional materials, such as metals and wood, in a wide variety of applications due to their light weight, strength and durability.
Formulated Systems. The structural adhesives market requires high-strength "engineering" adhesives for use in the manufacture and repair of items to bond various engineering substrates. Our business focus is on engineering adhesives based on epoxy, polyurethane, acrylic and other technologies which are used to bond materials, such as steel, aluminum, engineering plastics and composites in substitution of traditional joining techniques. Our Araldite® brand name has considerable value in the industrial and consumer adhesives markets. In many countries, Araldite® branded products are known for their high-performance adhesive capabilities, and we generally believe that this is the value-added segment of the market where recognition of our long-standing Araldite® brand is a key competitive advantage. Packaging is a key characteristic of our adhesives products. Our range of adhesives is sold in a variety of packs and sizes, targeted to three specific end markets and sold through targeted routes to market:
Our electrical materials are formulated polymer systems, which make up the insulation materials used in equipment for the generation, transmission and distribution of electrical power, such as transformers, switch gears, ignition coils, sensors, motors and magnets, and for the protection of electrical and electronic devices and components. The purpose of these products is to insulate, protect or shield either the environment from electrical current or electrical devices from the environment, such as temperature or humidity. Our electrical insulating materials target two key market segments: the heavy electrical equipment market and the light electrical equipment market.
90
Products for the heavy electrical equipment market segment are used in power plant components, devices for power grids and insulating parts and components. In addition, there are numerous devices, such as motors and magnetic coils used in trains and medical equipment, which are manufactured using epoxy and related technologies. Products for the light electrical equipment market segment are used in applications such as industrial automation and control, consumer electronics, automotive electronics and electrical components. The end customers in the electrical insulating materials market encompass the relevant original equipment manufacturer ("OEM") as well as numerous manufacturers of components used in the final products. We also develop, manufacture and market materials used in the production of printed circuit boards. Our products are ultimately used in industries ranging from telecommunications and personal computer mother board manufacture to automotive electronic systems manufacture. Soldermasks are our most important product line in printed circuit board technologies. Sales are made mainly under the Probimer®, Probimage® and Probelec® trademarks. Our Probimer® trademark is a widely recognized brand name for soldermasks.
Sales and Marketing
We maintain multiple routes to market to service our diverse customer base. These routes to market range from using our own direct sales force for targeted, technically-oriented distribution to mass general distribution. Our direct sales force focuses on engineering solutions for decision-makers at major customers who purchase significant amounts of product from us. We use technically-oriented specialist distributors to augment our sales effort in niche markets and applications where we do not believe it is appropriate to develop direct sales resources. We use mass general distribution channels to sell our products into a wide range of general applications where technical expertise is less important to the user of the products to reduce our overall selling expenses. We believe our use of multiple routes to market enables us to reach a broader customer base at an efficient cost.
We conduct sales activities through dedicated regional sales teams in the Americas, Europe, India, Middle East, Africa and Asia. Our global customers are covered by key account managers who are familiar with the specific requirements of these clients. The management of long-standing customer relationships is at the heart of the sales and marketing process. We are also supported by a strong network of distributors. We serve a highly fragmented customer base.
For our consumer/DIY range, we have entered into exclusive branding and distribution arrangements with, for example, Selleys in Australia. Under these arrangements, our distribution partners fund advertising and sales promotions, negotiate and sell to major retail chains, own inventories and provide store deliveries (and sometimes shelf merchandising) in exchange for a reliable, high-quality supply of Araldite® branded, ready-to-sell packaged products.
Manufacturing and Operations
We are a global business serving customers in four principal geographic regions: Europe, India, Middle East & Africa, the Americas, and Asia. To service our customers efficiently, we maintain manufacturing plants around the world with a strategy of global, regional and local manufacturing
91
employed to optimize the level of service and minimize the cost to our customers. The following table summarizes the plants that we operate:
Location
|
Description of Facility | |
|---|---|---|
| Bad Saeckingen, Germany | Formulating Facility | |
| Bergkamen, Germany | Synthesis Facility | |
| Chennai, India(1)(2) | Resins and Synthesis Facility | |
| Duxford, U.K. | Formulating Facility | |
| East Lansing, Michigan, U.S. | Formulating Facility | |
| Istanbul, Turkey(2) | Formulating Facility | |
| Los Angeles, California, U.S. | Formulating Facility | |
| McIntosh, Alabama, U.S. | Resins and Synthesis Facility | |
| Monthey, Switzerland | Resins and Synthesis Facility | |
| Nanjing, China(2) | Formulating Facility | |
| Pamplona, Spain | Resins and Synthesis Facility | |
| Panyu, China(2)(3) | Formulation and Synthesis Facility | |
| Sadat City, Egypt | Formulating Facility | |
| Taboão da Serra, Brazil | Formulating Facility |
Our facilities in Asia and India are well-positioned to take advantage of the market growth that is expected in these regions.
Raw Materials
The principal raw materials we purchase for the manufacture of basic and advanced epoxy resins are epichlorohydrin, bisphenol A and BLR. We also purchase amines, polyols, isocyanates, acrylic materials, hardeners and fillers for the production of our formulated polymer systems and complex chemicals and additives. Raw material costs constitute a sizeable percentage of sales for certain applications. We have supply contracts with a number of suppliers. The terms of our supply contracts vary, but, in general, these contracts contain provisions that set forth the quantities of product to be supplied and purchased and formula-based pricing.
Additionally, we produce some of our most important raw materials, such as BLR and its basic derivatives, which are the basic building blocks of many of our products. We are among the world's larger producers of BLR. Approximately 50% of the BLR we produce is consumed in the production of our formulated polymer systems. The balance of our BLR is sold as liquid or solid resin in the merchant market, allowing us to increase the utilization of our production plants and lower our overall BLR production cost. We believe that manufacturing a substantial proportion of our principal raw material gives us a competitive advantage over other epoxy-based polymer systems formulators, most of whom must buy BLR from third-party suppliers. This position helps protect us from pricing pressure from BLR suppliers and aids in providing us a stable supply of BLR in difficult market conditions.
We consume certain amines produced by our Performance Products segment and isocyanates produced by our Polyurethanes segment, which we use to formulate Advanced Materials products.
92
Competition
The market in which our Advanced Materials segment operates is highly competitive, and is dependent on significant capital investment, the development of proprietary technology, and maintenance of product research and development. Among our competitors are some of the world's largest chemical companies and major integrated companies that have their own raw material resources.
Competition in our basic liquid and solid epoxy resins group is primarily driven by price, and is increasingly more global with industry consolidation in the North American and European markets and the emergence of new competitors in Asia. Our major competitors include Dow, Momentive, BASF, Kukdo and NanYa.
Competition in our specialty components and structural composites product group is primarily driven by product performance, applications expertise and customer certification. Our competitive strengths include our strong technology base, broad range of value-added products, leading market positions, diverse customer base and reputation for customer service. Major competitors include Air Products, Arizona Chemical, Momentive, BASF, Cray Valley, Evonics, DIC, Dow, Mitsui, Sumitomo and NanYa.
Competition in our formulation product group is primarily based on technology, know-how, applications and formulations expertise, product reliability and performance, process expertise and technical support. This product group covers a wide range of industries and the key competition factors vary by industry. Our competitive strengths result from our focus on defined market needs, our long-standing customer relationships, product reliability and technical performance, provision of high level service and recognition as a quality supplier in our chosen sectors. We operate dedicated technology centers in Basel, Switzerland; The Woodlands, Texas; and Shanghai, China in support of our product and technology development. Our major competitors can be summarized as follows:
Formulation Product Group
|
Competition | |
|---|---|---|
| Adhesives applications | Henkel/Loctite, ITW, National Starch, Sika, 3M | |
| Electrical insulating materials | Altana, Momentive, Schenectady, Wuxi, Dexter-Hysol, Hitachi Chemical, Nagase Chemtex, Toshiba Chemical | |
| Printed circuit board materials | Coates, Goo, Peters, Taiyo Ink, Tamura | |
| Tooling and modeling solution. | Axson, DSM, Sika |
Textile Effects
General
Our Textile Effects segment is the leading global solutions provider for textile chemicals and dyes in our chosen markets. Our textile solutions enhance the color of finished textiles and improve such performance characteristics as wrinkle resistance and the ability to repel water and stains. Our Textile Effects segment is characterized by the breadth of our product offering, our long-standing relationships with our customers, our ability to develop and adapt our technology and our applications expertise for new markets and new applications.
We operate synthesis, formulating and production facilities in North America, Europe, Asia and South America. We market multiple products to customers in multiple end-markets, including the following: consumer fashion apparel, sportswear, career and uniform apparel, military, automotive, home textiles and furnishings, carpet and other functional textiles.
93
During 2011, our Textile Effects segment began implementing a significant restructuring program, including the closure of our production facilities and business support offices in Basel, Switzerland, as part of an ongoing strategic program aimed at improving the segment's long-term global competitiveness. In connection with this plan, during 2012, we recorded cash charges of $1 million for workforce reductions, $9 million for decommissioning and other restructuring expenses, and noncash charges of $11 million primarily for pension settlements. We expect to incur additional restructuring and plant closing charges of up to approximately $80 million through 2014 related to the closure of our production facilities and business support offices in Basel, Switzerland. In addition, during 2012, our Textile Effects segment recorded charges of $4 million, of which $2 million related to the closure of our St. Fons, France facility and $2 million related to a global transfer pricing initiative. We reversed charges of $16 million which were no longer required for workforce reductions at our production facility in Langweid, Germany, the simplification of the commercial organization and optimization of our distribution network, the consolidation of manufacturing activities and processes at our site in Basel, Switzerland and the closure of our production facilities in Basel, Switzerland.
Products and Markets
Textiles generally involve a complex matrix of fibers, effects and functionality, and the resulting products range from fashion apparel to bulletproof vests, home linens to carpet, and upholstery to automotive interiors. Our broad range of dyestuffs and chemicals enhance both the aesthetic appearance of these products and the functionality needed to ensure that they perform in their end-use markets. Since the requirements for these markets vary dramatically, our business strategy focuses on the two major markets—apparel and technical textiles. We work to provide the right balance of products and service to meet the technical challenges in each of these markets.
The apparel market, which also includes our home interiors products, focuses on products that provide an aesthetic effect and/or improve the processing efficiency within the textile mill. We offer a complete range of colors for cotton, polyester and nylon that cover the range of shades needed for sportswear, intimate apparel, towels, sheeting and casual wear. Our dyes have been developed to ensure that they offer the highest levels of wash fastness currently available in the market. Optical brighteners and other pretreatment products provide "bright white" effects for apparel, towels and sheeting. Pretreatment and dyeing auxiliaries ensure that these fabrics are processed efficiently and effectively—cleaning the fabrics with fewer chemicals, less energy and less water and thereby minimizing the environmental footprint and reducing the processing costs. Silicone softeners may be used to enhance the feel of products.
Technical textiles include automotive textiles, carpet, military fabrics, mattress ticking and nonwoven and other technical fabrics. Though the product groups may differ in their end-uses, the articles must provide a high-level of functionality and performance in their respective markets. High-lightfast dyes and UV absorbers are used in automotive interiors and outdoor furnishings to provide colors that don't fade when exposed to sunlight and heat. Powerful stain repellent and release technology imparts durable protection for upholstery, military and medical fabrics, without affecting the color, breathability or feel of the fabric. Specialized dyes and prints create unique camouflage patterns for military uniforms, backpacks and tarps that won't fade through wash and wear or during exposure to the elements.
Sales and Marketing
For our textile effects products, we focus on providing effect competence and process competence to our customers. Effect competence—delivering value- added effects to our customer's products—enables us to capitalize on new and innovative technologies and to assist our customers in their efforts to differentiate themselves from competitors. Process competence—applying know-how and expertise to
94
improve customers' processes—allows us to utilize our technical service to reduce cost and enhance efficiency.
Manufacturing and Operations
We are a global business serving customers in three principal geographic regions: EAME, the Americas and Asia. To service our customers efficiently, we maintain manufacturing plants around the world with a strategy of global, regional and local manufacturing employed to optimize the level of service and minimize the cost to our customers. The following table summarizes the plants that we operate:
Location
|
Description of Facility | |
|---|---|---|
| Atotonilquillo, Mexico | Textile Dyes and Chemicals Formulations Facility | |
| Baroda, India | Textile Dyes Facility and Chemicals Synthesis Facility | |
| Basel, Switzerland(1) | Textile Dyes Facility and Technology Center | |
| Bogota, Colombia(1) | Chemicals Formulations Facility | |
| Charlotte, North Carolina, U.S.(1) | Chemicals Formulations Facility | |
| Fraijanes, Guatemala(1) | Chemicals Formulations Facility | |
| Gandaria, Jakarta, Indonesia | Textile Dyes and Chemicals Formulations Facility | |
| Hangzhou, China(1) | Chemicals Formulations Facility | |
| Istanbul, Turkey(1) | Chemicals Formulations Facility | |
| Karachi, Pakistan(1) | Chemicals Formulations Facility | |
| Langweid am Leich, Germany(1) | Chemicals Synthesis Facility | |
| Panyu, China(1)(2) | Chemicals Synthesis Facility and Technology Center | |
| Qingdao, China | Textile Dyes Facility | |
| Samutsakorn (Mahachai), Thailand(1) | Textile Dyes and Chemicals Formulations Facility | |
| Taboão da Serra, Brazil(1) | Chemicals Formulations Facility |
Raw Materials
The manufacture of textile effects products requires a wide selection of raw materials (approximately 1,100 different chemicals), including amines, fluorochemicals and sulfones. No one raw material represents greater than 4% of our textile effects raw material expenditures. Raw material costs constitute a sizeable percentage of sales for certain applications. We have supply contracts with a number of suppliers. The terms of our supply contracts vary, but, in general, these contracts contain provisions that set forth the quantities of product to be supplied and purchased and formula-based pricing.
Competition
We are the leading global solutions provider for textile chemicals and dyes in our chosen markets. Competition within the textile chemicals and dyes markets is generally fragmented with few competitors who offer complete solutions for both markets. Our major competitors are Clariant, BASF, Kiri-Dystar and Longsheng. We believe that our competitive strengths include our product offering, which is characterized by its broad range; high quality; significant integration between products and service; reliable technical expertise; long-standing relationships with customers; and strong business infrastructure in Asia. We believe that we have more customer service capability and account management capability than any of our competitors worldwide.
95
Pigments
General
We are a global leader in the creation of titanium dioxide solutions. Titanium dioxide is a white inert pigment which provides whiteness, opacity and brightness to thousands of everyday items including paints, plastics, paper, inks, food and personal care products.
Expertise gained over 75 years combined with a pioneering spirit enable us to help our customers to succeed. We use our expertise in titanium dioxide to create solutions for our customers that can deliver much more than whiteness and opacity including freeing capacity, reducing energy use and enabling infrastructure to last longer. Our TIOXIDE® and DELTIO® brands are made in our seven manufacturing facilities around the globe and service over 1,200 customers in practically all industries and geographic regions. Our global manufacturing footprint allows us to service both the needs of local and global customers, including Ampacet, A. Schulman, AkzoNobel, BASF, Clariant, Jotun, PolyOne and PPG.
Our Pigments segment is focused on working with customers to create innovative solutions that will help them succeed and improving our competitive position.
Our award winning ALTIRIS® pigment can increase the solar reflective properties in a wide range of colored exterior coatings. Improving the solar reflectance of structures can reduce the surface and interior temperatures of buildings resulting in lower energy consumption within these structures. In addition, in 2012 we approved the investment of approximately $40 million at our Scarlino, Italy site to widen the range of feedstocks which the site could use and to produce value adding co-products, and in 2013 we expect to commission our new magnesium sulfate fertilizer manufacturing operation at our Calais, France site which will increase the efficiency, sustainability and cost effectiveness of the site.
Products and Markets
Historically, global titanium dioxide demand growth rates tend to closely track global GDP growth rates. However, this varies by region. Developed markets such as the U.S. and Western Europe exhibit higher absolute consumption but lower demand growth rates, while emerging markets such as Asia exhibit much higher demand growth rates. The titanium dioxide industry experiences some seasonality in its sales reflecting the high exposure to seasonal coatings end use markets. Coating sales generally peak during the spring and summer months in the northern hemisphere, resulting in greater sales volumes during the second and third quarters of the year.
There are two manufacturing processes for the production of titanium dioxide, the sulfate process and the chloride process. We currently believe that the chloride process accounts for approximately 55% of global production capacity. Most end use applications can use pigments produced by either process, although there are markets that need pigment from a specific manufacturing route—for example, the inks market requires sulfate and the automotive coatings market requires chloride. Regional markets typically favor products that are available locally.
Our Company is one of the five major producers of titanium dioxide. Beyond these producers, the titanium dioxide industry currently has a large number of small regional or local producers, especially in China. Titanium dioxide supply has historically kept pace with increases in demand as producers increased capacity through low cost incremental debottlenecks, efficiency improvements and, more recently, new capacity additions in China. During periods of low titanium dioxide demand, the industry experiences high stock levels and consequently reduces production to manage working capital. Pricing in the industry is driven primarily by supply/demand balance. Based upon current price levels and the long lead times for planning, governmental approvals and construction, we expect supply additions for the near term in line with historical demand growth.
96
Sales and Marketing
Approximately 85% of our titanium dioxide sales are made through our global sales and technical services network, enabling us to work closely with our customers. Our focused sales effort and local manufacturing presence have allowed us to achieve leading market shares in a number of the countries where we manufacture titanium dioxide.
In addition, we have focused on marketing products and services to higher growth and higher value applications. For example, we believe that our pigments business is well-positioned to benefit from growth sectors where customers needs are complex resulting in fewer companies having the capability to support them.
We focus much of our research and development on solutions to address significant emerging trends in the market. This is evidenced by our DELTIO® pigments range which helps our customers to liberate capacity, reduce energy, improve working environments and reduce waste.
Manufacturing and Operations
Our pigments business has seven manufacturing sites operating in seven countries with a total capacity of approximately 565,000 metric tons per year. Approximately 72% of our titanium dioxide capacity is located in Western Europe.
| |
Annual Capacity (metric tons) | |
|||||||||
|---|---|---|---|---|---|---|---|---|---|---|---|
Site
|
EAME | North America |
APAC | Process | |||||||
Greatham, U.K. |
150,000 | Chloride | |||||||||
Calais, France |
95,000 | Sulfate | |||||||||
Huelva, Spain |
80,000 | Sulfate | |||||||||
Scarlino, Italy |
80,000 | Sulfate | |||||||||
Umbogintwini, South Africa |
25,000 | Sulfate | |||||||||
Lake Charles, Louisiana(1) |
75,000 | Chloride | |||||||||
Teluk Kalung, Malaysia |
60,000 | Sulfate | |||||||||
Total |
430,000 | 75,000 | 60,000 | ||||||||
In 2013, we will commission our new magnesium sulfate fertilizer manufacturing operation at our plant in Calais, France. The new facility will enable the closure of part of our Calais effluent treatment plant, which is expected to increase the efficiency, sustainability and cost effectiveness of the entire Calais site. In 2012, we approved the investment of approximately $40 million at our Scarlino, Italy site to widen the range of feedstocks which the site could use and to produce additional value-add co-products.
Joint Venture
Louisiana Pigment Company, L.P. is our 50%-owned joint venture with Kronos. We share production offtake and operating costs of the plant with Kronos, though we market our share of the production independently. The operations of the joint venture are under the direction of a supervisory committee on which each partner has equal representation. Our investment in Louisiana Pigment Company, L.P. is accounted for using the equity method.
97
Raw Materials
The primary raw materials used to produce titanium dioxide are titanium bearing ores. Historically, we have purchased the majority of our ore under long-term supply contracts with a number of ore suppliers. The majority of titanium bearing ores are sourced from Australia, Africa and Canada. Ore accounts for approximately 55% of pigment variable manufacturing costs, while utilities (electricity, gas and steam), sulfuric acid and chlorine collectively account for approximately 25% of our variable manufacturing costs.
The world market for titanium bearing ores has a small number of large suppliers (Rio Tinto, Iluka and Tronox) which account for approximately 50% of global supply and from which we purchase approximately 60% of our needs. However, the choice of producers has increased in recent years with a number of emerging suppliers, and we have broadened our supply base by purchasing increasing amounts of our ores from these suppliers. The titanium-bearing ores market is in the process of moving from long-term supply contracts with pricing formulas to short-term contracts with market based prices. As a result of this shift we have seen a significant increase in our ore costs as our existing contracts expire. During 2012, we purchased approximately 50% of our ore under existing long-term contracts and the remainder under new contracts.
Titanium dioxide producers extract titanium from ores and process it into pigmentary titanium dioxide using either the chloride or sulfate process. Once an intermediate titanium dioxide pigment has been produced, it is "finished" into a product with specific performance characteristics for particular end-use applications. The finishing process is common to both the sulfate and chloride processes and is a major determinant of the final product's performance characteristics.
Co-products from both processes require treatment prior to disposal in order to comply with environmental regulations. In order to reduce our disposal costs and to increase our cost competitiveness, we have developed and marketed the co-products of our pigments business. We sell over 50% of the co-products generated by our business.
Competition
The global markets in which our pigments business operates are highly competitive. Competition is based on the basis of price, product quality and service. The major global producers against whom we compete are DuPont, Tronox, Kronos and Cristal, each of which has a global presence and the ability to service all global markets. Some of our competitors may be able to produce products more economically than we can. In addition, some of our competitors have greater financial resources, which may enable them to invest significant capital into their businesses, including expenditures for research and development. If any of our current or future competitors develops proprietary technology that enables them to produce products at a significantly lower cost, our technology could be rendered uneconomical or obsolete. Moreover, the sulphate based titanium dioxide technology used by our Pigments business is widely available. Accordingly, barriers to entry, apart from capital availability, may be low and the entrance of new competitors into the industry may reduce our ability to capture improving profit margins in circumstances where capacity utilization in the industry is increasing.
RESEARCH AND DEVELOPMENT
For the years ended December 31, 2012, 2011 and 2010, we spent $152 million, $166 million and $151 million, respectively, on research and development.
We support our business with a major commitment to research and development, technical services and process engineering improvement. Our research and development centers are located in The Woodlands, Texas; Everberg, Belgium; and Shanghai, China. Other regional development/technical service centers are located in Billingham, England (pigments); Auburn Hills, Michigan (polyurethanes
98
for the automotive industry); Derry, New Hampshire, Shanghai, China, Deggendorf, Germany and Ternate, Italy (polyurethanes); Melbourne, Australia (surfactants); Port Neches, Texas (process engineering support); Basel, Switzerland and Panyu, China (advanced materials and textile effects); and Mumbai, India (textile effects).
INTELLECTUAL PROPERTY RIGHTS
Proprietary protection of our processes, apparatuses, and other technology and inventions is important to our businesses. We own approximately 440 unexpired U.S. patents, approximately 160 patent applications (including provisionals) currently pending at the U.S. Patent and Trademark Office, and approximately 3,650 foreign counterparts, including both issued patents and pending patent applications. While a presumption of validity exists with respect to issued U.S. patents, we cannot assure that any of our patents will not be challenged, invalidated, circumvented or rendered unenforceable. Furthermore, we cannot assure the issuance of any pending patent application, or that if patents do issue, that these patents will provide meaningful protection against competitors or against competitive technologies. Additionally, our competitors or other third parties may obtain patents that restrict or preclude our ability to lawfully produce or sell our products in a competitive manner.
We also rely upon unpatented proprietary know-how and continuing technological innovation and other trade secrets to develop and maintain our competitive position. There can be no assurance, however, that confidentiality and other agreements into which we enter and have entered will not be breached, that they will provide meaningful protection for our trade secrets or proprietary know-how, or that adequate remedies will be available in the event of an unauthorized use or disclosure of such trade secrets and know-how. In addition, there can be no assurance that others will not obtain knowledge of these trade secrets through independent development or other access by legal means.
In addition to our own patents and patent applications and proprietary trade secrets and know-how, we are a party to certain licensing arrangements and other agreements authorizing us to use trade secrets, know-how and related technology and/or operate within the scope of certain patents owned by other entities. We also have licensed or sub-licensed intellectual property rights to third parties.
We have associated brand names with a number of our products, and we have approximately 134 U.S. trademark registrations (including applications for registration currently pending at the U.S. Patent and Trademark Office), and approximately 4,610 foreign counterparts, including both registrations and applications for registration. Some of these registrations and applications include filings under the Madrid system for the international registration of marks and may confer rights in multiple countries. However, there can be no assurance that the trademark registrations will provide meaningful protection against the use of similar trademarks by competitors, or that the value of our trademarks will not be diluted.
Because of the breadth and nature of our intellectual property rights and our business, we do not believe that any single intellectual property right (other than certain trademarks for which we intend to maintain the applicable registrations) is material to our business. Moreover, we do not believe that the termination of intellectual property rights expected to occur over the next several years, either individually or in the aggregate, will materially adversely affect our business, financial condition or results of operations.
EMPLOYEES
As of December 31, 2012, we employed approximately 12,000 people in our operations around the world. Approximately 2,000 of these employees are located in the U.S., while approximately 10,000 are located in other countries. We believe our relations with our employees are good.
99
GEOGRAPHIC DATA
For sales revenue and long-lived assets by geographic areas, see "Note 27. Operating Segment Information" to our audited consolidated financial statements.
ENVIRONMENTAL, HEALTH AND SAFETY MATTERS
General
We are subject to extensive federal, state, local and international laws, regulations, rules and ordinances relating to safety, pollution, protection of the environment, product management and distribution, and the generation, storage, handling, transportation, treatment, disposal and remediation of hazardous substances and waste materials. In the ordinary course of business, we are subject to frequent environmental inspections and monitoring and occasional investigations by governmental enforcement authorities. In addition, our production facilities require operating permits that are subject to renewal, modification and, in certain circumstances, revocation. Actual or alleged violations of safety laws, environmental laws or permit requirements could result in restrictions or prohibitions on plant operations or product distribution, substantial civil or criminal sanctions, as well as, under some environmental laws, the assessment of strict liability and/or joint and several liability. Moreover, changes in environmental regulations could inhibit or interrupt our operations, or require us to modify our facilities or operations. Accordingly, environmental or regulatory matters may cause us to incur significant unanticipated losses, costs or liabilities.
Environmental, Health and Safety Systems
We are committed to achieving and maintaining compliance with all applicable environmental, health and safety ("EHS") legal requirements, and we have developed policies and management systems that are intended to identify the multitude of EHS legal requirements applicable to our operations, enhance compliance with applicable legal requirements, ensure the safety of our employees, contractors, community neighbors and customers and minimize the production and emission of wastes and other pollutants. Although EHS legal requirements are constantly changing and are frequently difficult to comply with, these EHS management systems are designed to assist us in our compliance goals while also fostering efficiency and improvement and reducing overall risk to us.
EHS Capital Expenditures
We may incur future costs for capital improvements and general compliance under EHS laws, including costs to acquire, maintain and repair pollution control equipment. For the years ended December 31, 2012, 2011 and 2010, our capital expenditures for EHS matters totaled $105 million, $92 million, and $85 million, respectively. Because capital expenditures for these matters are subject to evolving regulatory requirements and depend, in part, on the timing, promulgation and enforcement of specific requirements, our capital expenditures for EHS matters have varied significantly from year to year and we cannot provide assurance that our recent expenditures are indicative of future amounts we may spend related to EHS and other applicable laws.
Remediation Liabilities
We have incurred, and we may in the future incur, liability to investigate and clean up waste or contamination at our current or former facilities or facilities operated by third parties at which we may have disposed of waste or other materials. Similarly, we may incur costs for the cleanup of waste that was disposed of prior to the purchase of our businesses. Under some circumstances, the scope of our liability may extend to damages to natural resources.
100
Under the Comprehensive Environmental Response, Compensation, and Liability Act ("CERCLA") and similar state laws, a current or former owner or operator of real property may be liable for remediation costs regardless of whether the release or disposal of hazardous substances was in compliance with law at the time it occurred, and a current owner or operator may be liable regardless of whether it owned or operated the facility at the time of the release. Outside the U.S., analogous contaminated property laws, such as those in effect in France and Australia, can hold past owners and/or operators liable for remediation at former facilities. Currently, there are approximately 10 former facilities or third-party sites in the U.S. for which we have been notified of potential claims against us for cleanup liabilities, including, but not limited to, sites listed under CERCLA. Based on current information and past experiences at other CERCLA sites, we do not expect these third-party claims to have a material impact on our consolidated financial statements.
One of these sites, the North Maybe Canyon Mine site, involves a former phosphorous mine near Soda Springs, Idaho, which is believed to have been operated by a predecessor company. In 2004, the U.S. Forest Service notified us that we are a CERCLA potentially responsible party ("PRP") for contaminated surface water at the site. In February 2010, we and Wells Cargo (another PRP) agreed to conduct a Remedial Investigation/Feasibility Study of a portion of the site and are currently engaged in that process. At this time, we are unable to reasonably estimate our potential liabilities at this site.
In addition, under the Resource Conservation and Recovery Act ("RCRA") and similar state laws, we may be required to remediate contamination originating from our properties as a condition to our hazardous waste permit. Some of our manufacturing sites have an extended history of industrial chemical manufacturing and use, including on-site waste disposal. We are aware of soil, groundwater or surface contamination from past operations at some of our sites, and we may find contamination at other sites in the future. For example, our Port Neches, Texas, and Geismar, Louisiana, facilities are the subject of ongoing remediation requirements imposed under RCRA. Similar laws exist in a number of locations in which we currently operate, or previously operated, manufacturing facilities, such as Australia, India, France, Hungary and Italy.
By letter dated March 7, 2006, our former Base Chemicals and Polymers facility in West Footscray, Australia, was issued a clean-up notice by the Environmental Protection Authority Victoria ("EPA Victoria") due to concerns about soil and groundwater contamination emanating from the site. On August 23, 2010, EPA Victoria revoked the second clean-up notice and issued a revised notice that included a requirement for financial assurance for the remediation. We have reached agreement with the agency that a mortgage on the land will be held by the agency as financial surety during the period covered by the current clean-up notice, which ends on July 30, 2014. As of December 31, 2012, we had an accrued liability of $29 million related to estimated environmental remediation costs at this site. We can provide no assurance that the agency will not seek to institute additional requirements for the site or that additional costs will not be associated with the clean up.
Environmental Reserves
We have accrued liabilities relating to anticipated environmental cleanup obligations, site reclamation and closure costs and known penalties. Liabilities are recorded when potential liabilities are either known or considered probable and can be reasonably estimated. Our liability estimates are calculated using present value techniques as appropriate and are based upon requirements placed upon us by regulators, available facts, existing technology and past experience. The environmental liabilities do not include amounts recorded as asset retirement obligations. We had accrued $34 million and $36 million for environmental liabilities as of December 31, 2012 and 2011, respectively. Of these amounts, $10 million and $7 million were classified as accrued liabilities in our consolidated balance sheets as of December 31, 2012 and 2011, respectively, and $24 million and $29 million were classified as other noncurrent liabilities in our consolidated balance sheets as of December 31, 2012 and 2011, respectively. In certain cases, our remediation liabilities may be payable over periods of up to 30 years.
101
We may incur losses for environmental remediation in excess of the amounts accrued; however, we are not able to estimate the amount or range of such potential excess.
REGULATORY DEVELOPMENTS
The EU regulatory framework for chemicals, called "REACH", became effective in 2007 and is designed to be phased in gradually over 11 years. As a REACH- regulated company that manufactures in or imports more than one metric ton per year of a chemical substance into the European Economic Area, we were required to pre-register with the European Chemicals Agency ("ECHA"), such chemical substances and isolated intermediates to take advantage of the 11 year phase-in period. To meet our compliance obligations, a cross- business REACH team was established, through which we were able to fulfill all required pre-registrations and our first phase registrations by the November 30, 2010 deadline. While we continue our registration efforts to meet the next registration deadline of May 31, 2013, our REACH implementation team is now strategically focused on the authorization phase of the REACH process, directing its efforts to address "Substances of Very High Concern" and evaluating potential business implications. Where warranted, evaluation of substitute chemicals will be an important element of our ongoing manufacturing sustainability efforts. As a chemical manufacturer with global operations, we are also actively monitoring and addressing analogous regulatory regimes being considered or implemented outside of the EU, for example, in Korea and Taiwan.
Although the total long-term cost for REACH compliance is unknown at this time, we spent approximately $8 million, $5 million and $9 million in 2012, 2011 and 2010, respectively, to meet the initial REACH requirements. We cannot provide assurance that these recent expenditures are indicative of future amounts that we may be required to spend for REACH compliance.
GREENHOUSE GAS REGULATION
Globally, our operations are increasingly subject to regulations that seek to reduce emissions of "greenhouse gases" ("GHGs"), such as carbon dioxide and methane, which may be contributing to changes in the Earth's climate. At the most recent negotiations of the Conference of the Parties to the Kyoto Protocol, a limited group of nations, including the European Union ("EU"), agreed to a second commitment period for the Kyoto Protocol, an international treaty that provides for reductions in GHG emissions. More significantly, the European Union GHG Emissions Trading System, established pursuant to the Kyoto Protocol to reduce GHG emissions in the EU, has just entered its third phase and ongoing reforms at the EU level—including measures to prop up carbon credit prices and ban the use of certain types of certified emission reductions—may increase our operating costs. Australia has also adopted a carbon trading system that has been recognized for formal linkage with the EU trading system by 2018. Australia's GHG cap-and-trade program may impose compliance obligations upon our operations that may increase our operating costs. In the United States, California has commenced the first compliance period of its cap-and-trade program.
Federal climate change legislation in the United States appears unlikely in the near-term. As a result, domestic efforts to curb GHG emissions will be led by the Environmental Protection Agency's (the "EPA") GHG regulations and the efforts of states. To the extent that our domestic operations are subject to the EPA's GHG regulations, we may face increased capital and operating costs associated with new or expanded facilities. Expansions of our existing facilities or construction of new facilities may be subject to the Clean Air Act's Prevention of Significant Deterioration requirements under the EPA's GHG "Tailoring Rule." Our facilities are also subject to the EPA's Mandatory Reporting of Greenhouse Gases rule, and the collection and reporting of GHG data may increase our operational costs.
Under a consent decree with states and environmental groups, the Environmental Protection Agency is due to propose new source performance standards (NSPS) for GHG emissions from
102
refineries. These standards could significantly increase the costs of constructing or adding capacity to refineries and may ultimately increase the costs or decrease the supply of refined products. Either of these events could have an adverse effect on our business.
We are already managing and reporting GHG emissions, to varying degrees, as required by law for our sites in locations subject to Kyoto Protocol obligations and/or EU emissions trading scheme requirements. Although these sites are subject to existing GHG legislation, few have experienced or anticipate significant cost increases as a result of these programs, although it is possible that GHG emission restrictions may increase over time. Potential consequences of such restrictions include capital requirements to modify assets to meet GHG emission restrictions and/or increases in energy costs above the level of general inflation, as well as direct compliance costs. Currently, however, it is not possible to estimate the likely financial impact of potential future regulation on any of our sites.
Finally, it should be noted that some scientists have concluded that increasing concentrations of GHG in the earth's atmosphere may produce climate changes that have significant physical effects, such as increased frequency and severity of storms, droughts, and floods and other climatic events. If any of those effects were to occur, they could have an adverse effect on our assets and operations.
PROPERTIES
We own or lease chemical manufacturing and research facilities in the locations indicated in the list below which we believe are adequate for our short-term and anticipated long-term needs. We own or lease office space and storage facilities throughout the U.S. and in many foreign countries. Our principal executive offices are located at 500 Huntsman Way, Salt Lake City, Utah 84108. The following is a list of our material owned or leased properties where manufacturing, research and main office facilities are located.
Location
|
Business Segment | Description of Facility | ||
|---|---|---|---|---|
| Salt Lake City, Utah(1) | Corporate and other | Executive Offices | ||
The Woodlands, Texas(1) |
Various |
Operating Headquarters, Global Technology Center |
||
Geismar, Louisiana(2) |
Polyurethanes and Performance Products |
MDI, Nitrobenzene(4), Aniline(4), Polyols and Maleic Anhydride Manufacturing Facilities and Polyurethanes Systems House |
||
Rozenburg, The Netherlands(1) |
Polyurethanes |
MDI Manufacturing Facility, Polyols Manufacturing Facilities and Polyurethanes Systems House |
||
Caojing, China |
Polyurethanes |
MDI Finishing Facilities, Global Technology Center |
||
Caojing, China(3) |
Polyurethanes |
Precursor MDI Manufacturing Facility |
||
Deer Park, Australia |
Polyurethanes |
Polyurethane Systems House |
||
Cartagena, Colombia |
Polyurethanes |
Polyurethane Systems House |
||
Deggendorf, Germany |
Polyurethanes |
Polyurethane Systems House |
||
Ternate, Italy |
Polyurethanes |
Polyurethane Systems House |
||
Shanghai, China(1) |
Polyurethanes |
Polyurethane Systems House, Global Technology Center |
||
Pune, India(1) |
Polyurethanes |
Polyurethane Systems House |
||
Buenos Aires, Argentina(1) |
Polyurethanes |
Polyurethane Systems House |
||
Samutprakarn, Thailand(1) |
Polyurethanes |
Polyurethane Systems House |
||
Istanbul, Turkey |
Polyurethanes |
Polyurethane Systems House |
103
Location
|
Business Segment | Description of Facility | ||
|---|---|---|---|---|
| Kuan Yin, Taiwan(1) | Polyurethanes | Polyurethane Systems House | ||
Tlalnepantla, Mexico |
Polyurethanes |
Polyurethane Systems House |
||
Mississauga, Ontario(1) |
Polyurethanes |
Polyurethane Systems House |
||
Obninsk, Russia |
Polyurethanes |
Polyurethane Systems House |
||
Dammam, Saudi Arabia(4) |
Polyurethanes |
Polyurethane Systems House |
||
Auburn Hills, Michigan(1) |
Polyurethanes |
Polyurethane Research Facility |
||
Everberg, Belgium |
Polyurethanes and Performance Products |
Polyurethane and Performance Products Regional Headquarters, Global Technology Center |
||
Derry, New Hampshire(1) |
Polyurethanes |
TPU Research Facility |
||
Ringwood, Illinois(1) |
Polyurethanes |
TPU Manufacturing Facility |
||
Osnabrück, Germany |
Polyurethanes |
TPU Manufacturing Facility and Polyurethane Systems House |
||
Wilton, U.K. |
Polyurethanes |
Aniline and Nitrobenzene Manufacturing Facilities |
||
Port Neches, Texas |
Polyurethanes and Performance Products |
Olefins, EO, EG, Surfactants, Amines and PO Manufacturing Facilities |
||
Conroe, Texas |
Performance Products |
Amines Manufacturing Facility |
||
Petfurdo, Hungary(1) |
Performance Products |
Amines Manufacturing Facility |
||
Llanelli, U.K. |
Performance Products |
Amines Manufacturing Facility |
||
Freeport, Texas(1) |
Performance Products |
Amines Manufacturing Facility |
||
Jurong Island, Singapore(1) |
Performance Products |
Amines Manufacturing Facility |
||
Jubail, Saudi Arabia(5) |
Performance Products |
Amines Manufacturing Facility |
||
Chocolate Bayou, Texas(1) |
Performance Products |
LAB Manufacturing Facility |
||
Pensacola, Florida(1) |
Performance Products |
Maleic Anhydride Manufacturing Facility |
||
Moers, Germany(6) |
Performance Products |
Maleic Anhydride Manufacturing Facility |
||
Dayton, Texas |
Performance Products |
Surfactant Manufacturing Facility |
||
Botany, Australia |
Performance Products |
Surfactant/EG Manufacturing Facility |
||
St. Mihiel, France |
Performance Products |
Surfactant Manufacturing Facility |
||
Lavera, France(1) |
Performance Products |
Surfactant Manufacturing Facility |
||
Castiglione, Italy |
Performance Products |
Surfactant Manufacturing Facility |
||
Ankleshwar, India(1) |
Performance Products |
Surfactant/Amines Manufacturing Facility |
||
Patrica/Frosinone, Italy |
Performance Products |
Surfactant Manufacturing Facility |
||
Barcelona, Spain(1) |
Performance Products |
Surfactant Manufacturing Facility |
||
Melbourne, Australia |
Performance Products |
Research Facility |
||
Bergkamen, Germany |
Advanced Materials |
Synthesis Facility |
||
Monthey, Switzerland |
Advanced Materials |
Resins and Synthesis Facility |
||
Pamplona, Spain |
Advanced Materials |
Resins and Synthesis Facility |
||
McIntosh, Alabama |
Advanced Materials |
Resins and Synthesis Facility |
||
Chennai, India(1)(7) |
Advanced Materials |
Resins and Synthesis Facility |
||
Bad Saeckingen, Germany |
Advanced Materials |
Formulating Facility |
104
Location
|
Business Segment | Description of Facility | ||
|---|---|---|---|---|
| Duxford, U.K. | Advanced Materials | Formulating Facility | ||
Sadat City, Egypt |
Advanced Materials |
Formulating Facility |
||
Taboão da Serra, Brazil |
Advanced Materials, Polyurethanes and Textile Effects |
Formulating Facility, Polyurethane Systems House and Chemicals Formulations Facility |
||
Panyu, China(1)(8) |
Advanced Materials and Textile Effects |
Formulating and Synthesis Facility and Technology Center |
||
Nanjing, China(1) |
Advanced Materials |
Formulating Facility |
||
East Lansing, Michigan |
Advanced Materials |
Formulating Facility |
||
Istanbul, Turkey(1) |
Advanced Materials |
Formulating Facility |
||
Los Angeles, California |
Advanced Materials |
Formulating Facility |
||
Basel, Switzerland(1) |
Advanced Materials and Textile Effects |
Technology Center and Textile Effects Textile Dyes Facility |
||
Langweid am Leich, Germany(1) |
Textile Effects |
Chemicals Synthesis Facility |
||
Charlotte, North Carolina(1) |
Textile Effects |
Chemicals Formulations Facility |
||
Samutsakorn (Mahachai), Thailand(1) |
Textile Effects |
Textiles Dyes and Chemicals Formulations Facility |
||
Atotonilquillo, Mexico |
Textile Effects |
Textile Dyes and Chemicals Formulations Facility |
||
Baroda, India |
Textile Effects |
Textile Dyes and Chemicals Synthesis Facility |
||
Gandaria, Jakarta, Indonesia |
Textile Effects and Polyurethanes |
Textile Dyes and Chemicals Formulations Facility and Polyurethane Systems House |
||
Qingdao, China |
Textile Effects |
Textile Dyes Facility |
||
Fraijanes, Guatemala(1) |
Textile Effects |
Chemicals Formulations Facility |
||
Bogota, Colombia(1) |
Textile Effects |
Chemicals Formulations Facility |
||
Hangzhou, China(1) |
Textile Effects |
Chemicals Formulations Facility |
||
Istanbul, Turkey(1) |
Textile Effects |
Chemicals Formulations Facility |
||
Karachi, Pakistan(1) |
Textile Effects |
Chemicals Formulations Facility |
||
Gateway, Singapore(1) |
Textile Effects and Performance Products |
Textile Effects Headquarters and Performance Products Regional Headquarters |
||
Greatham, U.K. |
Pigments |
Titanium Dioxide Manufacturing Facility |
||
Calais, France |
Pigments |
Titanium Dioxide Manufacturing Facility |
||
Huelva, Spain |
Pigments |
Titanium Dioxide Manufacturing Facility |
||
Scarlino, Italy |
Pigments |
Titanium Dioxide Manufacturing Facility |
||
Teluk Kalung, Malaysia |
Pigments |
Titanium Dioxide Manufacturing Facility |
||
Umbogintwini, South Africa |
Pigments |
Titanium Dioxide Manufacturing Facility |
||
Lake Charles, Louisiana(9) |
Pigments |
Titanium Dioxide Manufacturing Facility |
105
LEGAL PROCEEDINGS
Asbestos Litigation
We have been named as a "premises defendant" in a number of asbestos exposure cases, typically claims by nonemployees of exposure to asbestos while at a facility. In the past, these cases typically have involved multiple plaintiffs bringing actions against multiple defendants, and the complaints have not indicated which plaintiffs were making claims against which defendants, where or how the alleged injuries occurred or what injuries each plaintiff claimed. These facts, which would be central to any estimate of probable loss, generally have been learned only through discovery.
Where a claimant's alleged exposure occurred prior to our ownership of the relevant "premises," the prior owners generally have contractually agreed to retain liability for, and to indemnify us against, asbestos exposure claims. This indemnification is not subject to any time or dollar amount limitations. Upon service of a complaint in one of these cases, we tender it to the prior owner. Rarely do the complaints in these cases state the amount of damages being sought. The prior owner accepts responsibility for the conduct of the defense of the cases and payment of any amounts due to the claimants. In our nineteen-year experience with tendering these cases, we have not made any payment with respect to any tendered asbestos cases. We believe that the prior owners have the intention and ability to continue to honor their indemnity obligations, although we cannot assure you that they will continue to do so or that we will not be liable for these cases if they do not.
The following table presents for the periods indicated certain information about cases for which service has been received that we have tendered to the prior owner, all of which have been accepted.
| |
Year ended December 31, 2012 |
Year ended December 31, 2011 |
Year ended December 31, 2010 |
|||||||
|---|---|---|---|---|---|---|---|---|---|---|
Unresolved at beginning of period |
1,080 | 1,116 | 1,138 | |||||||
Tendered during period |
3 | 10 | 24 | |||||||
Resolved during period(1) |
3 | 46 | 46 | |||||||
Unresolved at end of period |
1,080 | 1,080 | 1,116 | |||||||
We have never made any payments with respect to these cases. As of December 31, 2012, we had an accrued liability of approximately $10 million relating to these cases and a corresponding receivable
106
of approximately $10 million relating to our indemnity protection with respect to these cases. We cannot assure you that our liability will not exceed our accruals or that our liability associated with these cases would not be material to our financial condition, results of operations or liquidity; accordingly, we are not able to estimate the amount or range of loss in excess of our accruals. Additional asbestos exposure claims may be made against us in the future, and such claims could be material. However, because we are not able to estimate the amount or range of losses associated with such claims, we have made no accruals with respect to unasserted asbestos exposure claims as of December 31, 2012.
Certain cases in which we are a premises defendant are not subject to indemnification by prior owners or operators. However, we may be entitled to insurance or other recoveries in some of these cases. The following table presents for the periods indicated certain information about these cases. Cases include all cases for which service has been received by us. Certain prior cases that were filed in error against us have been dismissed.
| |
Year ended December 31, 2012 |
Year ended December 31, 2011 |
Year ended December 31, 2010 |
|||||||
|---|---|---|---|---|---|---|---|---|---|---|
Unresolved at beginning of period |
36 | 37 | 39 | |||||||
Filed during period |
21 | 11 | 5 | |||||||
Resolved during period |
7 | 12 | 7 | |||||||
Unresolved at end of period |
50 | 36 | 37 | |||||||
We paid gross settlement costs for asbestos exposure cases that are not subject to indemnification of $559,000, $584,000 and $201,000 during the years ended December 31, 2012, 2011 and 2010, respectively. As of December 31, 2012, we had no accrual relating to these cases. We cannot assure you that our liability will not exceed our accruals or that our liability associated with these cases would not be material to our financial condition, results of operations or liquidity; accordingly, we are not able to estimate the amount or range of loss in excess of our accruals. Additional asbestos exposure claims may be made against us in the future, and such claims could be material. However, because we are not able to estimate the amount or range of losses associated with such claims, we have made no accruals with respect to unasserted asbestos exposure claims as of December 31, 2012.
Antitrust Matters
We have been named as a defendant in two class action civil antitrust suits filed on February 9 and 12, 2010 in the U.S. District Court for the District of Maryland alleging that we and our co-defendants and other co-conspirators conspired to fix prices of titanium dioxide sold in the U.S. between at least March 1, 2002 and the present. The suits were subsequently consolidated. The other defendants named in this matter are DuPont, Kronos and Millennium. On August 28, 2012, the court certified a class consisting of all U.S. customers who purchased titanium dioxide directly from defendants since February 1, 2003, and notice was given to putative class members the week of January 14, 2013 after the Court of Appeals for the Fourth Circuit denied our petition to appeal the order certifying the class. Trial is set to begin September 9, 2013.
The plaintiffs seek to recover on behalf of the class injunctive relief, treble damages, costs of suit and attorneys fees. We are not aware of any illegal conduct by us or any of our employees. Nevertheless, we have incurred costs relating to these claims and could incur additional costs in amounts material to us. Because of the overall complexity of these cases, we are unable to reasonably estimate any possible loss or range of loss with respect to these claims.
107
Indemnification Matter
On July 3, 2012, Deutsche Bank Securities Inc. and Credit Suisse Securities (USA) LLC (the "Banks") demanded that Huntsman Corporation indemnify them for claims brought by certain MatlinPatterson entities that were formerly our parent's shareholders (the "Plaintiffs") in litigation filed June 19, 2012 in the 9th District Court in Montgomery County, Texas. The Banks assert that they are entitled to indemnification pursuant to the Agreement of Compromise and Settlement between the Banks and our parent, dated June 22, 2009, wherein the Banks and our parent settled claims that we brought relating to the failed merger with Hexion Specialty Chemicals, Inc. ("Hexion"). Plaintiffs claim that the Banks knowingly made materially false representations about the nature of the financing for the acquisition of our parent by Hexion and that they suffered substantial losses to their 19 million shares of our parent's common stock as a result of the Banks' misrepresentations. Plaintiffs are asserting statutory fraud, common law fraud and aiding and abetting statutory fraud and are seeking actual damages, exemplary damages, costs and attorney's fees, pre-judgment and post-judgment interest. Our parent has denied the Banks' indemnification demand. On December 21, 2012, the court dismissed Plaintiffs' claims. Plaintiffs subsequently filed a motion for reconsideration and could still appeal the court's dismissal of their claims.
Environmental Enforcement Proceedings
On occasion, we receive notices of violation, enforcement or other complaints from regulatory agencies alleging noncompliance with applicable EHS laws. Based on currently available information and our past experience, we do not believe that the resolution of any pending or threatened environmental enforcement proceedings will have a material impact on our financial condition, results of operations or cash flows.
Port Neches Flaring Matter
As part of the EPA's national enforcement initiative on flaring operations and by letter dated October 12, 2012, the DOJ notified us that we were in violation of the CAA based on our response to a 2010 CAA Section 114 Information Request. The EPA has used the enforcement initiative to bring similar actions against refiners and other chemical manufacturers. Specifically, the EPA alleged violations of flare operations at our Port Neches, Texas facility from 2007-2012 that were not consistent with good pollution control practice and not in compliance with certain flare-related regulations. As a result of these findings, the EPA referred this matter to the DOJ. We have been engaged in discussions with the DOJ and the EPA regarding these violations and are in the process of reviewing their allegations and assessing their claims. We are currently unable to determine the likelihood or magnitude of potential penalty or injunctive relief that may be incurred in resolving this matter.
Other Proceedings
We are a party to various other proceedings instituted by private plaintiffs, governmental authorities and others arising under provisions of applicable laws, including various environmental, products liability and other laws. Except as otherwise disclosed in this report, we do not believe that the outcome of any of these matters will have a material effect on our financial condition, results of operations or liquidity.
AVAILABLE INFORMATION
We maintain an internet website at http://www.huntsman.com. Our annual reports on Form 10-K, quarterly reports on Form 10-Q, current reports on Form 8-K and amendments to these reports are available free of charge through our website as soon as reasonably practicable after we file this material
108
with the SEC. We also provide electronic or paper copies of our SEC filings free of charge upon request.
GLOSSARY OF CHEMICAL TERMS
DEG—di-ethylene
glycol
BDO—butane diol
DGA® Agent—DIGLYCOLAMINE® agent
EG—ethylene glycol
EO—ethylene oxide
LAB—linear alkyl benzene
LAS—linear alkylbenzene sulfonate
LER—liquid epoxy resins
LNG—liquefied natural gas
MEG—mono-ethylene glycol
MDI—methyl diphenyl diisocyanate
MTBE—methyl tertiary-butyl ether
PG—propylene glycol
PO—propylene oxide
Polyols—a substance containing several hydroxyl groups. A diol, triol and tetrol contain two, three and four hydroxyl groups, respectively.
TBA—tertiary butyl alcohol
TBHP—tert-butyl hydroperoxide
TDI—toluene diisocyanate
TEG—tri-ethylene glycol
TiO2—titanium dioxide pigment
TPU—thermoplastic polyurethane
UPR—unsaturated polyester resin
109
Following is information concerning the Board of Managers of Huntsman International LLC as of March 8, 2013. Given the significant influence of the management of Huntsman Corporation, our parent, on our business, also included below is information concerning the executive officers and Board of Directors of our parent, as of March 8, 2013. Unless the context otherwise requires, references in this management discussion to "we," "us," "our," or "our Company" refer to Huntsman International, together with its subsidiaries.
Board of Managers of Huntsman International LLC
The Board of Managers of our Company consists of Jon M. Huntsman, Peter R. Huntsman, J. Kimo Esplin and James R. Moore. The members of the Board of Managers of Huntsman International LLC are appointed by our parent as the sole owner of our membership interests and hold office until their successors are duly appointed and qualified. Information with respect to J. Kimo Esplin and James R. Moore is presented below under "—Executive Officers." Information with respect to Jon M. Huntsman and Peter R. Huntsman is presented below under "—Board of Directors of Huntsman Corporation."
Executive Officers
All of the following executive officers (in addition to Jon M. Huntsman and Peter R. Huntsman, information for each of whom is presented below under "—Board of Directors of Huntsman Corporation") serve at the pleasure of the board of directors of our parent.
J. Kimo Esplin, age 50, is a Manager of Huntsman International LLC and also serves as Executive Vice President and Chief Financial Officer. Mr. Esplin has served as Chief Financial Officer of all of the Huntsman companies since 1999. From 1994 to 1999, Mr. Esplin served as our Treasurer. Prior to joining Huntsman in 1994, Mr. Esplin was a Vice President in the Investment Banking Division of Bankers Trust Company, where he worked for seven years. Mr. Esplin also serves as a director of Nutraceutical International Corporation, a publicly traded nutrition supplements company.
James R. Moore, age 68, is a Manager of Huntsman International LLC and also serves as Executive Vice President, General Counsel and Secretary. Prior to his appointment to this position in January 2010, Mr. Moore served as our Vice President and Deputy General Counsel since 2003. Prior to that, Mr. Moore served as Vice President and Chief Environmental Counsel from 2002 to 2003 and Senior Environmental Counsel from 1998 to 2002. From 1989 until joining our Company in 1998, Mr. Moore was a partner at the Seattle law firm of Perkins Coie. Mr. Moore also previously served as a trial attorney with the U.S. Department of Justice, an assistant U.S. Attorney and Regional Counsel, Region 10, of the U.S. Environmental Protection Agency.
Anthony P. Hankins, age 55, is Division President, Polyurethanes and Chief Executive Officer, Asia-Pacific. Mr. Hankins was appointed to these positions in March 2004 and February 2011, respectively. From May 2003 to February 2004, Mr. Hankins served as President, Performance Products, from January 2002 to April 2003, he served as Global Vice President, Rigids Division for our Polyurethanes business, from October 2000 to December 2001, he served as Vice President—Americas for our Polyurethanes business, and from March 1998 to September 2000, he served as Vice President—Asia-Pacific for our Polyurethanes business. Mr. Hankins worked for ICI from 1980 to February 1998, when he joined our Company. At ICI, Mr. Hankins held numerous management positions in the plastics, fibers and polyurethanes businesses. He has extensive international experience, having held senior management positions in Europe, Asia and the U.S.
Paul G. Hulme, age 56, is Division President, Textile Effects. Mr. Hulme was appointed to this position in February 2009. From June 2003 to February 2009, Mr. Hulme served as Division President,
110
Materials and Effects. From February 2000 to May 2003, Mr. Hulme served as Vice President, Performance Chemicals, and from December 1999 to February 2000 he served as Operations Director, Polyurethanes. Prior to joining Huntsman in 1999, Mr. Hulme held various positions with ICI in finance, accounting and information systems roles. Mr. Hulme is a Chartered Accountant.
James H. Huntsman, age 42, is Division President, Advanced Materials. Mr. Huntsman was appointed to this position in July 2011. Prior to that time, Mr. Huntsman served as Vice President of Huntsman Advanced Materials, Americas Region since February 2009. From March 2006 to February 2009, Mr. Huntsman owned and managed a film production company based in Los Angeles, California. Prior to March 2006, he served as the Company's Vice President, U.S. Base Chemicals and Polymers. Mr. Huntsman originally joined the Company in 1990 and has held numerous manufacturing and commercial roles of increasing responsibility within a number of divisions. Mr. Huntsman is the son of our Executive Chairman, Jon M. Huntsman, the brother of our Chief Executive Officer, Peter R. Huntsman, and the brother of our director, Jon M. Huntsman, Jr.
Stewart A. Monteith, age 57, is Division President, Performance Products. Mr. Monteith was appointed to this position in February 2011. Prior to that time, Mr. Monteith served as Vice President of the Performance Specialties Unit, a position he held since August 2003. He also served as Vice President for Global Markets and Business Development. Mr. Monteith joined Huntsman in 1994. Prior to joining Huntsman, Mr. Monteith held various positions with Texaco Chemical Company and Union Carbide.
Simon Turner, age 49, is Division President, Pigments. Prior to his appointment to this position in November 2008, Mr. Turner served as Senior Vice President, Pigments since April 2008. From September 2004 to April 2008, Mr. Turner served as Vice President of Global Sales and from July 1999 to September 2004, he held positions including General Manager Co-Products and Director Supply Chain and Shared Services. Prior to joining Huntsman in July 1999, Mr. Turner held various positions with ICI.
Ronald W. Gerrard, age 53, is Senior Vice President, Environmental, Health & Safety and Manufacturing Excellence. Mr. Gerrard was appointed to this position in June 2009. He also serves as our Corporate Sustainability Officer. From May 2004 to June 2009, Mr. Gerrard served as Vice President, Global Operations and Technology in our Polyurethanes business. From 1999 to May 2004, Mr. Gerrard served as Vice President, Asia; Business Director, Flexible Foams; and Director, EHS and Engineering, also within our Polyurethanes business. Prior to joining Huntsman in 1999, Mr. Gerrard had worked for ICI and for EVC, a joint venture between ICI and Enichem. Mr. Gerrard is a Chartered Engineer.
Brian V. Ridd, age 54, is Senior Vice President, Purchasing. Mr. Ridd has held this position since July 2000. Mr. Ridd served as Vice President, Purchasing from December 1995 until he was appointed to his current position. Mr. Ridd joined Huntsman in 1984.
R. Wade Rogers, age 47, is Senior Vice President, Global Human Resources. Mr. Rogers has held this position since August 2009. From May 2004 to August 2009, Mr. Rogers served as Vice President, Global Human Resources, from October 2003 to May 2004, Mr. Rogers served as Director, Human Resources—Americas and from August 2000 to October 2003, he served as Director, Human Resources for our Polymers and Base Chemicals businesses. From the time he joined Huntsman in 1994 to August 2000, Mr. Rogers served as Area Manager, Human Resources—Jefferson County Operations. Prior to joining Huntsman, Mr. Rogers held a variety of positions with Texaco Chemical Company.
Russ R. Stolle, age 50, is Senior Vice President and Deputy General Counsel. Mr. Stolle was appointed to this position in January 2010. From October 2006 to January 2010, Mr. Stolle served as our Senior Vice President, Global Public Affairs and Communications, from November 2002 to October 2006, he served as Vice President and Deputy General Counsel, from October 2000 to
111
November 2002 he served as Vice President and Chief Technology Counsel and from April 1994 to October 2000 he served as Chief Patent and Licensing Counsel. Prior to joining Huntsman in 1994, Mr. Stolle had been an attorney with Texaco Inc. and an associate with the law firm of Baker & Botts.
Randy W. Wright, age 54, is Vice President and Controller. Prior to his appointment to this position in February 2012, Mr. Wright served as Assistant Controller and Director of Financial Reporting since July 2004. Prior to joining Huntsman in 2004, Mr. Wright held various positions with Georgia-Pacific Corporation, Riverwood International, Johns Manville and PricewaterhouseCoopers. Mr. Wright is a Certified Public Accountant.
Kevin C. Hardman, age 49, is Vice President, Tax. Mr. Hardman served as Chief Tax Officer from 1999 until he was appointed to his current position in 2002. Prior to joining Huntsman in 1999, Mr. Hardman was a tax Senior Manager with the accounting firm of Deloitte & Touche LLP, where he worked for 10 years. Mr. Hardman is a Certified Public Accountant and holds a master's degree in tax accounting.
John R. Heskett, age 44, is Vice President, Planning and Treasurer. Mr. Heskett has held this position since December 2009. From September 2008 until October 2009, Mr. Heskett served as a Vice President at Boart Longyear Limited, a publicly-listed exploration drilling services and products company. Mr. Heskett previously served as Vice President, Corporate Development and Investor Relations for our Company from August 2004 until September 2008 and was appointed Vice President, Corporate Development in 2002. Mr. Heskett also served as Assistant Treasurer for our Company and several of our subsidiaries. Prior to joining Huntsman in 1997, Mr. Heskett was Assistant Vice President and Relationship Manager for PNC Bank, N.A., where he worked for a number of years.
Steven C. Jorgensen, age 44, is Vice President, Accounting Shared Services and Internal Controls. Prior to his appointment to this position in February 2012, Mr. Jorgensen served as Vice President, Internal Controls and Internal Audit since May 2007. Mr. Jorgensen joined Huntsman in May 2004 as Director of Internal Controls and in May 2005 was appointed as Director of Internal Audit and Controls. Prior to joining Huntsman, Mr. Jorgensen was Vice President and Audit Manager with General Electric Consumer Finance, and prior to that he was an audit Senior Manager with the accounting firm of Deloitte & Touche LLP. Mr. Jorgensen is a Certified Public Accountant and holds a master's degree in accounting.
Kurt D. Ogden, age 44, is Vice President, Investor Relations. Prior to his appointment to this position in February 2009, Mr. Ogden served as Director, Corporate Finance since October 2004. Prior to joining Huntsman in 2004, Mr. Ogden held various positions with Hillenbrand Industries, Pliant Corporation and Huntsman Chemical Corporation. Mr. Ogden is a Certified Public Accountant and holds a master's degree in business administration.
Maria Csiba-Womersley, age 55, is Vice President and Chief Information Officer. Ms. Csiba-Womersley was appointed to this position effective September 2006. Ms. Csiba-Womersley served as Global eBusiness Director from 2004 to 2006 and also served as our Director of Global IT Planning and Security. Previously, Ms. Csiba-Womersley was a Regional Polymer Sales Manager, a Business Director for Polypropylene and Director of Polymer Logistics. Ms. Csiba-Womersley joined Huntsman in 1997.
Board of Directors of Huntsman Corporation
The size of our parent's Board of Directors (the "Board") is currently set at ten, divided into three classes serving staggered terms, with one class being elected each year to serve a three year term. Presented below is information with respect to all directors of our parent. The information presented below for each director includes the specific experience, qualifications, attributes and skills that led us to the conclusion that such director should be nominated to serve on the Board in light of our
112
business. This information is current as of December 4, 2012. The following discussion of the Board relates to our parent, Huntsman Corporation. References in this discussion to "we," "us," "our," or "our company" refer to Huntsman Corporation.
| Jon M. Huntsman | Jon M. Huntsman, age 75, is the Executive Chairman of the Board. Prior to his appointment as Executive Chairman effective February 1, 2009, Mr. Huntsman served as Chairman of the Board of our company since its formation in 2004 and the predecessors to our company since 1970, when he founded his first plastics company. Mr. Huntsman served as Chief Executive Officer of our company and our affiliated companies from 1970 to 2000. Mr. Huntsman is a director or manager, as applicable, of Huntsman International and certain of our other subsidiaries. In addition, Mr. Huntsman serves or has served as Chairman or as a member of numerous corporate, philanthropic and industry boards, including the American Red Cross, The Wharton School, University of Pennsylvania, Primary Children's Medical Center Foundation, the Chemical Manufacturers Association and the American Plastics Council. Mr. Huntsman was selected in 1994 as the chemical industry's top Chief Executive Officer for all businesses in Europe and North America. Mr. Huntsman formerly served as Special Assistant to the President of the United States and as Vice Chairman of the U.S. Chamber of Commerce. He is the founding and principal benefactor of the Huntsman Cancer Institute. Mr. Huntsman is the father of our Chief Executive Officer, Peter R. Huntsman, our Division President, Advanced Materials, James H. Huntsman, and our director, Gov. Jon M. Huntsman, Jr. | |
The Board has concluded that Mr. Huntsman should continue to serve as the Executive Chairman of the Board based upon the following reasons, among others: (1) his vital role in the founding and history of our company enables him to provide the Board with important perspective and extensive knowledge of our business; (2) his extensive experience in the chemical industry allows him to advise the Board on our strategic and operational directives; and (3) his leadership and business skills enable him to lead our company and the Board as well as continually educate and advise the Board on our company's industry and related opportunities, issues, and challenges. |
||
Dr. Patrick T. Harker |
Dr. Harker, age 54, has served as one of our directors since March 2010. Dr. Harker serves as Chairman of our Governance Committee and as a member of the Audit Committee. Dr. Harker was recently appointed to the Board of the Federal Reserve Bank of Philadelphia in January 2012 as a Class B director. Since 2007, Dr. Harker has been President of the University of Delaware, Newark, Delaware. From February 2000 through June 2007, Dr. Harker was Dean of the Wharton School of the University of Pennsylvania and served as a Professor of Electrical and Systems Engineering in the University of Pennsylvania's School of Engineering and Applied Science. From 2000 to 2010, Dr. Harker served as a Trustee of the Goldman Sachs Trust and Goldman Sachs Variable Trust. He also served as a Member of the Board of Managers of the Goldman Sachs Hedge Fund Partners Registered Fund LLC from 2004 through 2009. Since May 2009, Dr. Harker has served as a director for Pepco Holdings, Inc., a public utility holding company. |
113
| The Board has concluded that Dr. Harker should continue to serve as a director for our company based upon the following reasons, among others: (1) his significant experience leading highly-respected educational institutions brings to the Board a well-respected leader with large-scale operational experience; (2) his experience with financial institutions and his strong background in capital markets provides the Board business and financial expertise; (3) his service on other boards provides him with experience in board oversight and insights learned from other companies; and (4) his background in engineering and applied science enables him to provide the Board technical expertise. | ||
Dr. Mary C. Beckerle |
Dr. Beckerle, age 58, has served as one of our directors since May 2011. She serves as a member of our Governance Committee. Dr. Beckerle is an internationally recognized scientist who has served on numerous national scientific boards and committees, including the Advisory Committee to the Director of the U.S. National Institutes of Health. She is currently a member of cancer policy and advisory boards at the American Association of Cancer Research, Georgetown University, the University of Pennsylvania, the National Center for Biological Sciences in Bangalore (India), and the Mechanobiology Institute of the National University of Singapore. Dr. Beckerle is a Distinguished Professor of Biology in the College of Science at the University of Utah, which she joined in 1986. Since 2006, Dr. Beckerle has served as Chief Executive Officer and Director of Huntsman Cancer Institute at the University of Utah. Dr. Beckerle served as President of the American Society for Cell Biology in 2006, held a Guggenheim Fellowship at the Curie Institute in Paris, and is an elected Fellow of the American Academy of Arts and Sciences. Dr. Beckerle is a National Association of Corporate Directors (NACD) Governance Fellow. She has demonstrated her commitment to boardroom excellence by completing NACD's comprehensive program of study for corporate directors. |
|
The Board has concluded that Dr. Beckerle should continue to serve as a director for our company based upon the following reasons, among others: (1) her achievements and credentials in science and medical research enable her to provide the Board with a unique perspective and technical advice on biological and environmental health and safety issues; (2) her international experience allows her to provide insights into challenges and opportunities related to our global business; (3) her extensive leadership, organizational planning, and management credentials enable her to offer practical insight with respect to our company's operational and strategic initiatives; and (4) her academic and public policy experience provides a valuable perspective in areas related to corporate governance, compliance and talent management. |
114
| Peter R. Huntsman | Peter R. Huntsman, age 50, has served as a director of our company and affiliated companies since 1994. Mr. Huntsman is President, Chief Executive Officer and a director of our company. Prior to his appointment in July 2000 as Chief Executive Officer, Mr. Huntsman had served as President and Chief Operating Officer since 1994. In 1987, after working for Olympus Oil since 1983, Mr. Huntsman joined Huntsman Polypropylene Corporation as Vice President before serving as Senior Vice President and General Manager. Mr. Huntsman has also served as Senior Vice President of Huntsman Chemical Corporation and as a Senior Vice President of Huntsman Packaging Corporation, a former subsidiary of our company. Mr. Huntsman is the son of our Executive Chairman, Jon M. Huntsman, the brother of our Division President, Advanced Materials, James H. Huntsman, and the brother of our director, Gov. Jon M. Huntsman, Jr. | |
The Board has concluded that Mr. Huntsman should continue to serve as a director for our company based upon the following reasons, among others: (1) his current position as our Chief Executive Officer enables him to bring invaluable operational, financial, regulatory and governance insights to the Board; and (2) his considerable role in the history and management of our company and its affiliates enables him to continually educate and advise the Board on our business, the chemical industry and related opportunities and challenges. |
||
Wayne A. Reaud |
Mr. Reaud, age 65, has served as one of our directors since March 2005. Mr. Reaud currently serves as Chairman of our Litigation Committee, which was formed in November 2008, and he serves as a member of our Compensation Committee. Mr. Reaud is a trial lawyer and the founder of the law firm of Reaud, Morgan & Quinn. For over 30 years, he has represented clients in significant cases involving personal injury, product and premises liability, toxic torts and business litigation. Mr. Reaud has handled first impression mass tort litigation involving asbestos premises liability claims, including the largest asbestos product liability class action lawsuit in the history of Texas courts. He also represented the State of Texas in its landmark litigation against the tobacco industry. Mr. Reaud currently serves as Chairman of the Board of the Beaumont Foundation of America and is a Director of the Reaud Charitable Foundation. He is a Life Fellow of the Texas Bar Foundation and a Fellow of the International Society of Barristers, a member of the Philosophical Society and a member of the State Bar of Texas Grievance Committee. Mr. Reaud was chosen as the Most Distinguished Alumni of Texas Tech University Law School in 1998 and also chosen as the Most Distinguished Alumni of Lamar University in 2006. Mr. Reaud was awarded the Honorary Order of the Coif by the University of Texas in 2011. He is listed in Best Lawyers in America. |
115
| The Board has concluded that Mr. Reaud should continue to serve as a director for our company based upon the following reasons, among others: (1) his legal expertise and extensive experience with complex and high-profile litigation enable him to advise the Board and our company on litigation risks and strategies; and (2) his commitment to community service and cultural affairs is valuable to the Board because of our company's significant focus on these areas. | ||
Alvin V. Shoemaker |
Mr. Shoemaker, age 74, has served as one of our directors since March 2005. Mr. Shoemaker serves as a member of the Audit Committee and the Compensation Committee. Mr. Shoemaker has been a private investor since his retirement as Chairman of the Board of First Boston Corporation and First Boston, Inc. in 1989, a position he assumed in 1983. Mr. Shoemaker also serves as a director of Wynn Resorts Limited. |
|
The Board has concluded that Mr. Shoemaker should continue to serve as a director for our company based upon the following reasons, among others: (1) his board experience gives him operational and financial oversight expertise and allows him to contribute insights on achieving business success in a diverse range of economic conditions and competitive environments; and (2) his executive-level experience at First Boston Corporation and First Boston, Inc. demonstrates proven leadership and business capabilities. |
||
Nolan D. Archibald |
Mr. Archibald, age 69, has served as one of our directors since March 2005 and he is currently the Vice Chairman and Lead Independent Director of the Board. Mr. Archibald is also Chairman of the Compensation Committee. Mr. Archibald served as Executive Chairman of Stanley Black & Decker, Inc., a consumer and commercial products company, from March 2010 to March 2013, and continues to serve as a director of the company. He served as President and Chief Executive Officer of The Black & Decker Corporation, a consumer and commercial products company, from 1986 until 2010, as well as Chairman of the Board of The Black & Decker Corporation from 1987 until 2010. In addition, Mr. Archibald serves as a director of Lockheed Martin Corporation and Brunswick Corporation. |
|
The Board has concluded that Mr. Archibald should continue to serve as the Vice Chairman and Lead Independent Director of the Board based upon the following reasons, among others: (1) his extensive executive-level management experience gained with Stanley Black & Decker has given him leadership and business capabilities that provide the Board with a unique skill set and significant business and strategic insight; and (2) his extensive board experience as a director of other public companies enables him to contribute significantly to the Board's oversight responsibilities. |
116
| M. Anthony Burns | Mr. Burns, age 70, has served as one of our directors since March 2010. He is Chairman of the Audit Committee and a member of the Governance Committee. Mr. Burns currently serves as Chairman Emeritus of Ryder System, Inc., a provider of transportation and logistics services, a position that he has held since 2002. Mr. Burns served in several positions at Ryder until his retirement in 2002, including Chairman of the Board from 1985 to 2002, Chief Executive Officer from 1983 to 2000 and President from 1979 to 1999. Prior to joining Ryder, Mr. Burns served in management of Mobil Oil Corporation. Mr. Burns also currently serves as a director of Pfizer Inc. He is a Life Trustee of the University of Miami in Florida and is active in cultural and civic organizations in Florida. | |
The Board has concluded that Mr. Burns should continue to serve as a director for our company based upon the following reasons, among others: (1) his long tenure as Chief Executive Officer of Ryder System, a major public company, provides the Board with valuable leadership and management insights; (2) his service on (and in some cases chairmanship of) the audit committees of other public companies provides him with valuable financial expertise and enables him to serve as chair of our Audit Committee; and (3) his executive compensation experience through service on the compensation committees of other public companies provides him with exposure to, and insight from, CEOs and boards of other large companies. |
||
Jon M. Huntsman, Jr. |
Governor Jon M. Huntsman, Jr., age 52, has served as one of our directors since February 2012. Gov. Huntsman was most recently a candidate for the Republican nomination for the President of the United States. From 2009 to 2011, he served as U.S. Ambassador to China and he served as Governor of the State of Utah from 2005 to 2009. Gov. Huntsman's public service also includes appointments as U.S. Ambassador to Singapore, Deputy U.S. Trade Representative and Deputy Assistant Secretary of Commerce for Asia. Gov. Huntsman currently serves as Chairman of the Huntsman Cancer Foundation. He also serves as a director of Ford Motor Company and Caterpillar, Inc. Gov. Huntsman originally joined our company in 1983 and served in numerous capacities, including Vice Chairman, until his resignation in 2005. Gov. Huntsman is the son of our Executive Chairman, Jon M. Huntsman, the brother of our Chief Executive Officer, Peter R. Huntsman, and the brother of our Division President, Advanced Materials, James H. Huntsman. |
|
The Board has concluded that Gov. Huntsman should continue to serve as a director for our company based upon the following reasons, among others: (1) his experience as an ambassador to China and Singapore gives him international and diplomatic experience that is critically important to our company as we continue to expand globally and particularly in Asia; (2) his experience as Governor of Utah gives him large-scale operational experience and valuable insight into governmental affairs; and (3) his prior experience with the Huntsman companies gives him knowledge of our company and our industry including important insights into our business and management. |
117
| Sir Robert J. Margetts | Sir Robert, age 66, has served as one of our directors since August 2010. He currently serves as Deputy Chairman of OJSC Uralkali, a publicly traded potash fertilizer producer, and on the boards of a number of privately held companies. Sir Robert previously served as a director of Anglo American PLC from 1998 to 2010, Chairman of Legal & General Group PLC from 2000 until 2010 and Chairman of BOC Group PLC from 2002 to 2006. Sir Robert served as Chairman—Europe of Huntsman Corporation from 2000 to August 2010. He worked for Imperial Chemical Industries (ICI) in various levels of increasing responsibility from 1969 to 2000, where he ultimately served as the Vice Chairman of its Main Board. | |
The Board has concluded that Sir Robert should continue to serve as a director for our company based upon the following reasons, among others: (1) his more than 40 years experience in the chemical industry, including experience with our company, enables him to provide our Board with advice and expertise relating to business and strategic initiatives; and (2) both his location in Europe and his extensive board and executive-level management experience running global businesses provides the Board with important insights and perspectives into the chemical industry in important international locations. |
118
COMPENSATION DISCUSSION AND ANALYSIS
The following discussion and analysis relates to our parent, Huntsman Corporation. However, because all of Huntsman Corporation's operations are conducted by our Company and our subsidiaries, we believe this discussion and analysis is material to an understanding of our Company and our subsidiaries. The managers and officers of Huntsman International do not receive any compensation for services rendered in such capacities in addition to compensation provided by our parent. Unless the context otherwise requires, references in this Compensation Discussion and Analysis to "we," "us," "our," or "our company" refer to Huntsman Corporation, together with its subsidiaries.
Named Executive Officers
The following Compensation Discussion and Analysis, or CD&A, provides information regarding the compensation paid to our Chief Executive Officer, Chief Financial Officer and the other three most highly compensated executive officers in 2012. We refer to these individuals as "named executive officers." Our named executive officers for 2012 were Jon M. Huntsman, Executive Chairman of the Board, Peter R. Huntsman, President and Chief Executive Officer, J. Kimo Esplin, Executive Vice President and Chief Financial Officer, Anthony P. Hankins, Chief Executive Officer, Asia Pacific and Division President, Polyurethanes, and Simon Turner, Division President, Pigments.
Executive Summary
As described in more detail throughout this CD&A, our executive compensation program is designed primarily to "pay for performance" based on an allocation among long-term and short-term components. See "—Compensation Philosophy and Objectives—Pay for Performance" below for additional information. We strive to establish a proper balance of risks in achieving goals designed to further our business objectives and create stockholder value. We believe our executive compensation program is effectively designed and working well is in alignment with the interests of our stockholders and is instrumental to achieving our business strategy.
2012 was another year of record earnings for our company. Our adjusted EBITDA for the second year in a row was higher than it has ever been with our current group of businesses. Some of the financial highlights from 2012 include:
The Compensation Committee believes that the leadership, vision and hard work of our executive team played a critical role in achieving this performance in 2012. In light of this strong performance, the Compensation Committee believes that the Company's compensation programs are working effectively to incentivize our executives by paying for performance and aligning the interests of our executives with those of our stockholders. The Compensation Committee believes that the balanced compensation programs in place during 2012 operated as the Compensation Committee intended when it designed and implemented the programs, specifically:
119
75th percentile for our Executive Chairman and Chief Executive Officer, and particularly important in attracting and retaining key executives;
Although we evaluate our compensation programs on an annual basis, our compensation practices have remained substantially the same for several years. However, the Compensation Committee did make certain changes for 2012 as discussed herein. See "—2012 Executive Compensation" for more information regarding these changes. Specifically, the Compensation Committee made the following modifications to our compensation arrangements in 2012:
At the 2012 Annual Meeting, we held a stockholder advisory vote, or "say-on-pay" proposal, to approve the compensation paid to our named executive officers in 2011. At that meeting, 79% of the total votes cast on the "say-on-pay" proposal were voted in favor of the proposal. In determining executive compensation for 2013, the Compensation Committee evaluated the results of the 2012 advisory vote on executive compensation and considered the overall stockholder support that our
120
"say-on-pay" proposal received. For 2013, the Compensation Committee continued to apply the same general compensation principles and philosophy, while making some adjustments. While the Compensation Committee will continue to consider the outcome of our annual "say-on-pay" vote when determining future compensation practices and pay levels for our named executive officers, the Compensation Committee is confident that our compensation programs are performance based and align the incentives of our executives with those of our stockholders. In accordance with the preference expressed by our stockholders at the 2011 Annual Meeting, we continue to hold annual advisory votes on executive compensation. Stockholders are given an opportunity to cast an advisory vote on the frequency of "say-on-pay" votes every six years, with the next opportunity occurring in connection with our Annual Meeting in 2017.
In this CD&A, we refer to our EBITDA, adjusted EBITDA and adjusted diluted income per share, which are non-GAAP financial measures. A presentation and reconciliation to the most directly comparable GAAP financial measures is contained on pages 61-64 of our Annual Report on Form 10-K for the year ended December 31, 2012, as filed with the SEC on February 12, 2013.
Compensation Philosophy and Objectives
Our executive compensation programs are designed to attract, motivate and retain executives critical to our long-term success and the creation of stockholder value. Our fundamental compensation philosophy is to pay for performance and, consequently, we attempt to closely link executive officers' total compensation with the achievement of annual performance goals and the long-term performance of our company. Management and the Compensation Committee believe that compensation decisions are complex and require careful review of individual and company performance, and consideration of chemical and general industry compensation levels. The Compensation Committee awards compensation to our executive officers based upon corporate, business division and individual performance and designs compensation so as to motivate executive officers to achieve strategic objectives and to continue to perform at the highest levels.
Based on the objectives described above, we strive to maintain an executive compensation program that is structured to provide a total compensation package that, at expected levels of performance, is at or near the 50th percentile for our executive officers (other than our Chief Executive Officer and Executive Chairman, whose compensation is targeted at the 75th percentile) when compared to executives holding comparable positions or having similar qualifications in other similarly situated companies in our peer group (as discussed below), while also taking into account each named executive officer's job responsibilities, performance, employment history and any growth in their leadership role. This is done because the Compensation Committee believes that it is necessary to retain key executives who may otherwise be incentivized to leave our company if a significant pay disparity existed between us and our competitors. Actual compensation may be above or below targets based on the performance of our company and the individual, with the opportunity to achieve greater compensation based on superior performance. This approach is intended to ensure that a significant portion of executive compensation is based on our financial and strategic performance and that our executive officers are rewarded for superior performance.
Our compensation philosophy is supported and accompanied by the following compensation governance provisions:
121
Pay for Performance. "Pay for performance" continues to be a fundamental tenet of our compensation philosophy, which includes the core principles of rewarding the attainment of performance goals and aligning our executives' objectives with our stockholders' interests. Our executives are accountable for the performance of our company and the business segments they manage and are compensated primarily based on that performance. We believe that our executive compensation program contributes to a high-performance culture where executives are expected to deliver results that drive sustained growth. As highlighted above under "—Executive Summary," fiscal year 2012 was another highly profitable year for our company, with record adjusted EBITDA with its existing businesses. Our named executive officers were rewarded for this performance as follows:
For more information, see "—2012 Executive Compensation—Annual Incentive Program." In addition, total stockholder return for 2012 was 63% further evidencing the alignment of our compensation objectives with the interests of our stockholders.
Elements of Executive Compensation
The key elements of direct compensation for our executive officers continue to be base salary, annual cash performance awards and equity-based compensation. This mixture of pay elements represents our belief that executive officers should have elements of their compensation tied to both short and long-term objectives and is the result of our historical pay practices, recommendations by Meridian and executive management and Compensation Committee determinations. The Compensation Committee strives to align the relative proportion of each element of total direct compensation with the competitive market and our objectives, as well as to preserve the flexibility to respond to the continually changing global environment in which we operate. Generally, as employees move to higher levels of responsibility with greater ability to influence our financial results, the percentage of performance-based pay will increase. The Compensation Committee's goal is also to strike the appropriate balance between annual and long-term incentives, and it may adjust the allocation of pay to best support our objectives. Our executive officers also are eligible for elements of indirect compensation comprised of health and welfare benefits, retirement and savings plans, severance arrangements and certain perquisites. The Compensation Committee considers each of the key elements of direct and indirect compensation when evaluating the overall compensation program design.
122
Specifically, compensation for the Executive Chairman and the Chief Executive Officer is carefully considered in light of their unique and indispensible roles. The Executive Chairman provides ongoing strategic leadership at both a Board and an executive level. As the founder of our company, he has over 40 years experience in the industry and has developed important relationships in the industry, including with many of our key customers. The Chief Executive Officer provides day-to-day company leadership and management. In addition to his role as Chief Executive Officer, he also fulfills many of the duties of a chief operating officer. In light of these unique roles, the Compensation Committee strives to compensate the Executive Chairman and the Chief Executive Officer based on similarly situated executives at comparable companies within our peer group and with other chemical and general industrial companies.
A detailed discussion of the specific elements of compensation awarded to our named executive officers for 2012 is set forth below in "Compensation Discussion and Analysis—2012 Executive Compensation."
Annual Base Salary. The Compensation Committee uses several sources of information in determining the annual base salary of our named executive officers. The Chief Executive Officer makes recommendations to the Compensation Committee regarding the annual base salary of each executive officer, other than himself and the Executive Chairman. The Compensation Committee also reviews comparative information on peer company pay provided by Meridian, including comparative information regarding the Executive Chairman and Chief Executive Officer. The Compensation Committee establishes base salaries that it believes are sufficient to attract and retain individuals with the qualities it deems necessary for our long-term financial success and that are competitive in the marketplace.
An executive officer's base salary generally reflects the officer's responsibilities, tenure, job performance, special circumstances (such as overseas assignments) and the market for the executive's services. The Compensation Committee reviews the base salary of each executive officer on an annual basis. In addition to these annual reviews, the Compensation Committee may, at any time, review the salary of an executive who has received a significant promotion, whose responsibilities have changed significantly or who is subject to competitive hiring pressure. Any adjustments are based on the results of the annual review of market pay data, changes in the cost of living, job performance or the expansion of duties and responsibilities. No pre-determined weight or emphasis is placed on any one of these factors.
Annual Incentive Program. Our annual incentive program enables executive officers and other key employees to earn an annual cash performance award based on performance against predetermined criteria. The potential payments available under the annual incentive program for the named executive officers depend on the attainment of performance goals recommended by executive management and approved by the Compensation Committee at the beginning of the year. Furthermore, as part of the annual cash performance award process for the named executive officers, the Compensation Committee undertakes a subjective evaluation of each executive officer's individual performance and success in areas it believes to be significant to us as a whole or to a particular business unit or function.
Long-Term Equity-Based Compensation. Our long-term equity-based compensation awards are designed to align our executive team's interests with the interests of our stockholders by tying a significant portion of total compensation directly to the performance of our common stock. The Compensation Committee believes that grants of long-term equity-based awards to executive officers encourage them to remain with and devote their best efforts to our company and enhance our ability to attract and retain the services of executives essential for our growth and profitability.
We provide executives with long-term equity-based compensation through the Huntsman Stock Incentive Plan, as amended and restated (the "Stock Incentive Plan"), which was most recently
123
approved by our stockholders on November 4, 2009. The Stock Incentive Plan allows for a variety of stock-based awards. Annual grants of equity-based awards are typically made during the first quarter.
The Compensation Committee currently uses a mix of restricted stock and stock options for our executive officers and believes that these two award types support our strategic objectives and provide appropriate long-term performance incentives. The value of stock options granted to executives is directly tied to the performance of our common stock. These options only have value to the extent the price of our common stock exceeds the stock price on the grant date. Restricted stock awards support a long-term focus by executives, as their value necessarily depends on the value of our common stock over time. Both stock options and restricted stock awards provide a strong retention incentive by vesting over a three-year period, and only if our executive officers continue to be employed by us. Our Director and Executive Stock Ownership Guidelines further align the focus of our executives with that of our stockholders by requiring our executive officers to retain a significant number of shares of common stock. See "—Equity Ownership Policy."
The Compensation Committee believes that stock options and restricted stock awards are the most appropriate award types to support the principal objectives of our overall compensation program. In making this determination, the Compensation Committee has, from time to time, considered other types of awards, including awards tied directly to our financial performance or our financial performance compared to that of our peers. The Compensation Committee believes that the focus on long-term performance that our equity-based compensation program currently provides is in alignment with the long-term objectives and goals of our company. The Compensation Committee also believes that stock awards based on our performance compared to a set group of peers risk placing excessive focus on short-term financial performance and could reward our executive officers in years when company performance is poor so long as the peers against whom we are compared also perform poorly.
In determining the allocation of awards each year between stock options and restricted stock, the Compensation Committee assesses the risk profile of our long-term equity-based award practices and assesses whether the appropriate level of risk is accounted for in the mix of awards granted, and makes changes as appropriate. In 2012, we granted equity awards to our named executive officers of restricted stock and stock options of equal value based on the grant date fair value of such awards (other than to our Executive Chairman, who received his award entirely in the form of restricted stock). This grant of equity award incents our named executive officer to enhance share price over the long-term and results in a substantial portion of our named executive officers' total compensation being directly linked to the long-term performance of our common stock.
Health and Welfare Benefits. We provide our named executive officers with benefits that are intended to be a part of a competitive total compensation package that provides health and welfare programs comparable to those provided to employees and executives at other companies in the chemical industry. Our named executive officers participate in our health and welfare programs on the same basis as our other employees.
Retirement and Savings Plans. We provide our named executive officers with benefits that are intended to be a part of a competitive total compensation package that provides retirement and savings programs comparable to those provided to employees and executives at other companies in the chemical industry and the general market. The benefit plan descriptions below in the narratives following the "—Pension Benefits in Fiscal 2012" and "—Nonqualified Deferred Compensation in Fiscal 2012" tables provide an explanation of the major features of our retirement and savings plans. The named executive officers participate in our qualified retirement and savings plans on the same basis as other employees.
We provide defined benefit pension plans, including the Huntsman Defined Benefit Pension Plan (a tax qualified defined benefit pension plan) and the Huntsman Supplemental Executive Retirement Plan (a nonqualified supplemental pension plan for executives who exceed the qualified plan
124
limitations). Employees in foreign jurisdictions participate in the retirement and savings plans mandated by applicable law. In addition, we provide the Huntsman Pension Scheme to our U.K. employees in the Polyurethanes segment, such as Mr. Hankins. We provide the Tioxide Pension Fund to our U.K. employees in the Pigments segment, such as Mr. Turner, who is also a participant in the nonqualified supplemental Huntsman Global Pension Scheme.
We also provide executive officers the opportunity to participate in up to four defined contribution savings plans: a salary deferral plan (the "401(k) Plan"); a supplemental savings plan (the "Supplemental Savings Plan"); a money purchase pension plan (the "MPP"); and a supplemental executive money purchase pension plan (the "SEMPP"). In addition, officers in the U.K., including Mr. Turner, are eligible for the Huntsman UK Pension Plan, which is a defined contribution pension arrangement for U.K. associates in the Pigments segment. The Huntsman UK Pension Plan provides a 3-for-1 matching formula whereby an associate can receive a company contribution of up to 15% of pay if the associate contributes 5% of pay. For five years following implementation of this plan, associates receive an additional company contribution through transition credits. During 2012, the company contributed 21.5% of pensionable salaries for all associates in the Huntsman UK Pension Plan.
Perquisites. We provide additional compensation to our Chief Executive Officer and other named executive officers in the form of perquisites for the convenience of executives in meeting the demands of their positions. The Compensation Committee reviews our policies with respect to perquisites and considers whether and to what extent it may be appropriate for our Chief Executive Officer and the other named executive officers to reimburse our company for perquisites.
Employment Agreements. We do not generally enter into employment agreements with our executive officers. However, in accordance with our practice with respect to employees on assignment in a foreign country, Mr. Hankins entered into a letter agreement on November 1, 2000 with our subsidiary Huntsman Polyurethanes Americas detailing the terms of his secondment from Huntsman Polyurethanes (UK) Ltd. The primary purpose of this letter agreement is to provide Mr. Hankins with details regarding repatriation to his home country following the completion of his foreign assignment. This letter agreement also defines the initial elements of Mr. Hankins' compensation package, including base salary and a cash performance award, and it provides for customary expatriation arrangements, including an international location allowance expressed as a percentage of his annual salary.
125
Severance Arrangements. For executive officers who do not have employment agreements with us, we provide payments and benefits upon certain severance events through the Huntsman Executive Severance Plan (the "Executive Severance Plan"). We established the Executive Severance Plan to remain competitive with other companies against whom we compete for executive talent, which commonly have employment or other agreements with their executives providing for severance payments and benefits. As citizens of the U.K., Messrs. Hankins and Turner are entitled participants in their respective business severance plans. If Messrs. Hankins' or Turner's employment were terminated, his potential payout under the Executive Severance Plan and his respective U.K. business's plan would be compared and then he would be paid under the plan generating the higher payout. A description of the Executive Severance Plan and other arrangements relevant to post-employment compensation is found below under the heading "Potential Payments upon Termination or Change of Control."
Effective January 1, 2013, we entered into severance agreements with our Executive Chairman and Chief Executive Officer. These agreements do not provide benefits that are meaningfully different from what the executives were previously entitled to under the Executive Severance Plan, except in the event of a qualifying termination event in connection with or following a change of control. Since our initial public offering in 2005, we have evolved from a closely held private company to a public company with a diverse ownership base. Given our status as a public company, we determined that severance arrangements are appropriate and common for similarly situated executives at other public companies. We also believe that such agreements are needed to provide an appropriate level of economic protection for the Executive Chairman and Chief Executive Officer in the context of a change in control so that they may remain focused on the strategic interests of our company and our shareholders in evaluating or pursuing potential corporation transactions. The Compensation Committee consulted extensively with Meridian in designing these arrangements taking into account market practices, not only with respect to the formulas used to calculate the amount of severance pay due in certain scenarios but also with respect to other terms and conditions of the agreements, such as requiring a "double trigger" in order for cash payments to become due and providing for the cut-back of payments in situations where payment in full would result in less after-tax income to the officer. The severance agreements do not provide for tax gross ups on any potential parachute payments received by the officers. As discussed below under the heading "Potential Payments upon Termination or Change of Control," upon the occurrence of a change in control, all outstanding unvested restricted shares held by our Executive Chairman will automatically become vested in full. Further details regarding the severance agreements are provided below under the heading "Potential Payments upon Termination or Change of Control."
Annual Review of Executive Compensation
The Compensation Committee, executive management and Meridian each play a key role in the Compensation Committee's annual review, evaluation and approval of our executive compensation programs as further described below.
Compensation Committee. The Compensation Committee has authority and responsibility for the review, evaluation and approval of the compensation structure and level for all of our executive officers. This includes the articulation of a compensation philosophy and implementation of policies and plans covering our executive officers. In making its decisions regarding each executive officer's compensation, the Compensation Committee considers the nature and scope of all elements of the executive's total compensation package, the executive's responsibilities and his or her effectiveness in supporting our key strategic, operational and financial goals.
The Compensation Committee reviews different components of compensation at its quarterly meetings during the year. Each time a component is reviewed, the Compensation Committee considers input from executive management and Meridian. After these consultations, the Compensation Committee considers each executive officer's performance, including through reports from other
126
members of executive management (for all executives other than our Chief Executive Officer and our Executive Chairman) and, in many cases, personal observation. The Compensation Committee considers all of this information in making individual compensation decisions.
In addition, all independent members of the Board (including the Compensation Committee) annually review and approve each element of annual compensation for our Executive Chairman and our Chief Executive Officer. This review includes an evaluation of performance, corporate goals and objectives relevant to compensation, and compensation payable under various circumstances, including upon retirement or a change of control. Meridian provides advice to the Compensation Committee in connection with this review.
Executive Management. Our Chief Executive Officer sets our strategic direction and strives to promote compensation programs that motivate executives' and employees' behavior consistent with our company's strategic objectives. Our Chief Executive Officer is assisted by our Senior Vice President, Global Human Resources, who provides assistance with the design and development of compensation programs, the interpretation of compensation data and the effects of adjustments and modifications to our compensation programs. Our finance and legal departments also assist our Chief Executive Officer by advising on legal and financial considerations relevant to these programs.
Under the direction of the Compensation Committee and in coordination with Meridian, executive management coordinates the annual review of the compensation program for our executive officers. This review includes an evaluation of the executive officer's historical pay and career development, individual and corporate performance, competitive practices and trends and other compensation issues. Based on the results of this review, executive management makes recommendations to the Compensation Committee regarding each element of compensation for each of the executive officers, other than the Chief Executive Officer and the Executive Chairman. Our Chief Executive Officer also provides the Compensation Committee with his evaluation with respect to each executive officer's performance (other than our Executive Chairman and himself) during the prior year.
Independent Compensation Consultant. The Compensation Committee has sole authority to retain and terminate the services of a compensation consultant who reports to the Compensation Committee. The role of the compensation consultant is to advise the Compensation Committee in its oversight role, advise executive management in the executive compensation design process and provide independent compensation data and analysis to facilitate the annual review of our compensation programs. The compensation consultant attends Compensation Committee meetings as requested by the Compensation Committee. Beginning in 2011, the Compensation Committee retained Meridian as its compensation consultant. Meridian is an independent compensation consulting firm and does not provide any other services to us outside of matters pertaining to executive officer and director compensation. Meridian reports directly to the Compensation Committee, which is solely responsible for determining the scope of services performed by Meridian and the directions given to Meridian regarding the performance of such services.
Services performed by Meridian for the Compensation Committee during 2012 included evaluating levels of executive officer and director compensation as compared to general market compensation data and peer group data (as discussed below), evaluating proposed compensation programs or changes to existing programs, providing information on current executive compensation trends, and providing updates on applicable legislative.
For the last completed fiscal year, the Compensation Committee determined that Meridian was independent of management (and continues to be independent of management) and therefore, Meridian was able to provide (and continues to be able to provide) the Compensation Committee independent and objective advice. Accordingly, the Compensation Committee determined that the services provided by Meridian to the Compensation Committee for the last completed fiscal year did not give rise to any conflicts of interest. The Compensation Committee made these determinations by
127
assessing the independence of Meridian under the six independence factors adopted by the SEC and incorporated into the NYSE Corporate Governance Listing Standards. Further, in making this assessment, the Compensation Committee considered Meridian's written correspondence to the Compensation Committee that affirmed the independence of Meridian and the partners, consultants and employees who provide services to the Compensation Committee on executive and director compensation matters.
Compensation Peer Analysis
In determining the appropriate amount of each element of the executive officers' compensation (base salary, annual cash performance awards and long-term equity-based compensation), the Compensation Committee considered the compensation paid to executive officers in similar positions at a peer group of companies. The peer group is comprised of companies against whom we compete in the global chemical industry for executives, key employees and outside directors. The selected peer companies fall within a range of comparison factors (both above and below us) such as revenue, market capitalization and net income. For example, the median revenue in for our peer group at that time was $11.3 billion, while our company's 2011 revenue was $11.2 billion. Compensation information was not adjusted or scaled based on any of these factors. Currently, our peer group is comprised of the following eleven companies:
Our peer group was initially developed in 2005. Some variation in the composition of this group may occur from time to time. At the time that compensation decisions for 2012 were made, our peer group included 3M Company, OM Group Incorporated and Praxair Incorporated and did not include Ashland Inc., Celanese Corporation or Rockwood Holdings, Inc. We have since removed 3M Company, OM Group Incorporated and Praxair Incorporated from our peer group, as these companies were either above or below the range of comparison factors we consider and are companies with whom we do not routinely compete for talent. We added Ashland Inc., Celanese Corporation and Rockwood Holdings, Inc. to our peer group because they fall within the range of comparison factors we consider, are companies against whom we compete for talent and are compared against us and viewed as our peers by the market and our management. The median revenue for our current peer group in 2012 was $9.5 billion, while our company's 2012 revenue was $11.2 billion.
Competitive market data with respect to the peer group provides a frame of reference for the Compensation Committee when evaluating executive compensation, but is not the only factor considered for our executives' compensation. In addition to the peer group noted above, the Compensation Committee uses nationally recognized compensation surveys to assess the
128
competitiveness of our executive compensation with the broader market of chemical and general industrial companies. These data are generally provided by Meridian and are the product of published survey sources representing compensation amounts for similar positions at general industry and chemical industry companies. The Compensation Committee uses data from these broad market surveys to provide additional information against which they can compare the competitiveness of our executive compensation. The Compensation Committee also uses data from these broad market surveys when comparable data is unavailable or limited within our peer group. This is the case for the Executive Chairman, for whom the Compensation Committee uses broad market surveys for comparative information to assist in evaluating his compensation.
2012 Executive Compensation
Mix of Compensation. For 2012, the Compensation Committee set the mix of base salary, cash performance awards and equity-based compensation as a percentage of total potential direct compensation for our named executive officers as follows:
| Executive Chairman | Chief Executive Officer | Other Named Executive Officers | ||
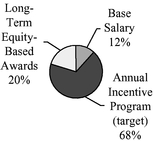
|
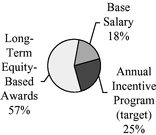
|
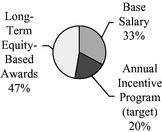
|
The mixture of pay elements described above represents our belief that executive officers should have elements of their compensation tied to both short and long-term objectives. This pay mixture is the result of our historical pay practices, recommendations by Meridian and executive management and Compensation Committee determinations. In determining compensation mix, the Compensation Committee considers how best to compensate the officer based on our strategic objectives that are most closely associated with the officer's role. Accordingly, Jon M. Huntsman's compensation is based in large part on the overall performance of the Company through a substantial annual cash performance award tied to our adjusted EBITDA, net operating cash flows and strategic objectives. In addition, we have traditionally granted Jon M. Huntsman less proportional equity due to his substantial ownership stake in the Company. Peter R. Huntsman's compensation, on the other hand, is weighted toward long-term equity-based awards as his role is to implement and oversee the long-term strategy of the Company and he is thus rewarded, in large part, on the long-term performance of our common stock.
The "Total" compensation reported for each of our Executive Chairman and Chief Executive Officer in the Summary Compensation Table for 2012 represented an increase over 2011 "Total" compensation in the Summary Compensation Table. The majority of these increases were attributable to the amount of performance-based compensation received or that could be received in the form of annual cash incentive compensation for the Executive Chairman, and in the form of both annual cash incentive compensation and long-term equity incentive compensation for the Chief Executive Officer. The higher amounts of annual cash incentive compensation received during 2012, as reported in the "Non-Equity Incentive Compensation" column of the table, are substantially the result of increased company performance. The amounts actually realized by these executive officers with respect to the long-term equity incentive plan compensation awarded in 2012 may be greater or less than the amounts reported in the table, depending on the value of our stock when the awards vest or are exercised. The other primary factor in the increase in "Total" compensation for the Executive Chairman and the Chief
129
Executive Officer was a significant change in the value of their pension benefits during the year resulting from increases in value and changes in certain assumptions except in the case of Mr. Turner who received a top-up payment that made up for benefits lost due to salary restrictions in the U.K.
Annual Base Salary. As part of its annual review cycle, in 2012 the Compensation Committee reviewed the annual base salary of each of our executive officers. The following table provides the base salary determinations for our named executive officers in fiscal years 2011 and 2012 and the percentage increase in their 2012 base salary from 2011:
| |
Base Salary | Percentage Increase From |
||||||||
|---|---|---|---|---|---|---|---|---|---|---|
Officer
|
2011 | 2012 | 2011 to 2012 | |||||||
Jon M. Huntsman |
$ | 1,200,000 | $ | 1,200,000 | 0 | % | ||||
Peter R. Huntsman |
$ | 1,500,000 | $ | 1,600,000 | 6.7 | % | ||||
J. Kimo Esplin(1) |
$ | 575,000 | $ | 592,300 | 3.0 | % | ||||
Anthony P. Hankins(1) |
$ | 750,000 | $ | 772,500 | 3.0 | % | ||||
Simon Turner(1)(2) |
$ | 426,897 | $ | 484,461 | 13.5 | % | ||||
In determining the base salary for each named executive officer in 2012, the Compensation Committee reviewed benchmark levels of compensation data for comparable executive officers within our peer group. The Compensation Committee increased the salary for Peter R. Huntsman to target the 75th percentile of salaries for comparable positions within our peer group and other chemical and general industrial companies and for Messrs. Esplin, Hankins and Turner to bring them within the range of median salaries for comparable positions within our peer group and other chemical and general industrial companies, while also taking into account each named executive officer's job responsibilities, performance and employment history and growth in their leadership role. Mr. Hankins' salary is higher than the median for comparable positions in our peer group to reflect his increased responsibilities in his additional role as CEO Asia Pacific. Mr. Turner received a larger salary increase than our other named executive officers in part due to his leadership in the transformation of our Pigments business, to reflect the increased importance of the business to our company and to recognize the significantly improved results in that business (a 136% improvement in adjusted EBITDA in 2011 compared to 2010).
Annual Incentive Program. Our annual incentive compensation program for 2012 provided for target cash performance awards of 140% base salary for our Chief Executive Officer and 60% of base salary for the other named executive officers (other than the Executive Chairman), with maximum possible cash performance awards set at 280% of base salary for our Chief Executive Officer and 120% of base salary for the other named executive officers.
Beginning in 2012, the Compensation Committee determined to make certain changes to the annual cash performance award evaluation process for the Executive Chairman. Specifically, the Compensation Committee changed the performance goals for the Executive Chairman's cash performance award such that it was based on the achievement of two equally weighted objective performance measures: (i) financial goals, consisting of corporate adjusted EBITDA and net operating cash flow; and (ii) strategic components established by the Compensation Committee, including overseeing the governance and activities of the Board of Directors; contributing to the development and execution of the Company's strategic plan; supporting the development of the Company's executive
130
leadership team; representing the Company in dealings with shareholders, customers, suppliers, at industry activities, and with other stakeholders and interested parties; and promoting the Company's mission and values. In prior years, the amount of the Executive Chairman's annual cash performance award was determined at the discretion of the Compensation Committee based on its subjective evaluation of the Executive Chairman's performance. The Compensation Committee added these objective performance criteria to the Executive Chairman's annual incentive award formula to more directly align his compensation with the financial achievement of our company as well as to incentivize his efforts in other important areas related to his responsibilities. The Compensation Committee also increased Peter R. Huntsman's target incentive award percentage based on their desire to increase his target compensation to at or around the 75th percentile in order to reward him for company performance and in consideration of his filling a dual role as a chief operating officer
The target and maximum cash performance award amounts for the named executive officers were set to generally align within the total compensation median of those amounts for comparable executive positions within our peer group and other chemical and general industrial companies (other than the Executive Chairman and Chief Executive Officer who are targeted at the 75th percentile). Potential payout of individual cash performance awards was dependent upon both company performance and individual contributions to our success. The Executive Chairman has a higher proportion of his total potential compensation from cash performance awards than from long-term equity-based compensation due to his existing substantial ownership stake in the Company.
2012 Target Incentive Award Opportunities. The following table summarizes the cash performance award targets, performance components and corresponding weightings for each of our named executive officers for 2012 cash performance awards.
Officer
|
Target Incentive Award |
Maximum Possible Incentive Award |
Performance Components | Weightings | ||||||||
|---|---|---|---|---|---|---|---|---|---|---|---|---|
Jon M. Huntsman |
n/a | $ | 6,800,000 | Corporate adjusted EBITDA and corporate net operating cash flow |
50 | % | ||||||
|
Achievement of strategic objectives |
50 | % | |||||||||
Peter R. Huntsman |
$ |
2,240,000 |
$ |
4,480,000 |
Corporate adjusted EBITDA |
60 |
% |
|||||
|
Debt reduction, corporate net operating cash flow and compliance |
20 | % | |||||||||
|
Individual performance |
20 | % | |||||||||
J. Kimo Esplin |
$ |
355,380 |
$ |
710,760 |
Corporate adjusted EBITDA |
30 |
% |
|||||
|
Corporate net operating cash flow |
20 | % | |||||||||
|
Corporate Shared Services Fixed Costs |
20 | % | |||||||||
|
Compliance |
20 | % | |||||||||
|
Individual performance |
10 | % | |||||||||
Anthony P. Hankins |
$ |
463,500 |
$ |
927,000 |
Corporate adjusted EBITDA |
20 |
% |
|||||
|
Polyurethanes adjusted EBITDA |
30 | % | |||||||||
|
Corporate net operating cash flow |
20 | % | |||||||||
|
Compliance |
20 | % | |||||||||
|
Individual performance |
10 | % | |||||||||
Simon Turner |
$ |
290,677 |
$ |
581,354 |
Corporate adjusted EBITDA |
20 |
% |
|||||
|
Pigments Adjusted EBITDA |
30 | % | |||||||||
|
Corporate net operating cash flow |
20 | % | |||||||||
|
Compliance |
20 | % | |||||||||
|
Individual performance |
10 | % | |||||||||
131
The Compensation Committee selected each specific performance measure for use in the annual incentive program because of its importance to our operations. To obtain the maximum possible incentive award, an executive was required to achieve the maximum on all applicable performance measures, including individual performance. The Compensation Committee used different weightings for each named executive officer in order to align annual incentives with the performance measures most relevant to each officer and most within the particular officer's control. Each performance measure is described in greater detail below.
2012 Financial Performance Measures and Performance Goals. The financial component of the annual incentive program encompassed four discrete performance measures: adjusted EBITDA, debt reduction, corporate net operating cash flow and shared services fixed costs. The Compensation Committee used corporate and divisional adjusted EBITDA targets because both the Compensation Committee and our company believe that adjusted EBITDA is the primary measure by which our stockholders measure the financial performance of our company, thereby aligning the interests of management with the interests of our stockholders. Adjusted EBITDA provides an indicator of general economic performance that is not affected by debt restructurings, fluctuations in interest rates or effective tax rates, or levels of depreciation and amortization. The adjusted EBITDA measure used in connection with evaluation of cash performance awards is adjusted on the same basis and for the same factors as the adjusted EBITDA reported in our fiscal year-end earnings release.
Corporate adjusted EBITDA was calculated by eliminating the following from EBITDA: loss on early extinguishment of debt; certain legal settlements and related expenses; EBITDA from discontinued operations; acquisition expenses; expenses associated with the Terminated Merger and related litigation; gain on disposition of businesses/assets; extraordinary (gain) loss on the acquisition of a business; loss (gain) on initial consolidation of subsidiaries; and restructuring, impairment and plant closing and transition costs (credits).
Beyond corporate and divisional adjusted EBITDA, the Compensation Committee also identified corporate net operating cash flow as an important objective for 2012. The Company has long maintained a strategic goal of reducing its debt and maintaining adequate liquidity, which is directly impacted by net operating cash flow. Achievement of the corporate net operating cash flows target constituted 20% of the possible cash performance award for all named executive officers other than the Executive Chairman and the Chief Executive Officer.
For Mr. Esplin in 2012, shared services fixed costs was identified as an important performance goal. Shared services fixed costs measures whether all departments shared at a corporate level by all of our businesses meet, exceed or fall short on yearly budget projections. The Compensation Committee established this goal for Mr. Esplin because he supervises many shared services departments and reducing costs at a corporate level was important to our strategic objectives for 2012.
For 2012, the Compensation Committee established threshold, target and maximum performance goals for each of the following performance measures to be achieved by our company and its divisions:
| |
2012 (in millions) | |||||||||
|---|---|---|---|---|---|---|---|---|---|---|
Performance Criteria
|
Threshold Goal (75% of target) |
Target Goal (100% of target) |
Maximum Goal (120% of target) |
|||||||
Corporate adjusted EBITDA |
$ | 930 | $ | 1,240 | $ | 1,488 | ||||
Corporate net operating cash flow |
$ | 230 | $ | 306 | $ | 367 | ||||
Polyurethanes adjusted EBITDA |
$ | 402 | $ | 536 | $ | 643 | ||||
Pigments adjusted EBITDA |
$ | 315 | $ | 420 | $ | 504 | ||||
Performance Criteria
|
Threshold Goal (90% of target) |
Target Goal (100% of target) |
Maximum Goal (110% of target) |
|||||||
|---|---|---|---|---|---|---|---|---|---|---|
Shared services fixed costs |
$ | 402 | $ | 365 | $ | 329 | ||||
132
At achievement of 75% or less of the applicable target for these components (90% or less for shared services fixed costs), we would not pay the executive any incentive amount for that component. We scale the incentive amounts we pay for each component for achievement of percentages of target goal from 75% to 120% based on a linear progression between these points (from 90% to 110% for shared services fixed costs). In addition, if we achieve corporate adjusted EBITDA of less than 85% of the target goal, the payouts for all other components are capped at their target levels. If corporate adjusted EBITDA is less than 75% of target, then payment of any other component of the incentive award is at the discretion of our Chief Executive Officer and the Compensation Committee. The Compensation Committee believes that requiring a minimum adjusted EBITDA threshold be met to receive a cash performance award both aligns executives' interests with those of stockholders and prevents excessive cash performance award payments in times when our financial performance fails to meet our expectations.
2012 Financial Performance. The 2012 targets were designed to require significant effort to achieve, yet to be realistic enough to incentivize our executive officers' performance. For example, despite a strong year in 2011 and projections of economic headwinds in 2012, the Compensation Committee set the corporate adjusted EBITDA target for 2012 at 102% of 2011 achievement.
For 2012, actual performance and performance as a percentage of targets were as follows:
Performance Criteria
|
2012 Performance (in millions) |
Percentage of target |
|||||
|---|---|---|---|---|---|---|---|
Corporate adjusted EBITDA |
$ | 1,396 | 113 | % | |||
Corporate net operating cash flow |
$ | 463 | 151 | % | |||
Polyurethanes adjusted EBITDA |
$ | 772 | 135 | % | |||
Pigments adjusted EBITDA |
$ | 362 | 84 | % | |||
Shared services fixed costs |
$ | 347 | 105 | % | |||
2012 Compliance Performance Measures, Goals and Performance. The compliance component of the annual incentive program encompassed three discrete performance measures: (i) compliance with rules promulgated under the Sarbanes-Oxley Act of 2002 ("SOX") and corporate policies, (ii) environmental performance objectives and (iii) injury reduction objectives. All of our executive officers other than our Executive Chairman had performance objectives in these three areas. The Compensation Committee tied a portion of the executive officers' cash performance award to performance in these critical areas because it believes that this practice discourages risk-taking that might focus excessively on short-term profits at the sacrifice of the long-term health of our company.
In 2012, achievement of the SOX and corporate policies objective constituted 6.7% of the total incentive award for all named executive officers subject to this component other than our Chief Executive Officer. For 2012, the Compensation Committee established this compliance target as the fulfillment of all required training on corporate policies, the absence of any material weakness in our company's 404 audit as determined by the independent audit firm Deloitte & Touche LLP and the achievement of process safety management targets. As required training on corporate policies was completed, no material weakness in Company's 404 audit was identified and the other objectives were achieved, this objective was achieved at or above target by all named executive officers subject to this component.
In addition, each named executive officer subject to this component other than our Chief Executive Officer also had 6.7% of his annual incentive compensation eligibility tied to environmental performance objectives and 6.7% tied to injury reduction objectives (collectively referred to as "EH&S objectives"). For Mr. Esplin, these EH&S objectives related to the performance of our entire company and were determined by the Compensation Committee to be achieved above target on the environmental performance objectives and above target on the corporate recordable safety achievement
133
for 2012. The EH&S objectives for Mr. Hankins related to only the EH&S performance of the Polyurethanes segment. Mr. Hankins was determined to be above target for both the environmental performance objectives and the safety objectives for 2012. Mr. Turner's EH&S objectives were focused on the Pigments segment and he was below the payout threshold on the safety objectives and above target for the environmental performance objectives. Messrs. Esplin, Hankins and Turner were each awarded for individual performance at target.
For our Chief Executive Officer for 2012, compliance, net operating cash flow and debt reduction together comprised 20% of the total annual incentive award. Each sub-component within this category was not assigned a specific weighting consistent with our Compensation Committee's desire to preserve its discretion in weighting these sub-components relative to then-current business conditions. The Compensation Committee considered the EH&S objectives related to the performance of our entire company and recognized our Chief Executive Officer's contribution to our compliance programs and our record year performance in the case of corporate recordable safety achievement. Therefore, the Compensation Committee awarded our Chief Executive Officer the maximum incentive for which he was eligible for this portion of his annual incentive award. Our Chief Executive Officer also received the full amount available for the individual performance component of his cash performance award based on his contributions to the success of our company and his role in our operations where he fulfills many of the duties of a chief operating officer.
2012 Annual Incentive Awards. Based on the results discussed above for 2012, the Compensation Committee awarded the following cash performance awards, expressed as a percentage of base salary, to the named executive officers:
Officer
|
Percentage of Base Salary Earned |
|||
|---|---|---|---|---|
Peter R. Huntsman |
250 | % | ||
J. Kimo Esplin |
100 | % | ||
Anthony P. Hankins |
110 | % | ||
Simon Turner |
74 | % | ||
In line with cash performance awards made to other named executive officers, the Executive Chairman earned 20.5% of his cash performance award (164% of the maximum available) based upon our record year for corporate adjusted EBITDA and 25% of the cash performance award (the maximum potential amount) based upon our improved net operating cash flow results. In addition to adjusted EBITDA and net operating cash flow, 50% of the Executive Chairman's annual cash performance award for 2012 was based on the achievement of strategic objectives including: overseeing the governance and activities of the Board of Directors; contributing to the development and execution of our strategic plan; supporting the development of our executive leadership team; representing us in dealings with shareholders, customers, suppliers, at industry activities, and with other stakeholders and interested parties; and promoting our mission and values. As the founder of the company with over 40 years experience in the chemical industry, the Executive Chairman also visited numerous customers with whom he retains important contacts. The Compensation Committee awarded the Executive Chairman the full amount for achievement of strategic objectives, noting the high number of meetings with potential strategic partners, key customers, governmental authorities and other valuable contacts initiated and/or attended by the Executive Chairman in 2012. They also noted initiatives led and proactive steps taken by the Executive Chairman as reflecting his fulfillment of the strategic objectives.
For 2013, the Compensation Committee increased the Executive Chairman's maximum potential annual cash performance award to bring him closer to the 75th percentile based upon a review of the compensation levels at other general industrial companies and to provide him with appropriate incentives.
134
Long-Term Equity-Based Compensation. In determining the types and amounts of equity-based awards to grant to each executive officer in 2012, the Compensation Committee considered the value of the equity award made to each named executive officer in 2011, taking into account any expansion of duties and job responsibilities. The Compensation Committee also reviewed analyses provided by Meridian of the types and amounts of awards paid for similar positions at companies in our peer group and other chemical and general industrial companies. The Compensation Committee considered this information to provide a reference point as to how our named executive officers' award levels compare to the comparative companies. For 2012, grants were targeted at levels intended to represent an estimated potential value that, when combined with base salary and cash performance awards, would be near the peer group median value for total direct compensation (which includes base salary, cash performance awards and long-term equity-based compensation).
The value of the awards approved by the Compensation Committee was then converted to a number of shares based on the grant date fair value of the respective award on the date of grant, with 50% of the value allocated to restricted stock awards and 50% of the value allocated to stock option awards (except with respect to Jon M. Huntsman who received only shares of restricted stock). The awards approved for the Chief Executive Officer and other named executive officers for 2012 were as follows:
Officer
|
Stock Options | Restricted Stock | Total Shares | |||||||
|---|---|---|---|---|---|---|---|---|---|---|
Jon M. Huntsman |
0 | 149,142 | 149,142 | |||||||
Peter R. Huntsman |
393,082 | 186,428 | 579,510 | |||||||
J. Kimo Esplin |
78,616 | 37,286 | 115,902 | |||||||
Anthony P. Hankins |
58,962 | 27,964 | 86,926 | |||||||
Simon Turner |
62,893 | 29,828 | 92,721 | |||||||
The restricted stock and stock option awards granted in 2012 are each subject to a three year ratable annual vesting schedule that requires continued service of the named executive officer for a continuous three year period following the date of grant of the award in order to become fully vested in the award. Additional details regarding these grants are provided under "Executive Compensation—Grants of Plan-Based Awards in Fiscal 2012" below. None of the awards granted in 2012 provide for automatic accelerated vesting upon any specified termination of employment events or upon a change in control. See "—Potential Payments Upon Termination or Change in Control" below for more information.
For 2013, the Compensation Committee increased Peter R. Huntsman's long-term incentive award to bring him closer to the targeted 75th percentile.
Compensation Policies and Practices as they Relate to Risk Management
The Compensation Committee believes that our compensation programs have been appropriately designed to provide a level of incentives that does not encourage our executive officers and employees to take unnecessary risks in managing their respective business divisions or functions and carrying out their employment responsibilities. As discussed above, a substantial portion of our executive officers' compensation is performance-based, consistent with our approach to executive compensation. Our annual incentive program is designed to reward annual financial and/or strategic performance in areas considered critical to our short- and long-term success and features a cap on the maximum amount that can be earned in any single year. In addition, we measure performance on a variety of criteria other than Company profit to determine an executive's cash performance award, such as environmental, health and safety goals, cost saving initiatives and corporate compliance. We believe this discourages risk-taking that focuses excessively on short-term profits at the sacrifice of the long-term health of our company. Likewise, our long-term equity incentive awards are directly aligned with long-term stockholder interests through their link to our stock price and multi-year ratable vesting schedules. Our
135
executive stock ownership guidelines further support this long-term focus by requiring our executives to personally own and hold significant levels of our stock. In addition, we intend to implement a claw back policy once SEC regulations are final to discourage risk-taking that focuses excessively on short-term financial performance. In combination, the Compensation Committee believes that the various elements of our executive compensation program sufficiently tie our executives' compensation opportunities to our focus on sustained long-term growth and performance.
Equity Ownership Policy
The Board has adopted Director and Executive Stock Ownership Guidelines (the "Guidelines"), which apply to our named executive officer as well as our directors and other executive officers. The Guidelines were amended and restated in 2012 to provide for annual adjustment of the required ownership level due to changes in annual retainer or base salary, as applicable, and the price of our common stock. The purpose of the Guidelines is to more closely align our directors' and executives' interests with our stockholders' and to encourage them to make decisions that will be in our long-term best interests—through all industry cycles and market conditions. The Guidelines require current directors and executive officers to achieve and maintain share ownership levels of our stock equal to five times base salary for the Chief Executive Officer, two times base salary for all other executive officers and three times annual retainer for directors. The stock ownership requirement is based on the participant's base salary or annual retainer (as applicable) and the closing stock price on July 15 of each calendar year, and typically changes from year to year as a result of changes in annual retainer or base salary and the price of our stock. Shares that count toward satisfaction of the ownership requirement under the Guidelines include:
During any year in which a participant's ownership target is not met, he or she is required to retain at least 50% of net shares delivered through our Stock Incentive Plan ("net shares" means the shares remaining after deducting shares for the payment of taxes and, in the case of stock options, after deducting shares for payment of the exercise price of stock options). Shares acquired by a participant prior to application of the Guidelines to such participant are not subject to the retention restriction. Exclusions for estate planning, gifts to charity, education and primary residence apply to the retention requirement. In addition, hardship exemptions may be available in rare instances. A copy of the Guidelines is available on our website at www.huntsman.com.
As of March 8, 2013, all of our named executive officers were in compliance with the Guidelines. The following table provides the minimum share ownership target of each named executive officer and director and the percentage of the ownership guideline achieved by the officer or director as of the determination date:
Officer / Director
|
Ownership | Share Ownership Target |
% of Guideline Achieved |
|||||||
|---|---|---|---|---|---|---|---|---|---|---|
Jon M. Huntsman |
2x | 174,800 | 100 | % | ||||||
Peter R. Huntsman |
5x | 546,200 | 100 | % | ||||||
J. Kimo Esplin |
2x | 73,400 | 100 | % | ||||||
Anthony P. Hankins |
2x | 78,300 | 100 | % | ||||||
Simon Turner |
2x | 53,900 | 100 | % | ||||||
136
Prohibited Transactions
Our Insider Trading Policy includes trading restrictions for all employees, directors and related persons preventing such persons from engaging in short-term, hedging or speculative transactions in our securities. Such persons may not execute transactions in short sales, options, such as puts and calls, or any other derivative securities or margin accounts. In addition, while we do not prohibit pledging shares, persons subject to the policy must exercise caution when holding securities in a margin account where such securities may be pledged as collateral.
Accounting and Tax Treatment of the Elements of Compensation
We account for stock-based awards, including stock options and restricted stock awards, in accordance with FASB ASC Topic 718 Compensation-Stock Compensation ("FASB ASC Topic 718") (formerly Statement of Financial Accounting Standards No. 123R).
The financial reporting and income tax consequences to us of individual compensation elements are important considerations for the Compensation Committee when it is analyzing the overall level of compensation and the mix of compensation among individual elements. Overall, the Compensation Committee seeks to balance its objective of ensuring an effective compensation package for the named executive officers with the need to maximize the immediate deductibility of compensation—while ensuring an appropriate and transparent impact on reported earnings and other closely followed financial measures.
In making its compensation decisions, the Compensation Committee has considered the implications of Section 162(m) of the Internal Revenue Code. Section 162(m) of the Internal Revenue Code disallows a tax deduction by us for individual executive compensation exceeding $1 million in any taxable year for our Chief Executive Officer and the other three most highly compensated senior executive officers (other than our Chief Executive Officer and Chief Financial Officer), unless the compensation is performance-based under a plan that is approved by our stockholders and that meets certain other technical requirements. As a result, the Compensation Committee designs much of the total compensation packages for the named executive officers to qualify for the exemption of "performance-based" compensation from the deductibility limit. However, the Compensation Committee does have the discretion to design and use compensation elements that may not be deductible within Section 162(m) when necessary for competitive reasons, to attract or retain a key executive, to enable us to retain flexibility in maximizing our pay for performance philosophy or where achieving maximum tax deductibility would not be in our best interest.
137
The following discussion of executive compensation relates to our parent, Huntsman Corporation. However, because all of Huntsman Corporation's operations are conducted by our Company and our subsidiaries, we believe this discussion is material to an understanding of our Company and our subsidiaries. The managers and officers of Huntsman International do not receive any compensation for services rendered in such capacities in addition to compensation provided by our parent. Unless the context requires otherwise, references in this executive compensation discussion to "we," "us," "our," or "our company" refer to Huntsman Corporation, together with its subsidiaries.
Summary Compensation Table
The following table details compensation earned in the fiscal years ending 2012, 2011 and 2010 by our named executive officers. Our compensation policies are discussed in "Compensation Discussion and Analysis" above.
Name and Principal Position
|
Year | Salary | Bonus | Stock awards(1) |
Option awards(2) |
Non-equity incentive plan compensation(3) |
Change in pension value & nonqualified deferred compensation earnings(4) |
All other compensation(5) |
Total | |||||||||||||||||||
|---|---|---|---|---|---|---|---|---|---|---|---|---|---|---|---|---|---|---|---|---|---|---|---|---|---|---|---|---|
Jon M. Huntsman |
2012 | $ | 1,200,000 | — | $ | 2,000,000 | — | $ | 6,494,000 | $ | 1,434,056 | $ | 274,343 | $ | 11,402,399 | |||||||||||||
Executive Chairman |
2011 | $ | 1,200,000 | $ | 4,650,000 | $ | 2,000,000 | — | — | $ | 510,083 | $ | 381,594 | $ | 8,741,677 | |||||||||||||
of the Board |
2010 | $ | 1,200,000 | $ | 3,000,000 | $ | 1,000,000 | — | — | $ | 352,041 | $ | 286,582 | $ | 5,838,623 | |||||||||||||
Peter R. Huntsman |
2012 | $ | 1,575,000 | — | $ | 2,500,000 | $ | 2,500,000 | $ | 4,000,600 | $ | 2,581,548 | $ | 637,952 | $ | 13,795,100 | ||||||||||||
President, CEO & |
2011 | $ | 1,500,000 | — | $ | 2,000,000 | $ | 2,000,000 | $ | 2,655,200 | $ | 1,544,518 | $ | 465,892 | $ | 10,165,610 | ||||||||||||
Director |
2010 | $ | 1,500,000 | — | $ | 2,450,000 | $ | 1,050,000 | $ | 3,000,000 | $ | 1,115,375 | $ | 493,053 | $ | 9,608,428 | ||||||||||||
J. Kimo Esplin |
2012 | $ | 587,975 | — | $ | 500,000 | $ | 500,000 | $ | 594,100 | $ | 438,697 | $ | 140,481 | $ | 2,761,253 | ||||||||||||
Executive VP and |
2011 | $ | 557,300 | — | $ | 500,000 | $ | 500,000 | $ | 340,600 | $ | 285,523 | $ | 106,120 | $ | 2,289,543 | ||||||||||||
CFO |
2010 | $ | 504,200 | — | $ | 525,000 | $ | 225,000 | $ | 401,100 | $ | 232,134 | $ | 153,177 | $ | 2,040,611 | ||||||||||||
Anthony P. Hankins(6) |
2012 | $ | 766,875 | — | $ | 375,000 | $ | 375,000 | $ | 848,200 | $ | 188,703 | $ | 445,779 | $ | 2,999,557 | ||||||||||||
CEO Asia Pacific and |
2011 | $ | 696,000 | — | $ | 500,000 | $ | 500,000 | $ | 450,000 | $ | 2,629,244 | $ | 276,276 | $ | 5,051,520 | ||||||||||||
Division President, Polyurethanes |
2010 | $ | 537,600 | — | $ | 525,000 | $ | 225,000 | $ | 314,200 | $ | 1,016,074 | $ | 348,185 | $ | 2,966,059 | ||||||||||||
Simon Turner(7) |
2012 | $ | 489,689 | — | $ | 400,000 | $ | 400,000 | $ | 357,281 | $ | 2,988,544 | $ | 121,426 | $ | 4,756,940 | ||||||||||||
Division President, Pigments |
2011 | $ | 421,477 | $ | 184,761 | $ | 426,250 | $ | 426,250 | $ | 440,100 | $ | 333,236 | $ | 129,612 | $ | 2,361,686 | |||||||||||
138
officer. The table below details the components reported in the "All other compensation" column of the Summary Compensation Table for 2012. Amounts in the table were either paid directly by us or were reimbursed by us to the named executive officers.
| |
|
|
|
|
|
Company Contributions | |
|||||||||||||||||||||||||||||||||
|---|---|---|---|---|---|---|---|---|---|---|---|---|---|---|---|---|---|---|---|---|---|---|---|---|---|---|---|---|---|---|---|---|---|---|---|---|---|---|---|---|
Name
|
Personal Use Auto |
Personal Use Aircraft |
Air Travel Allowance |
Foreign Assignment |
Loan Balance |
401(k) Plan | Supp Savings Plan |
Money Purchase Pension |
SEMPP | UK DB Pension |
UK DC Pension |
Tax Gross-up |
Total | |||||||||||||||||||||||||||
Jon M. Huntsman(a) |
$ | 3,496 | $ | 270,847 | — | — | — | — | — | — | — | — | — | — | $ | 274,343 | ||||||||||||||||||||||||
Peter R. Huntsman(b) |
$ | 0 | $ | 18,090 | — | — | — | $ | 5,000 | $ | 3,500 | $ | 20,000 | $ | 582,736 | — | — | $ | 8,626 | $ | 637,952 | |||||||||||||||||||
J. Kimo Esplin(c) |
$ | 8,399 | — | $ | 2,000 | — | — | $ | 5,000 | $ | 20,712 | $ | 20,000 | $ | 82,846 | — | — | $ | 1,524 | $ | 140,481 | |||||||||||||||||||
Anthony P. Hankins(d) |
— | — | — | $ | 112,869 | — | $ | 5,000 | $ | 15,003 | $ | 20,000 | $ | 124,198 | $ | 58,587 | — | $ | 110,122 | $ | 445,779 | |||||||||||||||||||
Simon Turner(e) |
$ | 15,151 | — | — | — | $ | 5,286 | — | — | — | — | — | $ | 92,811 | $ | 8,178 | $ | 121,426 | ||||||||||||||||||||||
139
Grants of Plan-Based Awards in Fiscal 2012
The following table provides information about non-equity cash performance awards granted through our annual incentive program and equity awards granted through our Stock Incentive Plan to the named executive officers in 2012.
| |
|
Estimated Future Payouts Under Non-Equity Incentive Plan Awards(1) |
|
|
|
Grant Date Fair Value of Stock and Option Awards(5) |
|||||||||||||||||||
|---|---|---|---|---|---|---|---|---|---|---|---|---|---|---|---|---|---|---|---|---|---|---|---|---|---|
| |
|
|
|
Exercise or Base Price of Option Awards(4) |
|||||||||||||||||||||
| |
Grant Date |
All Other Stock Awards(2) |
All Other Option Awards(3) |
||||||||||||||||||||||
Name
|
Threshold | Target | Maximum | ||||||||||||||||||||||
| |
|
($) |
($) |
($) |
(#) |
(#) |
($/Sh) |
($) |
|||||||||||||||||
Jon M. Huntsman |
02/01/12 | — | — | $ | 6,800,000 | 149,142 | — | — | $ | 2,000,000 | |||||||||||||||
Peter R. Huntsman |
02/01/12 | $ | 0 | $ | 2,240,000 | $ | 4,480,000 | — | — | — | — | ||||||||||||||
|
02/01/12 | — | — | — | 186,428 | — | — | $ | 2,500,000 | ||||||||||||||||
|
02/01/12 | — | — | — | — | 393,082 | $ | 13.41 | $ | 2,500,000 | |||||||||||||||
J. Kimo Esplin |
02/01/12 | $ | 0 | $ | 355,380 | $ | 710,760 | — | — | — | — | ||||||||||||||
|
02/01/12 | — | — | — | 37,286 | — | — | $ | 500,000 | ||||||||||||||||
|
02/01/12 | — | — | — | — | 78,616 | $ | 13.41 | $ | 500,000 | |||||||||||||||
Anthony P. Hankins |
02/01/12 | $ | 0 | $ | 463,500 | $ | 927,000 | — | — | — | — | ||||||||||||||
|
02/01/12 | — | — | — | 27,964 | — | — | $ | 375,000 | ||||||||||||||||
|
02/01/12 | — | — | — | — | 58,962 | $ | 13.41 | $ | 375,000 | |||||||||||||||
Simon Turner |
02/01/12 | $ | 0 | $ | 290,677 | $ | 581,354 | — | — | — | — | ||||||||||||||
|
02/01/12 | — | — | — | 29,828 | — | — | $ | 400,000 | ||||||||||||||||
|
02/01/12 | — | — | — | — | 62,893 | $ | 13.41 | $ | 400,000 | |||||||||||||||
Narrative Disclosure to Summary Compensation Table and Grants of Plan-Based Awards in Fiscal 2012
The following is a discussion of material factors necessary to obtain an understanding of the information disclosed under "—Summary Compensation Table" and "—Grants of Plan-Based Awards in Fiscal 2012."
140
Foreign Assignment
Consistent with the Company's foreign assignment policy, Mr. Hankins receives payments in connection with his foreign assignment to work in the United States. For more information regarding Mr. Hankins' letter agreement with our subsidiary, detailing the terms of his foreign assignment, please see "Compensation Discussion and Analysis—Elements of Executive Compensation—Employment Agreements" above.
Air Travel Allowance
Pursuant to our Business Expense and Travel Policy, we offer all employees the opportunity to receive an air travel allowance to encourage cost savings to us. When an employee is authorized to fly business class but chooses to fly coach class, the Company pays the employee an amount equal to half the difference between the lowest roundtrip business class ticket and the fare paid up to a maximum of $2,000.
Annual Cash Performance Incentive Awards
For the named executive officers (other than Jon M. Huntsman who was eligible for a maximum award of $6.8 million), our annual incentive program for 2012 provided for target cash performance awards of 140% of base salary for our Chief Executive Officer and 60% of base salary for the other named executive officers, with maximum possible annual incentive compensation set at 280% of base salary for our Chief Executive Officer and 120% of base salary for the other named executive officers. Potential payout of individual cash performance awards was dependent upon both company performance and individual contributions to our success. The performance measures were selected for use in the annual incentive program because of their importance to our operations. See "—2012 Executive Compensation—Annual Incentive Program" for more information regarding the applicable performance measures. To achieve the maximum possible incentive award, an executive must achieve the maximum on each of the applicable performance components and for their individual performance.
Based on the results for 2012, the Compensation Committee awarded the following cash performance awards to the named executive officers:
Officer
|
Percentage of Base Salary Earned |
|||
|---|---|---|---|---|
Peter R. Huntsman |
250 | % | ||
J. Kimo Esplin |
100 | % | ||
Anthony P. Hankins |
110 | % | ||
Simon Turner |
74 | % | ||
Jon M. Huntsman's annual incentive award includes objective performance and strategic criteria but does not include a target award as a percentage of his base salary. For 2012, Jon M. Huntsman was awarded a cash performance award equal to 95.5% of his maximum potential award amount, or $6,494,000. See "—2012 Executive Compensation—Annual Incentive Program" for more information regarding this award. The dollar amounts actually paid to the named executive officers as cash performance awards for 2012 are reported in the Non-Equity Incentive Plan Compensation column of the Summary Compensation Table.
Equity Awards under the Stock Incentive Plan
For executive officers, other than Jon M. Huntsman, we grant awards of restricted stock and stock options. We grant Jon M. Huntsman an award of restricted stock only. Restricted stock awards vest ratably in three equal annual installments beginning on the first anniversary of the grant date. During
141
the restriction period, each restricted share entitles the individual to vote such share and to accrue quarterly payments by us equal to the quarterly dividend on one share of our common stock. The option awards vest ratably in three equal annual installments and become exercisable beginning on the first anniversary of the grant date. See "—Potential Payments upon Termination or Change in Control" for the treatment of equity awards in certain termination scenarios and upon the occurrence of a change in control.
Explanation of Amount of Salary and Cash Performance Awards in Proportion to Total Compensation
The key elements of direct compensation for the named executive officers in 2012 were base salary, cash performance awards and equity-based compensation. The Compensation Committee strives to align the relative proportion of each element of total direct compensation with the competitive market and our objectives, as well as to preserve the flexibility to respond to the continually changing global environment in which we operate. Generally, as employees move to higher levels of responsibility with greater ability to influence our results, the percentage of performance-based pay will increase. The Compensation Committee's goal is also to strike the appropriate balance between annual and long-term incentives, and it may adjust the allocation of pay each year to best support our objectives. The mix of these elements during 2012 for each of the named executive officers is illustrated in more detail under "Compensation Discussion and Analysis—2012 Executive Compensation."
142
Outstanding Equity Awards at 2012 Fiscal Year-End
The following table provides information on the current holdings of stock options and stock awards by the named executive officers from our Stock Incentive Plan. The market value of the stock awards is based on the closing market price of our stock on December 31, 2012, which was $15.90.
| |
|
Option Awards(1) | Stock Awards(2) | |||||||||||||||||||
|---|---|---|---|---|---|---|---|---|---|---|---|---|---|---|---|---|---|---|---|---|---|---|
| |
|
Number of Securities Underlying Unexercised Options |
|
|
Number of Shares or Units of Stock that have not vested |
|
||||||||||||||||
| |
|
|
|
Market Value of Shares or Units of Stock that have not vested(3) |
||||||||||||||||||
| |
Date of Award |
Option Exercise Price |
Option Expiration Date |
|||||||||||||||||||
Name
|
Exercisable | Unexercisable | ||||||||||||||||||||
| |
|
(#) |
(#) |
($) |
|
(#) |
($) |
|||||||||||||||
Jon M. Huntsman(4) |
02/01/12 | — | — | — | — | 149,142 | $ | 2,371,358 | ||||||||||||||
|
02/02/11 | — | — | — | — | 75,800 | $ | 1,205,220 | ||||||||||||||
|
02/23/10 | — | — | — | — | 24,691 | $ | 392,587 | ||||||||||||||
Peter R. Huntsman(5) |
02/01/12 |
— |
393,082 |
$ |
13.41 |
02/01/22 |
186,428 |
$ |
2,964,205 |
|||||||||||||
|
02/02/11 | 72,307 | 144,613 | $ | 17.59 | 02/02/21 | 75,800 | $ | 1,205,220 | |||||||||||||
|
02/23/10 | 100,143 | 50,072 | $ | 13.50 | 02/23/20 | 60,494 | $ | 961,855 | |||||||||||||
|
03/02/09 | 400,000 | — | $ | 2.59 | 03/02/19 | — | — | ||||||||||||||
|
02/20/07 | 464,785 | — | $ | 20.66 | 02/20/17 | — | — | ||||||||||||||
|
03/01/06 | 374,618 | — | $ | 20.50 | 03/01/16 | — | — | ||||||||||||||
|
02/10/05 | 454,950 | — | $ | 23.00 | 02/10/15 | — | — | ||||||||||||||
J. Kimo Esplin(6) |
02/01/12 |
— |
78,616 |
$ |
13.41 |
02/01/22 |
37,286 |
$ |
592,847 |
|||||||||||||
|
02/02/11 | 18,077 | 36,153 | $ | 17.59 | 02/02/21 | 18,950 | $ | 301,305 | |||||||||||||
|
02/23/10 | 21,459 | 10,730 | $ | 13.50 | 02/23/20 | 12,963 | $ | 206,112 | |||||||||||||
|
03/02/09 | 428,571 | — | $ | 2.59 | 03/02/19 | — | — | ||||||||||||||
|
02/20/07 | 110,663 | — | $ | 20.66 | 02/20/17 | — | — | ||||||||||||||
|
03/01/06 | 93,655 | — | $ | 20.50 | 03/01/16 | — | — | ||||||||||||||
|
02/10/05 | 157,483 | — | $ | 23.00 | 02/10/15 | — | — | ||||||||||||||
Anthony P. Hankins(7) |
02/01/12 |
— |
58,962 |
$ |
13.41 |
02/01/22 |
27,964 |
$ |
444,628 |
|||||||||||||
|
02/02/11 | 18,077 | 36,153 | $ | 17.59 | 02/02/21 | 18,950 | $ | 301,305 | |||||||||||||
|
02/23/10 | 21,459 | 10,730 | $ | 13.50 | 02/23/20 | 12,963 | $ | 206,112 | |||||||||||||
|
03/02/09 | 226,735 | — | $ | 2.59 | 03/02/19 | — | — | ||||||||||||||
|
02/20/07 | 66,398 | — | $ | 20.66 | 02/20/17 | — | — | ||||||||||||||
|
03/01/06 | 56,193 | — | $ | 20.50 | 03/01/16 | — | — | ||||||||||||||
|
02/10/05 | 157,483 | — | $ | 23.00 | 02/10/15 | — | — | ||||||||||||||
Simon Turner(8) |
02/01/12 |
— |
62,893 |
$ |
13.41 |
02/01/22 |
29,828 |
$ |
474,265 |
|||||||||||||
|
02/02/11 | 15,411 | 30,820 | $ | 17.59 | 02/02/21 | 16,155 | $ | 256,865 | |||||||||||||
|
02/23/10 | 14,306 | 7,153 | $ | 13.50 | 02/23/20 | 8,642 | $ | 137,408 | |||||||||||||
|
03/02/09 | 153,061 | — | $ | 2.59 | 03/02/19 | — | — | ||||||||||||||
|
02/20/07 | 22,133 | — | $ | 20.66 | 02/20/17 | — | — | ||||||||||||||
|
03/01/06 | 18,731 | — | $ | 20.50 | 03/01/16 | — | — | ||||||||||||||
|
02/10/05 | 13,998 | — | $ | 23.00 | 02/10/15 | — | — | ||||||||||||||
143
above. As of December 31, 2012, restricted stock awards granted on February 1, 2012 vest as to 331/3% on February 1, 2013, as to 662/3% on February 1, 2014, and as to 100% on February 1, 2015.
Option Exercises and Stock Vested During Fiscal 2012
The following table presents information regarding the vesting during 2012 of restricted stock awards previously granted to the named executive officers. No exercises of stock options by named executive officers occurred during 2012.
| |
Stock Awards(1) | ||||||
|---|---|---|---|---|---|---|---|
Name
|
Number of Shares Acquired on Vesting |
Value Realized on Vesting |
|||||
| |
(#) |
($) |
|||||
Jon M. Huntsman |
62,592 | $ | 841,810 | ||||
Peter R. Huntsman |
231,727 | $ | 3,177,231 | ||||
J. Kimo Esplin |
85,501 | $ | 1,177,703 | ||||
Anthony P. Hankins |
71,988 | $ | 990,143 | ||||
Simon Turner |
50,504 | $ | 694,099 | ||||
144
| |
|
|
|
Restricted Stock Vested |
Shares Withheld for Tax Obligation |
Net Shares Issued | ||||||||||||||||||||||
|---|---|---|---|---|---|---|---|---|---|---|---|---|---|---|---|---|---|---|---|---|---|---|---|---|---|---|---|---|
Name
|
Grant Date |
Vest Date |
Closing Price on Vest Date |
(#) | Value Realized |
(#) | Value Paid |
(#) | Market Value |
|||||||||||||||||||
Jon M. Huntsman |
02/02/11 | 02/02/12 | $ | 13.39 | 37,901 | $ | 507,494 | 11,952 | $ | 160,037 | 25,949 | $ | 347,457 | |||||||||||||||
|
02/23/10 | 02/23/12 | $ | 13.54 | 24,691 | $ | 334,316 | 7,766 | $ | 105,152 | 16,925 | $ | 229,165 | |||||||||||||||
|
62,592 | $ | 841,810 | 19,718 | $ | 265,189 | 42,874 | $ | 576,622 | |||||||||||||||||||
Peter R. Huntsman |
02/02/11 | 02/02/12 | $ | 13.39 | 37,901 | $ | 507,494 | 10,025 | $ | 134,235 | 27,876 | $ | 373,260 | |||||||||||||||
|
02/23/10 | 02/23/12 | $ | 13.54 | 60,493 | $ | 819,075 | 18,413 | $ | 249,312 | 42,080 | $ | 569,763 | |||||||||||||||
|
03/02/09 | 03/02/12 | $ | 13.88 | 133,333 | $ | 1,850,662 | 48,600 | $ | 674,568 | 84,733 | $ | 1,176,094 | |||||||||||||||
|
231,727 | $ | 3,177,231 | 77,038 | $ | 1,058,115 | 154,689 | $ | 2,119,117 | |||||||||||||||||||
J. Kimo Esplin |
02/02/11 | 02/02/12 | $ | 13.39 | 9,475 | $ | 126,870 | 3,177 | $ | 42,540 | 6,298 | $ | 84,330 | |||||||||||||||
|
02/23/10 | 02/23/12 | $ | 13.54 | 12,963 | $ | 175,519 | 4,079 | $ | 55,230 | 8,884 | $ | 120,289 | |||||||||||||||
|
03/02/09 | 03/02/12 | $ | 13.88 | 63,063 | $ | 875,314 | 23,574 | $ | 327,207 | 39,489 | $ | 548,107 | |||||||||||||||
|
85,501 | $ | 1,177,703 | 30,830 | $ | 424,977 | 54,671 | $ | 752,726 | |||||||||||||||||||
Anthony P. Hankins |
02/02/11 | 02/02/12 | $ | 13.39 | 9,475 | $ | 126,870 | 2,626 | $ | 35,162 | 6,849 | $ | 91,708 | |||||||||||||||
|
02/23/10 | 02/23/12 | $ | 13.54 | 12,963 | $ | 175,519 | 3,429 | $ | 46,429 | 9,534 | $ | 129,090 | |||||||||||||||
|
03/02/09 | 03/02/12 | $ | 13.88 | 49,550 | $ | 687,754 | 16,278 | $ | 225,939 | 33,272 | $ | 461,815 | |||||||||||||||
|
71,988 | $ | 990,143 | 22,333 | $ | 307,530 | 49,655 | $ | 682,613 | |||||||||||||||||||
Simon Turner |
02/02/11 | 02/02/12 | $ | 13.39 | 8,078 | $ | 108,164 | 4,201 | $ | 56,251 | 3,877 | $ | 51,913 | |||||||||||||||
|
02/23/10 | 02/23/12 | $ | 13.54 | 8,642 | $ | 117,013 | 4,494 | $ | 60,849 | 4,148 | $ | 56,164 | |||||||||||||||
|
03/02/09 | 03/02/12 | $ | 13.88 | 33,785 | $ | 468,922 | 17,568 | $ | 243,844 | 16,216 | $ | 225,078 | |||||||||||||||
|
50,504 | $ | 694,099 | 26,263 | $ | 360,944 | 24,241 | $ | 333,155 | |||||||||||||||||||
Pension Benefits in Fiscal 2012
The table below sets forth information on the pension benefits for the named executive officers under our pension plans, each of which is more fully described in the narrative following the table. The amounts reported in the table below equal the present value of the accumulated benefit at December 31, 2012 for the named executive officer under each plan based upon the assumptions described below.
Name
|
Plan Name | Number of Years of Credited Service(1) |
Present Value of Accumulated Benefit(2) |
Payments During Last Fiscal Year |
||||||||
|---|---|---|---|---|---|---|---|---|---|---|---|---|
| |
|
(#) |
($) |
($) |
||||||||
Jon M. Huntsman |
Huntsman Defined Benefit Pension Plan | 35.167 | $ | 103,119 | $ | 9,935 | ||||||
|
Supplemental Executive Retirement Plan | $ | 2,308,611 | $ | 3,137,512 | |||||||
Peter R. Huntsman |
Huntsman Defined Benefit Pension Plan | 29.417 | $ | 736,597 | — | |||||||
|
Supplemental Executive Retirement Plan | $ | 9,381,151 | — | ||||||||
J. Kimo Esplin |
Huntsman Defined Benefit Pension Plan | 18.417 | $ | 454,413 | — | |||||||
|
Supplemental Executive Retirement Plan | $ | 1,413,886 | — | ||||||||
Anthony P. Hankins(3) |
Huntsman Pension Scheme (U.K.) | 33.225 | $ | 6,559,021 | — | |||||||
Simon Turner(4) |
Tioxide Pension Fund | 22.833 | $ | 706,863 | — | |||||||
|
Huntsman Global Pension Scheme | $ | 616,547 | — | ||||||||
|
Huntsman Top-Up Payment | $ | 2,800,664 | — | ||||||||
145
In the U.S., we sponsor the Huntsman Defined Benefit Pension Plan (the "Huntsman Pension Plan"), a tax-qualified defined benefit pension plan. Effective July 1, 2004, the formula used to calculate future benefits under the Huntsman Pension Plan was changed to a cash balance formula. The benefits accrued under the plan as of June 30, 2004 were used to calculate opening cash balance accounts. Of our named executive officers, Messrs. Jon M. Huntsman, Peter R. Huntsman and Esplin were participants in the Huntsman Pension Plan in 2012.
The Huntsman Supplemental Executive Retirement Plan (the "Supplemental Executive Retirement Plan") is a non-qualified supplemental pension plan that provides benefits for designated executive officers based on certain compensation amounts not included in the calculation of benefits payable under the Huntsman Pension Plan. Of our named executive officers, Messrs. Jon M. Huntsman, Peter R. Huntsman and Esplin were participants in the Supplemental Executive Retirement Plan in 2012. The compensation taken into account for these named executive officers under the Supplemental Executive Retirement Plan includes amounts in excess of the qualified plan limitations. The Supplemental Executive Retirement Plan benefit is calculated as the difference between (1) the benefit determined using the Huntsman Pension Plan formula with unlimited base salary plus cash performance awards, and (2) the benefit determined using base salary plus cash performance awards as limited by federal regulations.
The Huntsman Pension Plan and the Supplemental Executive Retirement Plan are described in greater detail in "Compensation Discussion and Analysis" above. Both plans express benefits as a hypothetical cash balance account established in each participant's name.
Under these plans, a participant's account receives two forms of credits: "pay credits" and "interest credits." Pay credits equal a percentage of a participant's compensation and are credited to a participant's account on an annual basis. "Compensation" for this purpose includes both salary and non-equity incentive plan compensation as described above under "—Summary Compensation Table." "Compensation" under the Huntsman Pension Plan is subject to the compensation limit applicable to tax-qualified plans of $250,000 for 2012. The benefit that would be available under the Huntsman Pension Plan, but for this limitation, is provided under the Supplemental Executive Retirement Plan. The applicable pay credit percentage ranges between 9% and 12% depending on the participant's combined age and years of service as of the start of each plan year. The 2012 pay credits for the Huntsman Pension Plan are $30,000 for Jon M. Huntsman, $26,250 for Peter R. Huntsman, and $22,500 for Mr. Esplin. The 2012 pay credits for the Supplemental Executive Retirement Plan are $1,368,048, $764,841, and $93,202 for Messrs. Jon M. Huntsman, Peter R. Huntsman and Esplin, respectively.
146
"Interest credits" for a plan year are based on the 30-year U.S. Treasury yield for November of the prior year. The minimum annual interest credit rate is 5.0%. The 2012 interest credits for the Huntsman Pension Plan are $4,371 for Jon M. Huntsman, and $27,125 and $16,560 for Messrs. Peter R. Huntsman, and Esplin, respectively. The 2012 interest credits for the Supplemental Executive Retirement Plan are $46,136, $324,962, and $50,422 for Messrs. Jon M. Huntsman, Peter R. Huntsman and Esplin, respectively.
Pursuant to the terms of the Huntsman Pension Plan, at termination of employment for any reason after having completed at least three years of service, a participant will receive the amount then credited to the participant's cash balance account in an actuarially equivalent joint and survivor annuity (if married) or single life annuity (if not married). Participants may also choose from other optional forms of benefit, including a lump-sum payment in the amount of the cash balance account. For participants in the prior Supplemental Executive Retirement Plan (including named executive officers Peter R. Huntsman and Mr. Esplin), the Huntsman Pension Plan also includes a minimum benefit that guarantees that a participant's benefit will not be less than the benefit accrued under the prior formula at transition (July 1, 2004) plus the benefit attributable to pay credits, with interest credits, beginning July 1, 2004. Under the prior plan provisions, the monthly basic benefit equaled one-twelfth of 1.4% of average earnings multiplied by pension service prior to January 1, 2000, plus 1.5% of average earnings multiplied by pension service after January 1, 2000, less 50% of the Social Security benefit prorated by pension service, payable as a life annuity to the participant. The prior Supplemental Executive Retirement Plan mirrored the benefit from the Huntsman Pension Plan. For participants taking an annuity, early retirement reductions apply if retirement occurs before normal retirement age (defined as age 65 with 5 years of service) and on or after the earlier of (1) both attaining age 50 and age plus vesting service equal to 80 or more, or (2) age 55 with 10 years of vesting service. The effect of these reductions is to reduce the annuity amount paid by 5% per year for each year beginning at age 59 until age 50 where the amount paid would be 50%.
Vested benefits under the Supplemental Executive Retirement Plan are paid 30 days following a participant's separation from service, unless the participant is a "specified employee" for purposes of Section 409A of the Internal Revenue Code ("Section 409A"), in which case payment will be delayed for six months. Vested benefits are paid in a single cash lump sum unless the participant elects: (1) a life annuity, (2) a life annuity with payments guaranteed for 120 months, or (3) a joint and survivor annuity providing survivor benefits equal to 50 or 100 percent (as elected by the participant) of the annuity payable to the participant. Benefits are unvested until the earlier to occur of: (1) completion of ten years of service, (2) termination on account of death, "Disability," on or after attainment of "Normal Retirement Age," or (3) termination without "Reasonable Cause." Each named executive officer is fully vested in his benefit under the Supplemental Executive Retirement Plan. Jon M. Huntsman is currently receiving distributions from his Supplemental Executive Retirement account in connection with his prior retirement from the Company in 2001. Jon M. Huntsman continued to serve as Chairman of the Board from that time until 2009, when we entered into a new employment arrangement with him whereby he serves as our Executive Chairman.
"Disability" under the Huntsman Pension Plan provides that, for a disabled participant, service and benefit accruals continue for 24 months. After 24 months, disabled participants are deemed to be terminated participants. Disability is defined as total and permanent disability, as determined by the administrator of our long-term disability plan.
"Normal Retirement Age" is retirement eligibility upon age 65 with 5 years of service under the Huntsman Pension Plan and Supplemental Executive Retirement Plan.
"Reasonable Cause" means: (1) the grossly negligent, fraudulent, dishonest or willful violation of any law or the material violation of any of our significant policies that materially and adversely affects us, or (2) the failure of the participant to substantially perform his duties.
147
We also sponsor retirement benefit plans in connection with our operations in the U.K. Of our named executive officers, Mr. Hankins participates in the Huntsman Pension Scheme for U.K. associates in the Polyurethanes segment. Mr. Turner participates in the Huntsman UK Pension Plan (a defined contribution pension plan) with trailing participation in the nonqualified Huntsman Global Pension Scheme and the qualified Tioxide Pension Fund for all U.K. associates in the Pigments segment. The Huntsman Pension Scheme in which Mr. Hankins participates provides standard benefits equal to 2.2% (1/45th) of final pensionable compensation up to $17,840 (£11,250), plus 1.83% of final pensionable compensation above $17,840 (£11,250), minus 1/50th of the current State pension benefit, times actual years of service; subject to a maximum limit of 2/3rd of final pensionable compensation times actual years of service, divided by total possible service to retirement. Final pensionable compensation is gross salary received during the 12 months prior to retirement less any profit sharing payments. Normal retirement age for the Huntsman Pension Scheme in the U.K. is age 62 and participants retiring as early as age 50 may receive a reduced pension amount between 37% at age 50 and 66.7% at age 61, which is increased by 2.5% per year until the participant reaches 62. These benefits also include U.K. social security benefits. As of December 31, 2012, Mr. Hankins had approximately 32 years of service in the U.K., and is fully vested in these benefits. The Huntsman Pension Scheme (U.K.) was frozen to new participants as of February 29, 2012 and, after that date, benefits for current participants under the plan will only increase based on changes in salary.
Mr. Turner participates in a defined benefit pension arrangement through the tax-qualified Tioxide Pension Fund for service with us prior to January 1, 2011. The Tioxide Pension Fund was a traditional defined benefit pension plan that provided benefit accruals based on final average earnings, with a typical accrual rate of 1/70th and a normal retirement age of 62. Defined benefit pension arrangements for the Tioxide Pension Fund were closed for Pigments associates on December 31, 2010, and arrangements were shifted to participation in the defined contribution Huntsman UK Pension Plan, on January 1, 2011. See "Compensation Discussion and Analysis—Elements of Executive Compensation—Retirement and Savings Plans" for additional information regarding the Huntsman UK Pension Plan. For as long as associates remain with us, they retain a link between future pensionable salary growth and accrued service to the date of closure of the Tioxide Pension Fund. The Huntsman Global Pension Scheme is a non-registered defined benefit pension plan designed to restore benefits that cannot be provided in a registered plan due to pension or tax regulations or due to international assignments. During 2012, a top-up payment agreement was put in place to make up for benefits lost due to salary restrictions in the U.K and provides benefits under the Huntsman Global Pension Scheme based on Mr. Turner's uncapped final salary. Mr. Turner had approximately 23 years of service in the U.K., and is fully vested in benefits from these plans.
Nonqualified Deferred Compensation in Fiscal 2012
The table below provides information on the nonqualified deferred compensation of the named executive officers in 2012 under the Supplemental Savings Plan and the SEMPP. All of our named executive officers based in the United States participate in these plans with the exception of Simon Turner who is based in the U.K. and Jon M. Huntsman who is not eligible for the SEMPP and does not participate in the Supplemental Savings Plan. The named executive officers cannot withdraw any
148
amounts from their deferred compensation balances for a period of six months following the date of their termination of employment or retirement. No withdrawals or distributions were made in 2012.
Name
|
Executive Contributions in Last FY(1) |
Huntsman Contributions in Last FY(2) |
Aggregate Earnings in Last FY(3) |
Aggregate Withdrawals/ Distributions |
Aggregate Balance at Last FYE(4) |
|||||||||||
|---|---|---|---|---|---|---|---|---|---|---|---|---|---|---|---|---|
Jon M. Huntsman |
— | — | — | — | — | |||||||||||
Peter R. Huntsman |
— | $ | 586,236 | (5) | $ | 46,607 | — | $ | 3,294,365 | (6) | ||||||
J. Kimo Esplin |
$ | 175,806 | $ | 103,558 | (7) | $ | 72,278 | — | $ | 2,529,394 | (8) | |||||
Anthony P Hankins |
$ | 23,006 | $ | 139,201 | (9) | $ | 39,658 | — | $ | 1,586,809 | (10) | |||||
We provide executive officers based in the United States the opportunity to participate in up to four defined contribution savings plans: (1) the 401(k) Plan; (2) the Supplemental Savings Plan; (3) the MPP; and (4) the SEMPP. With the exception of Jon M. Huntsman and Mr. Turner who is based in the U.K., our named executive officers are participants in each of these savings plans. Jon M. Huntsman is not eligible for the MPP or the SEMPP and does not participate in the 401(k) Plan or the Supplemental Savings Plan. The 401(k) Plan is a tax-qualified broad-based employee savings plan; employee contributions up to 25% of base salary and annual incentive cash performance awards are permitted up to dollar limits established annually by the Internal Revenue Service ("IRS").
The Supplemental Savings Plan is a non-qualified plan and allows designated executive officers to defer up to 75% of eligible salary and up to 75% of annual incentive cash performance awards. The
149
Supplemental Savings Plan also provides benefits for participants in the form of company matching contributions based on certain compensation amounts not included in the calculation of benefits payable under the 401(k) Plan because of limits under federal law on compensation that can be counted and amounts that can be allocated to accounts within the 401(k) Plan. As required by Section 409A, deferrals must be elected in the calendar year preceding the year in which the compensation deferred is earned.
The MPP is a tax-qualified broad-based employee savings plan. Our contributions vary by service: 0.5% of compensation for 3 to 6 years of service, 3% of compensation for 7 to 9 years of service and 8% of compensation for 10+ years of service, subject to IRS limits. Employees can direct the investments for their accounts. The MPP has been closed to new participants since January 2004. The Company continues to make annual contributions on behalf of existing MPP participants.
The SEMPP is a non-qualified plan for senior executives that provides for benefits not allowed under the MPP due to IRS compensation and allocation limits. Employees are vested in this account upon meeting 10 years of service, upon attaining normal retirement age, death or disability, or upon termination of employment without reasonable cause. The SEMPP permits distributions following termination of employment as a lump sum, life annuity, joint & survivor annuity or monthly installments over a period not more than 10 years.
The Supplemental Savings Plan provides for payment of benefits to a participant upon the earlier to occur of a "Change of Control" or a termination of the participant's service. Benefits paid upon a "Change of Control" are always paid in a single lump sum payment. Benefits payable upon a separation from service can be made (at the election of the participant) in either a single lump sum payment or in substantially equal installments over a period selected by the participant that does not exceed ten years. In addition, the participant may request distribution of all or portion of the amounts credited to his account upon an "Unforeseeable Emergency." Payments upon separation from service will be delayed six months in accordance with Section 409A in the event a participant is a "specified employee" for purposes of Section 409A.
The Supplemental Savings Plan defines a "Change of Control" as the occurrence of either of the following events:
In addition, any "Change of Control" must also constitute a change in control for purposes of Section 409A.
A participant will be deemed to have incurred an "Unforeseeable Emergency" if he suffers a severe financial hardship resulting from (1) an illness or accident with respect to him, his spouse or a dependent, (2) the loss of property due to casualty or (3) other similar extraordinary and unforeseeable circumstances arising as a result of events beyond the participant's control determined by us to constitute an unforeseeable emergency for purposes of Section 409A.
The SEMPP provides for benefits that would not otherwise be available under our MPP due to statutory limitations imposed on tax-qualified retirement plans. The plan provides for the payment of vested benefits upon a participant's separation from service except to the extent the participant is a "specified employee" for purposes of Section 409A in which case benefits will be delayed six months. A participant's benefits vest on the earlier to occur of (1) completion of ten years of service,
150
(2) termination on account of death, "Disability," or on or after attainment of "Normal Retirement Age," or (3) termination without "Reasonable Cause." "Disability," "Normal Retirement Age," and "Reasonable Cause" have the same meanings as set forth above in our description of the Supplemental Executive Retirement Plan under "—Pension Benefits in Fiscal 2012," except that a "Disability" must also constitute a disability for purposes of Section 409A. Each named executive officer is currently vested in his SEMPP benefit.
Benefits are payable in one of the following forms elected by a participant:
Participants are entitled to elect the investment of their accounts under both the Supplemental Savings Plan and the SEMPP. Although no assets may actually be invested, a participant's benefit value is based on the gains or losses of the investments they choose. No above market or preferential earnings are provided under our nonqualified defined contributions plans because the investment choices available under the plans are identical to the investment choices available in the 401(k) Plan and the MPP. Consequently none of the earnings reported in the "—Nonqualified Deferred Compensation in Fiscal 2012" table above are included in the Summary Compensation Table set forth above. Participants may change their investment options at any time by submitting a change form to the plan administrator.
151
The table below lists the investment funds available to participants in the 401(k) Plan, the Supplemental Savings Plan, the MPP and SEMPP. The table also provides the rate of return for each fund for 2012. All funds and rates of return are the same for all four defined contribution plans.
Investment Funds
|
Ticker Symbol |
2012 Performance |
||||
|---|---|---|---|---|---|---|
American Beacon Large Cap Value Institutional |
AADEX | 19.07 | % | |||
American Beacon Small Cap Value Institutional |
AVFIX | 16.52 | % | |||
American Century Inflation Adjusted Bond Institutional |
AIANX | 6.89 | % | |||
American Century Real Estate Institutional |
REAIX | 18.03 | % | |||
Dimensional Emerging Markets Value Portfolio |
DFEVX | 19.36 | % | |||
Fidelity Freedom Fund Income |
FFFAX | 6.36 | % | |||
Fidelity Freedom Fund 2010 |
FFFCX | 10.53 | % | |||
Fidelity Freedom Fund 2020 |
FFFDX | 11.86 | % | |||
Fidelity Freedom Fund 2030 |
FFFEX | 13.65 | % | |||
Fidelity Freedom Fund 2040 |
FFFFX | 14.61 | % | |||
Fidelity Freedom Fund 2050 |
FFFHX | 15.23 | % | |||
Fidelity International Discovery Fund |
FIGRX | 22.17 | % | |||
Fidelity Low Priced Stock Fund |
FLPSX | 18.66 | % | |||
First Eagle Overseas Class A |
SGOVX | 13.98 | % | |||
Janus Venture I |
JVTIX | 17.33 | % | |||
Morgan Stanly Institutional Fund Trust Mid Cap Growth P |
MACGX | 9.17 | % | |||
PIMCO Commodity Real Return Strategy Institutional |
PCRIX | 5.31 | % | |||
PIMCO Developing Local Markets Institutional |
PLMIX | 8.63 | % | |||
PIMCO Total Return Institutional |
PTTRX | 10.36 | % | |||
T Rowe Price New America Growth |
PRWAX | 13.56 | % | |||
Vanguard Institutional Index Institutional |
VINIX | 15.98 | % | |||
Vanguard Retirement Savings Trust II |
N/A | 2.58 | % | |||
Vanguard Select Value |
VASVX | 15.25 | % | |||
Vanguard Small Cap Index Signal |
VSISX | 18.25 | % | |||
Potential Payments upon Termination or Change of Control
As described above under "Compensation Discussion and Analysis," other than a letter agreement with Mr. Hankins, we do not maintain employment agreements with our named executive officers. For 2012, the only arrangement in effect that provided potential severance benefits to our named executive officers was our Executive Severance Plan. In addition, the vesting of outstanding restricted stock awards and stock options granted under our Stock Incentive Plan may be accelerated in the event of a change of control. Effective January 1, 2013, we entered into Severance Agreements with Jon M. Huntsman and Peter R. Huntsman and, during the term of these agreements, Jon M. Huntsman and Peter R. Huntsman are not entitled to participate in the Executive Severance Plan.
The tables below quantify the benefits available under these arrangements (assuming that the vesting of outstanding equity awards held by our named executive officers is accelerated by our Compensation Committee, which is permitted at its sole discretion). In order to provide our stockholders with the most relevant and up-to-date information regarding our currently existing arrangements, the following disclosures discuss and quantify the benefits available to Jon M. Huntsman and Peter R. Huntsman under the Severance Agreements, instead of under the Executive Severance Plan.
152
Executive Severance Plan. Historically, based on information provided by Meridian, we determined that it was necessary to provide executives with two times base yearly compensation as severance in order to attract and retain executive talent necessary for our business, as similar or greater amounts of severance were provided to executives employed by our competitors. For 2012, the Compensation Committee kept severance at this same level, as information provided by Meridian indicated that this level of severance is consistent with our objective of providing compensation within range of the median paid to similarly situated executives at comparable companies within our peer group and with other chemical and general industrial companies.
Pursuant to our Executive Severance Plan, each participant will be entitled to receive a single cash lump sum severance payment in an amount equal to two times his or her annual base salary in the event of a termination without "Reasonable Cause" or upon a termination by the executive for "Good Reason." The cash payment will be paid to the executive within the 60 days following an applicable termination of employment. In addition to cash payments, the Executive Severance Plan also provides the continuation of medical benefits for U.S. participants for two years following termination (which will be in the form of a lump sum cash payment equal to the monthly health care premiums for coverage), and outplacement services for a period of one year.
As citizens of the U.K., Messrs. Hankins and Turner are entitled participants in their respective business severance plans. At the time of a termination, payout potential from both the Executive Severance Plan and their respective U.K. business plan would be considered, then the plan generating the more generous payout would be used. Mr. Hankins is entitled to 12 months notice and 175% of his annual base pay upon termination as is the case with all U.K. associates in our Polyurethanes segment. Accordingly, his potential severance payment is 33 times base monthly salary upon termination. Mr. Turner is entitled to 175% of his annual base pay, but not a 12 months notice feature upon termination as is the case with all U.K. associates in our Pigments segment. Accordingly, his potential severance payment would be 21 times base monthly salary upon termination. By comparison, the Executive Severance Plan provides for a more lucrative severance arrangement for Mr. Turner whereby he would receive a payment equal to two times his annual base salary, or 24 times base monthly salary, in the event of a termination without "Reasonable Cause" or upon a termination by the executive for "Good Reason."
A participant will not be entitled to benefits under the Executive Severance Plan upon the participant's reemployment with an employer in our controlled group within the thirty day period immediately following the participant's termination of employment, upon the participant's refusal to sign a waiver and release of claims in our favor if we request such a waiver and release, or if the participant is entitled to severance benefits under a separate agreement or plan maintained by us.
The Executive Severance Plan utilizes the same definition of "Reasonable Cause" as set forth above with respect to our Supplemental Executive Retirement Plan. A termination for "Good Reason" pursuant to the Executive Severance Plan will be deemed to occur upon voluntary termination of employment as a result of the significant detrimental reduction or change to the executive's job responsibilities or in his current base compensation, which we do not remedy within a ten day period following the executive's written notice to us regarding the reduction or change, or change in the executive's principal place of work by more than fifty miles from his or her principal place of work in effect immediately prior to such change, which is not remedied by the Company within thirty days of written notice by the executive of the reduction or change.
Severance Agreements with Jon M. Huntsman and Peter R. Huntsman. For 2013, the Compensation Committee determined that increased amounts of severance in the context of a qualifying termination in connection with or following a change of control were appropriate for Jon M. Huntsman and Peter R. Huntsman, and entered into Severance Agreements with these two named executive officers effective January 1, 2013. The Severance Agreements have a five year term and, during the term of the
153
agreements, Jon M. Huntsman and Peter R. Huntsman are not eligible to participate in the Executive Severance Plan.
Consistent with the practice of many of our peers, the Compensation Committee adopted these agreements, which are designed to provide protection to our named executive officers who are primarily tasked with the management of our overall operations and business strategy so that they are not distracted by their personal, professional and financial situations at a time when we need them to remain focused on their responsibilities, our best interests and those of our stockholders. The Compensation Committee consulted extensively with Meridian to design these arrangements taking into account market practices. The agreements provide for a "double-trigger" payout of cash change of control severance amounts only in the event of a change of control and the executive officer's qualifying termination of employment.
Under the terms of the Severance Agreements, if Jon M. Huntsman or Peter R. Huntsman is terminated by us other than for Reasonable Cause or terminates his employment for Good Reason, the executive will be entitled to the payments and benefits specified in the Executive Severance Plan for senior executives as described above.
For Jon M. Huntsman, upon the occurrence of a change of control, his Severance Agreement provides that all unvested equity awards under the Stock Incentive Plan will become immediately vested. In addition, if his employment is terminated by us without Reasonable Cause or by him for Good Reason, in either case, within three years following a change of control, we will pay Jon M. Huntsman a lump sum cash amount equal to (1) three times his then current annual base salary, (2) three times the largest annual bonus paid to him during any of the three previous calendar years, (3) the largest annual bonus amount paid to him during any of the previous three calendar years, reduced by an amount equal to the pro rata portion of such bonus attributable to the portion of the calendar year of his termination that occurs after his termination date, plus (4) an amount equal to $42,890, representing the loss of certain health and welfare benefits provided to him in connection with his employment. In the case of Peter R. Huntsman, in the event his employment is terminated by us other than for Reasonable Cause or by him for Good Reason, in either case, within two years following a change of control, we will pay him a lump sum cash amount equal to 2.9 times his then current annual base salary. Payment of these amounts is contingent upon each executive executing (and not revoking) a release of claims in favor of the company. For purposes of the Severance Agreements, the terms "Reasonable Cause" and "Good Reason" generally have the same meaning given such terms for purposes of the Executive Severance Plan. A "change of control" means (1) an acquisition of beneficial ownership of 20% or more of our then outstanding shares of common stock or of our outstanding voting securities, (2) a majority change in the incumbent directors of the Board, (3) the consummation of a reorganization, merger or consolidation or sale or other disposition of all or substantially all of our assets (subject to certain limitations), or (4) a complete liquidation or dissolution of the company.
The Severance Agreements do not contain tax gross up provisions; however, the agreements do include a "best of net" provision, which provides that, if any payments or benefits to which the executive is entitled in connection with his termination are likely subject to the tax imposed by Section 4999 of the Internal Revenue Code, the payment will (1) be reduced such that Section 4999 does not apply or (2) paid in full, whichever produces the better net after tax position to the executive.
Stock Incentive Plan Awards
Equity awards granted under our Stock Incentive Plan provide for accelerated vesting upon a Change of Control at the discretion of our Compensation Committee. A "Change of Control" under the Stock Incentive Plan means the occurrence of any of the following:
154
If there is a Change of Control, the Compensation Committee may, in its discretion, provide for:
Any such provision made by the Compensation Committee could benefit all participants in the Stock Incentive Plan, including the named executive officers.
Supplemental Savings Plan
Pursuant to our Supplemental Savings Plan, upon a change of control (as defined in the Supplemental Savings Plan), participants, including the named executive officers, may elect to receive the present value of the benefits payable to them under this plan.
Quantification of Potential Payments and Benefits
The tables below reflect the compensation payable to or on behalf of each named executive officer upon retirement, disability, death, an involuntary termination without cause, or a change of control. The amounts shown assume that such termination or change of control was effective as of December 31, 2012. All equity acceleration values have been calculated using the closing price of our stock on December 31, 2012 of $15.90. In addition, the quantification of the amounts below for Jon M. Huntsman and Peter R. Huntsman are based on the terms of the Severance Agreements in effect as of January 1, 2013 (instead of on the terms of the Executive Severance Plan), as if the Severance Agreements were in place as of the last day of fiscal year 2012. The actual amounts we will be required to disburse can only be determined at the time of the applicable circumstance. Amounts payable under the Supplemental Savings Plan and SEMPP are described under "—Nonqualified Deferred Compensation in Fiscal 2012" above. Please note that while a termination of employment would accelerate the time in which an executive's pension plan account could be distributed to him and is thus noted below, amounts in this column will only be paid once, despite being listed both below and under "—Pension Benefits in Fiscal 2012" above. Our Compensation Committee has the authority to require an executive to sign and not revoke a general waiver and release in our favor prior to receiving benefits under the Executive Severance Plan, thus in some cases the amounts below may be subject to the execution of such an agreement.
155
Potential Payments for Jon M. Huntsman
| |
Retirement | Disability | Death | Involuntary Termination without Cause or For Good Reason |
Change of Control |
Involuntary Termination following Change of Control |
|||||||||||||
|---|---|---|---|---|---|---|---|---|---|---|---|---|---|---|---|---|---|---|---|
Compensation |
|||||||||||||||||||
Cash Severance(1) |
— | — | — | $ | 2,400,000 | — | $ | 29,576,000 | |||||||||||
Stock and Options (unvested & accelerated)(2) |
— | — | — | — | $ | 3,969,165 | — | ||||||||||||
Benefit Plans |
|||||||||||||||||||
Huntsman Pension Plan(3) |
$ | 111,565 | $ | 111,565 | $ | 111,565 | $ | 111,565 | — | — | |||||||||
Supplemental Executive Retirement Plan(3) |
$ | 2,336,903 | $ | 2,336,903 | $ | 2,336,903 | $ | 2,336,903 | — | — | |||||||||
Health & Welfare(4) |
— | — | — | $ | 23,638 | — | $ | 42,890 | |||||||||||
Outplacement Services(5) |
— | — | — | $ | 9,000 | — | — | ||||||||||||
156
Potential Payments for Peter R. Huntsman
| |
Retirement | Disability | Death | Involuntary Termination without Cause or For Good Reason |
Change of Control |
Involuntary Termination following a Change of Control |
|||||||||||||
|---|---|---|---|---|---|---|---|---|---|---|---|---|---|---|---|---|---|---|---|
Compensation |
|||||||||||||||||||
Cash Severance(1) |
— | — | — | $ | 3,200,000 | — | $ | 4,640,000 | |||||||||||
Stock and Options (unvested & accelerated)(2) |
— | — | — | — | $ | 6,230,227 | — | ||||||||||||
Benefit Plans |
|||||||||||||||||||
Huntsman Pension Plan(3) |
$ | 595,883 | $ | 595,883 | $ | 595,883 | $ | 595,883 | — | — | |||||||||
Supplemental Executive Retirement Plan(3) |
$ | 7,589,053 | $ | 7,589,053 | $ | 7,589,053 | $ | 7,589,053 | — | — | |||||||||
Health & Welfare(4) |
— | — | — | $ | 23,638 | — | — | ||||||||||||
Outplacement Services(5) |
— | — | — | $ | 9,000 | — | — | ||||||||||||
157
Potential Payments for J. Kimo Esplin
| |
Retirement | Disability | Death | Involuntary Termination without Cause or for Good Reason |
Change of Control |
|||||||||||
|---|---|---|---|---|---|---|---|---|---|---|---|---|---|---|---|---|
Compensation |
||||||||||||||||
Cash Severance(1) |
— | — | — | $ | 1,184,600 | — | ||||||||||
Stock and Options (unvested & accelerated)(2) |
— | — | — | — | $ | 1,321,770 | ||||||||||
Benefit Plans |
||||||||||||||||
Huntsman Pension Plan(3) |
$ | 370,263 | $ | 370,263 | $ | 370,263 | $ | 370,263 | — | |||||||
Supplemental Executive Retirement Plan(3) |
$ | 1,152,058 | $ | 1,152,058 | $ | 1,152,058 | $ | 1,152,058 | — | |||||||
Health & Welfare(4) |
— | — | — | $ | 18,921 | — | ||||||||||
Outplacement Services(5) |
— | — | — | $ | 9,000 | — | ||||||||||
158
Potential Payments for Anthony P. Hankins
| |
Retirement | Disability | Death | Involuntary Termination without Cause or for Good Reason |
Change of Control |
|||||||||||
|---|---|---|---|---|---|---|---|---|---|---|---|---|---|---|---|---|
Compensation |
||||||||||||||||
Cash Severance(1) |
— | — | — | $ | 2,079,153 | — | ||||||||||
Stock and Options (unvested & accelerated)(2) |
— | — | — | — | $ | 1,124,612 | ||||||||||
Benefit Plans |
||||||||||||||||
Huntsman Pension Scheme in the U.K.(3) |
$ | 398,918 | $ | 507,734 | $ | 368,107 | $ | 398,918 | — | |||||||
Outplacement Services(4) |
— | — | — | $ | 9,000 | — | ||||||||||
Potential Payments for Simon Turner
| |
Retirement | Disability | Death | Involuntary Termination without Cause |
Change of Control |
|||||||||||
|---|---|---|---|---|---|---|---|---|---|---|---|---|---|---|---|---|
Compensation |
||||||||||||||||
Cash Severance(1) |
— | — | — | $ | 968,924 | — | ||||||||||
Stock and Options (unvested & accelerated)(2) |
— | — | — | — | $ | 1,042,308 | ||||||||||
Benefit Plans |
||||||||||||||||
Huntsman Pension Scheme in the U.K.(3) |
$ | 211,402 | $ | 143,542 | $ | 105,701 | $ | 211,402 | — | |||||||
Outplacement Services(4) |
— | — | — | $ | 9,000 | — | ||||||||||
159
The following discussion of director compensation relates to our parent, Huntsman Corporation. However, because all of Huntsman Corporation's operations are conducted by our Company and our subsidiaries, we believe this discussion is material to an understanding of our Company and our subsidiaries. The managers of Huntsman International do not receive any compensation for services rendered in such capacities in addition to compensation provided by our parent. Unless the context otherwise requires, references in this director compensation discussion to "we," "us," "our," or "our company" refer to Huntsman Corporation, together with its subsidiaries.
Annual compensation for our non-employee directors is comprised of cash and stock-based equity compensation. Cash compensation paid to our non-employee directors consists of an annual retainer as well as a supplemental retainer for the chairs and members of Board committees. Stock-based equity compensation for fiscal 2012 consisted of awards granted under our Stock Incentive Plan of stock or stock units at the election of each director. Jon M. Huntsman, the Executive Chairman of the Board, and Peter R. Huntsman, our President and Chief Executive Officer, serve as directors of the Company but are not included in this table since they were also our employees during 2012. Messrs. Jon M. Huntsman and Peter R. Huntsman do not receive any additional compensation for their services as directors; thus, their total compensation is shown in the Summary Compensation Table.
The Board believes that compensation for non-employee directors should be competitive and should fairly compensate directors for the time and skills devoted to serving us but, for independent directors, should not be so great as to compromise independence. With the assistance of Meridian, the Compensation Committee periodically reviews our director compensation practices and compares them to the practices of companies in our peer group as well as against the practices of public company boards generally to ensure they are in line with typical market practices.
Non-employee directors receive an annualized cash retainer of $135,000 paid in quarterly installments and an annual stock-based award with a value of approximately $135,000 on the grant date. Annual stock-based awards to our non-employee directors vest in full on the grant date. In addition, each member of the Audit Committee receives an additional annual cash retainer of $20,000 and each member of the Compensation, Governance and Litigation committees receives an additional annual cash retainer of $10,000. The Lead Independent Director receives an additional annual cash retainer of $50,000. The chairperson of the Audit Committee receives an annual cash retainer of $30,000, and the chairpersons of the Compensation, Governance, and Litigation committees each receive annual cash retainers of $20,000, in each case, in addition to the retainers received for being members of these committees. Directors receive pro rata amounts of the above fees for partial year service.
We also offer non-employee directors the opportunity to participate in the Huntsman Outside Directors Elective Deferral Plan. This is an unfunded nonqualified plan established primarily for the purpose of providing our non-employee directors with the ability to defer the receipt of director fees. For 2012, Ms. Beckerle and Mr. Harker were the only non-employee directors who elected to participate in this plan, and each elected to defer all 2012 fees. The investment choices available under this plan are identical to the investment choices available under our 401(k) and MPP plans. Benefits under the plan are payable in cash distributable either in a lump sum or in installments beginning 30 days after the director ceases to be a member of our Board.
All of our directors are reimbursed for reasonable out-of-pocket expenses incurred for attending meetings of the Board or its committees and for other reasonable expenses related to the performance of their duties as directors.
160
The Board believes that our total director compensation package is competitive with the compensation offered by other companies and is fair and appropriate in light of the responsibilities and obligations of our non-employee directors.
The total 2012 compensation for our non-employee directors is shown in the following table:
Name
|
Fees Earned or Paid in Cash ($)(1) |
Stock Awards ($)(2) |
All Other Compensation(3) |
Total ($) |
|||||||||
|---|---|---|---|---|---|---|---|---|---|---|---|---|---|
Nolan D. Archibald |
$ | 215,000 | $ | 135,000 | — | $ | 350,000 | ||||||
Mary C. Beckerle |
$ | 145,000 | $ | 135,000 | — | $ | 280,000 | ||||||
M. Anthony Burns |
$ | 195,000 | $ | 135,000 | — | $ | 330,000 | ||||||
Patrick T. Harker |
$ | 185,000 | $ | 135,000 | — | $ | 320,000 | ||||||
Jon M. Huntsman, Jr.(4) |
$ | 135,000 | $ | 135,000 | $ | 220,000 | $ | 490,000 | |||||
Robert J. Margetts |
$ | 135,000 | $ | 135,000 | — | $ | 270,000 | ||||||
Wayne A. Reaud |
$ | 175,000 | $ | 135,000 | — | $ | 310,000 | ||||||
Alvin V. Shoemaker |
$ | 165,000 | $ | 135,000 | — | $ | 300,000 | ||||||
Director
|
Annual Retainer |
Audit Committee |
Compensation Committee |
Nominating and Corporate Governance Committee |
Litigation Committee |
Lead Independent Director |
|||||||||||||
|---|---|---|---|---|---|---|---|---|---|---|---|---|---|---|---|---|---|---|---|
Nolan D. Archibald |
$ | 135,000 | — | $ | 30,000 | * | — | — | $ | 50,000 | |||||||||
Mary C. Beckerle |
$ | 135,000 | — | — | $ | 10,000 | — | — | |||||||||||
M. Anthony Burns |
$ | 135,000 | $ | 50,000 | * | — | $ | 10,000 | — | — | |||||||||
Patrick T. Harker |
$ | 135,000 | $ | 20,000 | — | $ | 30,000 | * | — | — | |||||||||
Jon M. Huntsman, Jr. |
$ | 135,000 | — | — | — | — | — | ||||||||||||
Robert J. Margetts |
$ | 135,000 | — | — | — | — | — | ||||||||||||
Wayne A. Reaud |
$ | 135,000 | — | $ | 10,000 | — | $ | 30,000 | * | — | |||||||||
Alvin V. Shoemaker |
$ | 135,000 | $ | 20,000 | $ | 10,000 | — | — | — | ||||||||||
161
table sets forth information regarding the stock-based equity compensation awards made to our non-employee directors during fiscal 2012:
| |
Granted 02/1/12 $13.41 per share |
Granted 02/15/12 $12.99 per share |
Aggregate 2012 Grants |
||||||||||||||||
|---|---|---|---|---|---|---|---|---|---|---|---|---|---|---|---|---|---|---|---|
Director
|
(#) | ($) | (#) | ($) | (#) | ($) | |||||||||||||
Nolan D. Archibald |
10,067 | $ | 135,000 | — | — | 10,067 | $ | 135,000 | |||||||||||
Mary C. Beckerle |
10,067 | $ | 135,000 | — | — | 10,067 | $ | 135,000 | |||||||||||
M. Anthony Burns |
10,067 | $ | 135,000 | — | — | 10,067 | $ | 135,000 | |||||||||||
Patrick T. Harker |
10,067 | $ | 135,000 | — | — | 10,067 | $ | 135,000 | |||||||||||
Jon M. Huntsman, Jr. |
— | — | 10,393 | $ | 135,000 | 10,393 | $ | 135,000 | |||||||||||
Robert J. Margetts |
10,067 | $ | 135,000 | — | — | 10,067 | $ | 135,000 | |||||||||||
Wayne A. Reaud |
10,067 | $ | 135,000 | — | — | 10,067 | $ | 135,000 | |||||||||||
Alvin V. Shoemaker |
10,067 | $ | 135,000 | — | — | 10,067 | $ | 135,000 | |||||||||||
162
SECURITY OWNERSHIP OF CERTAIN BENEFICIAL OWNERS AND MANAGEMENT
Our parent, Huntsman Corporation, owns all of our outstanding membership interests. The following discussion of security ownership relates to our parent, Huntsman Corporation. Because all of Huntsman Corporation's operations are conducted by our Company and our subsidiaries, we believe this discussion is material to an understanding of our Company and our subsidiaries. Unless the context otherwise requires, references to "we," "us," "our," or "our company" refer to Huntsman Corporation, together with its subsidiaries.
The following table presents information regarding beneficial ownership of our common stock as of March 8, 2013 by:
Under the regulations of the SEC, shares are generally deemed to be "beneficially owned" by a person if the person directly or indirectly has or shares voting power or investment power (including the power to dispose) over the shares, whether or not the person has any pecuniary interest in the shares, or if the person has the right to acquire voting power or investment power of the shares within 60 days, including through the exercise of any option, warrant or right. In accordance with the regulations of the SEC, in computing the number of shares of common stock beneficially owned by a person and the percentage ownership of such person, we deemed to be outstanding all shares of common stock subject to options or other rights held by the person that are currently exercisable or
163
exercisable within 60 days of March 8, 2013. We did not deem such shares outstanding, however, for the purpose of computing the percentage ownership of any other person.
| |
Common Stock Beneficially Owned(1) | ||||||
|---|---|---|---|---|---|---|---|
Name of Beneficial Owner
|
Shares | Percent(2) | |||||
5% or more beneficial owners (except officers and directors): |
|||||||
Huntsman Family Holdings Company LLC |
16,847,282 | 7.0 | % | ||||
The Huntsman Foundation |
21,782,000 | 9.0 | % | ||||
Passport Capital, LLC ("Passport Capital"); John H. Burbank III ("Burbank")(3) |
12,031,052 | 5.0 | % | ||||
Directors and named executive officers: |
|||||||
Jon M. Huntsman(4) |
39,205,862 | 16.3 | % | ||||
Nolan D. Archibald(5) |
161,012 | * | |||||
Mary C. Beckerle(6) |
22,137 | * | |||||
M. Anthony Burns |
33,896 | * | |||||
Patrick T. Harker(7) |
33,896 | * | |||||
Jon M. Huntsman, Jr. |
17,956 | * | |||||
Peter R. Huntsman(8) |
7,570,149 | 3.1 | % | ||||
Robert J. Margetts(9) |
30,232 | * | |||||
Wayne A. Reaud(10) |
1,540,113 | * | |||||
Alvin V. Shoemaker(11) |
178,967 | * | |||||
J. Kimo Esplin(12) |
1,327,689 | * | |||||
Anthony P. Hankins(13) |
901,710 | * | |||||
Simon Turner(14) |
348,203 | * | |||||
All directors and executive officers as a group (22 persons)(4)(8)(15) |
54,278,814 | 22.38 | % | ||||
164
Fund III, Account I, Account II and Account III except in the case of Account I and Account II which maintain sole power to vote or direct the vote of their beneficially owned shares.
165
166
The following discussion of corporate governance relates to our parent, Huntsman Corporation. Huntsman International is a wholly-owned subsidiary of Huntsman Corporation and as a result it does not have common interests listed on an exchange. However, because all of Huntsman Corporation's operations are conducted by our Company and our subsidiaries, we have included the following discussion of the corporate governance of our parent. Unless the context otherwise requires, references in this corporate governance discussion to "we," "us," "our," or "our company" refer to Huntsman Corporation, together with its subsidiaries.
Board Independence
It is important to our company for investors to have confidence that the individuals serving as independent directors on the Board do not have a relationship with us that would impair their independence. Under the NYSE corporate governance rules, the Board must have a majority of independent directors. For a director to qualify as independent, the Board must affirmatively determine that the director has no material relationship with our company, either directly or as a partner, stockholder or officer of an organization that has a relationship with our company. To assist it in making independence determinations, the Board has adopted independence criteria which can be found on our website at www.huntsman.com. Under these criteria, a director is not independent if:
With the assistance of legal counsel to our company, the Governance Committee has reviewed the applicable legal and NYSE standards for independence, as well as our independence criteria. A
167
summary of the answers to annual questionnaires completed by each of the directors and nominees for director and a report of transactions and relationships between each director and nominee for director, or any of his or her family members, and our company, senior management and independent registered accounting firm have been made available to the Governance Committee.
In conducting its independence review, the Governance Committee specifically considered the relationships discussed under "Certain Relationships and Related Transactions—Transactions." In addition, with respect to Mr. Reaud, the Governance Committee considered Messrs. Jon M. Huntsman and Reaud's service together on the board of directors of a private foundation and a retainer of $200,000 paid in 2012 to Mr. Reaud's former law firm, Reaud, Morgan & Quinn, for legal services. No such retainer will be paid in 2013 and Mr. Reaud receives no compensation from, and has no financial interest in, his former firm. The Governance Committee also considered Dr. Beckerle's position as CEO of the Huntsman Cancer Institute, or the Institute. The Governance Committee took into account the fact that Jon M. Huntsman has no ownership of the Institute, which is part of the University of Utah, a public institution owned by the State of Utah. The Governance Committee further considered that beginning a number of years ago, the Huntsman Cancer Foundation, a 501(c)(3) charity whose purpose is to help fund the Institute, has made stipend payments of $100,000 annually to the CEO of the Institute. The Governance Committee took into account that Jon M. Huntsman is only one of four trustees of the Huntsman Cancer Foundation, and that our company has no financial relationship with either the Huntsman Cancer Foundation or the Institute other than purchasing a table for $10,000 at an annual fundraiser for the Institute.
On the basis of its review, the Governance Committee delivered a report to the full Board, and the Board made its independence determinations based on the Governance Committee's report and the supporting information. As a result of this review, the Board has determined that Messrs. Archibald, Burns, Reaud, Shoemaker and Drs. Beckerle and Harker, who currently constitute a majority of the Board, are independent. These independent directors currently comprise, in full, the membership of the three standing Board committees discussed below.
Jon M. Huntsman is not considered to be an independent director because he is employed by our company and is the father of Peter R. Huntsman, our Chief Executive Officer, and James H. Huntsman, our Division President, Advanced Materials. Peter R. Huntsman is not considered to be an independent director because he is employed by our company and is the son of Jon M. Huntsman, our Executive Chairman, and the brother of James H. Huntsman, our Division President, Advanced Materials. Gov. Jon M. Huntsman, Jr. is not considered to be an independent director because of his consulting relationship with our company as described under "Certain Relationships and Related Transactions—Transactions Consulting Agreement" and because he is the son of Jon M. Huntsman, our Executive Chairman, and the brother of Peter R. Huntsman, our Chief Executive Officer, and James H. Huntsman, our Division President, Advanced Materials. Sir Robert is not considered to be an independent director because he was an employee of our company within the last three years. We expect that Sir Robert will be considered independent in August 2013.
Board Meetings
The Board and its committees meet throughout the year on a set schedule, and also hold special meetings and act by written consent from time to time as appropriate. During 2012, the Board met ten times, the non-management directors met in executive session five times and the independent directors met in executive session two times. During 2012, each director attended at least 75% of the aggregate of:
168
Board Leadership Structure and Executive Sessions of the Board
According to our Bylaws, the Chairman of the Board is elected by all of the directors on the Board to preside at all meetings of the stockholders and of the Board. The Chairman of the Board is also required to make reports to the Board and the stockholders and to ensure that all orders and resolutions of the Board and any of its committees are carried into effect. Our Bylaws also allow the Board to elect an Executive Chairman. If elected, the Executive Chairman fills the role of Chairman of the Board and has other powers and duties including, among others, consulting on the strategic vision of our company and serving as a facilitator for communication between our officers and the Board. In accordance with our Corporate Governance Guidelines, the Executive Chairman is also responsible for establishing the agenda for each Board meeting. At the beginning of the year, the Executive Chairman establishes a schedule of agenda subjects to be discussed during the year (to the degree this can be foreseen). Each Board member is also free to suggest the inclusion of additional items on the agenda and to raise at any Board meeting subjects that are not on the agenda for that meeting. Jon M. Huntsman is currently the Executive Chairman. As such, he also fills the role of Chairman of the Board.
In accordance with our Corporate Governance Guidelines, the Board has no policy with respect to the separation of the offices of Chairman of the Board and Chief Executive Officer. Our Bylaws expressly allow our Chairman of the Board to also serve as President or Chief Executive Officer, if so elected by the Board. The Board believes that this issue should be considered periodically as part of the succession planning process and that it is in the best interests of our company for the Board to make a determination regarding this issue each time it appoints a new Chief Executive Officer. Based on these principles, the Board may determine that it is appropriate in the future to combine the roles of Chairman of the Board and Chief Executive Officer.
Our Bylaws also allow the Board to elect one or more Vice Chairmen to preside at Board and stockholder meetings and to perform such other duties as may be delegated by the Board, in either case in the absence of Chairman of the Board. The Board believes that it obtains effective additional Board leadership through the role of the Vice Chairman, which is currently filled by Mr. Archibald, who also serves as Lead Independent Director.
In accordance with our Corporate Governance Guidelines, the non-management directors meet in executive session without management at each regularly scheduled Board meeting, or more frequently as needed at the call of one or more of our non-management directors. Our Corporate Governance Guidelines also require that our independent directors meet in executive session at least once annually without those non-management directors who are not independent, or more frequently as needed at the call of one or more of our independent directors. Mr. Archibald, who serves as Vice Chairman of the Board and Lead Independent Director, has been designated as the presiding director at these sessions.
We believe that the appropriate Board leadership structure for our company may vary, depending on the circumstances facing the Board and our company at any given time. For example, we have revised the Board's leadership structure in the past to address specific needs, such as the formation of a Litigation Committee (in November 2008) and the change of Jon M. Huntsman's role from Chairman to Executive Chairman (in February 2009) in recognition of his ongoing strategic leadership at both a Board and an executive level. We believe that our current Board leadership structure efficiently addresses our company's present needs and allows the Board to fulfill its role in exercising effective, independent oversight of our management on behalf of our stockholders. The Board further believes that we have in place effective structures, processes and arrangements to ensure that the work of the
169
Board is completed in a manner that maintains the highest standards of corporate governance, independence and leadership, as well as continued accountability of management.
Board Role in Risk Oversight
The Board is responsible for overseeing our company's management of risk. The Board strives to effectively oversee our company's enterprise-wide risk management in a way that balances managing risks while enhancing the long-term value of our company for the benefit of our stockholders. The Board understands that its focus on effective risk oversight is critical to setting our company's tone and culture towards effective risk management. To administer its oversight function, the Board seeks to understand our company's risk philosophy by having discussions with management to establish a mutual understanding of our company's overall appetite for risk. The Board maintains an active dialogue with management about existing risk management processes and how management identifies, assesses and manages our company's most significant risk exposures. The Board expects, and receives, frequent updates from management about our company's most significant risks so as to enable it to evaluate whether management is responding appropriately.
The Board relies on each of its committees to help oversee the risk management responsibilities relating to the functions performed by such committees. Our Audit Committee regularly discusses with management our company's major financial risk exposures and the steps management has taken to monitor and control such exposures, including our company's risk assessment and risk management policies. Also, our Compensation Committee helps the Board to identify our company's exposure to any risks potentially created by our compensation programs and practices. Our Governance Committee oversees risks relating to our company's corporate compliance programs and assists the Board and management in promoting an organizational culture that encourages commitment to ethical conduct and a commitment to compliance with the law. Our Litigation Committee assesses risk from litigation and areas of legal exposure to which our company is or could be subject and makes recommendations to the Board regarding those matters. Each of these committees is required to make regular reports of its actions and any recommendations to the Board, including recommendations to assist the Board with its overall risk oversight function.
We believe that the oversight function of the Board and its committees combined with its active dialogue with management about effective risk management provides our company with the appropriate framework to help ensure effective risk oversight.
Board Committees
The Board currently has, and appoints the members of, independent Audit, Compensation, and Governance committees. Each of these committees has a written charter approved by the Board. These charters are available on our website at www.huntsman.com. We will also furnish copies of the charters free of charge to any person who requests them. Requests for copies should be directed to the Corporate Secretary, 500 Huntsman Way, Salt Lake City, Utah, 84108 or to CorporateSecretary@huntsman.com.
The independent committees are currently structured as follows:
| Audit | Compensation | Nominating and Corporate Governance | ||
|---|---|---|---|---|
| M. Anthony Burns (Chair) | Nolan D. Archibald (Chair) | Patrick T. Harker (Chair) | ||
| Patrick T. Harker | Wayne A. Reaud | Mary C. Beckerle | ||
| Alvin V. Shoemaker | Alvin V. Shoemaker | M. Anthony Burns |
Audit Committee. The Audit Committee has been established to assist the Board in monitoring:
170
The Audit Committee has sole responsibility for the appointment, retention and termination of the independent registered public accounting firm and is directly responsible for the compensation and oversight of the work of the independent registered public accounting firm. Under the independence criteria that the Board has adopted, which can be found on our website at www.huntsman.com, a member of the Audit Committee will not be considered independent if:
Furthermore, under these independence standards, (1) each member of the Audit Committee must be financially literate, (2) at least one member of the Audit Committee must have accounting or related financial management expertise and qualify as an "audit committee financial expert" and (3) no member of the Audit Committee may simultaneously serve on the audit committees of more than two other public companies. For purposes of (2) above, the Board considers any Audit Committee member who satisfies the SEC's definition of "audit committee financial expert" to have accounting or related financial management expertise.
The Board has determined that each member of the Audit Committee is independent as that term is defined by the listing standards of the NYSE and Rule 10A-3 promulgated under the Securities Exchange Act of 1934 and satisfies the additional independence criteria adopted by the Board and described above. The Board has also determined that Mr. Burns, the Chairman of the Audit Committee, qualifies as an "audit committee financial expert" as defined by the regulations of the SEC. For information regarding Mr. Burns' business experience, see "Proposal No. 1—Election of Directors—Nominees and Existing Directors." No member of the Audit Committee serves on more than two other public company audit committees.
The Audit Committee held eight meetings in 2012.
Compensation Committee. The Compensation Committee's function is to support the Board in fulfilling its oversight responsibilities relating to senior management and director compensation. In this regard, the Board and Compensation Committee seek to align total compensation for the Chief Executive Officer and other senior executives with the long-term interests of stockholders. The Compensation Committee also oversees our incentive and equity-based compensation plans.
171
Under its charter, the stated purposes of the Compensation Committee are to:
The Compensation Committee's charter permits the Compensation Committee to form and delegate some or all of its authority to subcommittees when it deems appropriate. In particular, the Compensation Committee may delegate the approval of both cash and equity award grants and other responsibilities regarding the administration of compensatory programs to a subcommittee consisting solely of members of the Compensation Committee who are non-employee directors or outside directors, or in some limited circumstances, to management.
The Compensation Committee typically meets at least four times each year to address various compensation issues and processes. Our Chief Executive Officer does not have the ability to call Compensation Committee meetings, but generally attends Compensation Committee meetings at the Compensation Committee's request to answer questions and provide input regarding the performance of our executive officers. However, the Chief Executive Officer is not present while decisions regarding his compensation are made. In addition, each Compensation Committee meeting usually includes an executive session without members of management present. The Compensation Committee met eight times during 2012, and five of these meetings included an executive session. The Compensation Committee regularly reports to the full Board regarding executive compensation matters.
Please see "Compensation Discussion and Analysis—Annual Review of Executive Compensation" for additional information on the Compensation Committee's processes and procedures for the consideration and determination of executive officer and director compensation.
Nominating and Corporate Governance Committee. The Governance Committee is appointed by the Board to ensure that our corporate governance system performs well. The duties of the Governance Committee include:
172
The Governance Committee held four meetings in 2012.
Litigation Committee. In addition to the independent committees described above, the Board also has a Litigation Committee. The Litigation Committee assists the Board by reviewing and assessing current and potential litigation and areas of legal exposure in which our company is or could be involved and making recommendations to the Board regarding legal matters. The members of the Litigation Committee are Wayne A. Reaud, who serves as the committee's Chair, Jon M. Huntsman and Peter R. Huntsman. The Litigation Committee generally meets quarterly in connection with our regularly scheduled Board meetings.
Director Qualification Standards and Diversity
The Governance Committee's minimum qualifications and specific qualities and skills required for directors are set forth in Section 1 of our Corporate Governance Guidelines, which are available on our website at www.huntsman.com. These Guidelines require that a majority of directors on the Board must meet the criteria for independence required by the NYSE, and that each director functions consistent with the highest level of professional ethics and integrity. Each of our directors is expected to devote sufficient time and effort to learn the business of our company and the Board, to use his or her own unique skills and experiences to provide independent oversight to our business, to participate in a constructive and collegial manner, to exhibit a high level of commitment to our company and to exhibit independent thought and judgment. Although we do not have a separate diversity policy relating to the identification and evaluation of nominees for director, our Corporate Governance Guidelines require that the Governance Committee consider each candidate's background, ability, judgment, skills and experience in the context of the needs of the Board when evaluating director nominees. The Governance Committee believes it is important for Board members to possess skills and knowledge in the areas of leadership of large, complex organizations, finance, strategic planning, legal, government relations and relevant industries, especially the chemical industry. These considerations help the Board as a whole to have the appropriate mix of characteristics, skills and experiences for the optimal functioning of the Board in its oversight of our company. As part of its periodic self-assessment process, the Governance Committee annually reviews and evaluates its performance, including overall composition of the Board and the criteria that it uses for selecting nominees in light of the specific skills and characteristics necessary for the optimal functioning of the Board in its oversight of our company.
Director Nomination Process
The Governance Committee identifies director candidates through a variety of means, including recommendations from other Board members and management. From time to time, the Governance Committee may use third-party search consultants to identify director candidates. The Governance Committee also welcomes stockholder recommendations for candidates for the Board. All stockholder recommendations must comply with the notice requirements contained in Section 2.8 of our Bylaws, which requires, among other things, detailed information concerning the stockholder making the proposal (and the beneficial owner on whose behalf the proposal is made, if any), the name and address of the stockholder and specific information concerning such stockholder's interests in our company's securities, including derivative instruments. In addition, the notice must include the recommended candidate's name, biographical data, qualifications, details regarding any material monetary agreements between the stockholder and the proposed nominee, and a written questionnaire completed by the proposed nominee. Our Bylaws are available on our website at www.huntsman.com under the tab "Investor Relations." We will also furnish copies of our Bylaws free of charge to any person who requests them. Requests for copies should be directed to the Corporate Secretary, 500 Huntsman Way, Salt Lake City, Utah, 84108 or to CorporateSecretary@huntsman.com.
173
From time to time, the Governance Committee may request additional information from the nominee or the stockholder. The Governance Committee uses the same process to screen all potential candidates, regardless of the source of the recommendation. The Governance Committee determines whether the candidate meets our minimum qualifications and specific qualities and skills for directors and whether requesting additional information or an interview is appropriate. Except as described under "Stockholder Proposals and Director Nominations for the 2014 Annual Meeting," the procedures set forth in Section 2.8 of our Bylaws are the exclusive means for a stockholder to make director nominations or submit other proposals before an annual or special meeting of the stockholders.
Stockholder Communications Policy
Stockholders and other interested parties may communicate directly and confidentially with the Board, the non-management directors, the independent directors or the Lead Independent Director by sending a letter addressed to the intended recipients, c/o Corporate Secretary, Huntsman Corporation, 500 Huntsman Way, Salt Lake City, Utah 84108 or by sending an email specifying the intended recipients to CorporateSecretary@huntsman.com. The Corporate Secretary will review such communications and, if appropriate, forward them only to the intended recipients. Communications that do not relate to the responsibilities of the intended recipients as directors of Huntsman (such as communications that are commercial or frivolous in nature) will not be forwarded. In addition, communications that appear to be unduly hostile, intimidating, threatening, illegal or similarly inappropriate will not be forwarded. A copy of our Stockholder Communications Policy is available on our website at www.huntsman.com.
Corporate Governance Guidelines
The Board has adopted Corporate Governance Guidelines, and the Governance Committee is responsible for implementing the guidelines and making recommendations to the Board concerning corporate governance matters. The guidelines are available on our website at www.huntsman.com. We will also furnish copies of the guidelines free of charge to any person who requests them. Requests for copies should be directed to the Corporate Secretary, 500 Huntsman Way, Salt Lake City, Utah, 84108 or to CorporateSecretary@huntsman.com.
Among other matters, the guidelines provide for the following:
174
Financial Code of Ethics and Business Conduct Guidelines
The Board has adopted a Financial Code of Ethics applicable to our Chief Executive Officer, Chief Financial Officer and Chief Accounting Officer or Controller. Among other matters, this code is designed to promote:
In addition, the Board has adopted our Business Conduct Guidelines. The Board requires all directors, officers and employees to adhere to these guidelines in addressing the legal and ethical issues encountered in conducting their work. The Financial Code of Ethics and Business Conduct Guidelines are available on our website at www.huntsman.com. We will also furnish copies of the Financial Code of Ethics and Business Conduct Guidelines free of charge to any person who requests them. Requests for copies should be directed to the Corporate Secretary, 500 Huntsman Way, Salt Lake City, Utah, 84108 or to CorporateSecretary@huntsman.com.
Director Attendance at the Annual Meeting of Stockholders
We believe that there are benefits to having members of the Board attend our annual meetings of stockholders. From time to time, however, a member of the Board might have a compelling and legitimate reason for not attending an annual meeting. As a result, the Board has decided that director attendance at our annual meetings of stockholders should be strongly encouraged, but is not required. In 2012, all of the then-current directors attended the 2012 Annual Meeting of Stockholders in person.
175
CERTAIN RELATIONSHIPS AND TRANSACTIONS WITH RELATED PERSONS
The following discussion of certain relationships and transactions with related persons relates to our parent, Huntsman Corporation. However, because all of Huntsman Corporation's operations are conducted by our Company and our subsidiaries, we believe this discussion is material to an understanding of our Company and our subsidiaries. Unless the context otherwise requires, references in this discussion to "we," "us," "our," or "our company" refer to Huntsman Corporation, together with its subsidiaries.
Policies and Procedures
Effective as of February 1, 2007, the Board adopted a policy and the procedures for review, approval and monitoring of transactions involving our company and "related persons" (directors, executive officers, stockholders owning five percent or greater of our common stock, or their respective immediate family members). The policy covers any related person transaction involving amounts exceeding $120,000 in which a related person has a direct or indirect material interest.
Related person transactions must be approved by the Audit Committee, which will approve the transaction only if it determines that the transaction is in, or is not inconsistent with, our interests. In evaluating the transaction, the Audit Committee will consider all relevant factors, including as applicable (1) the benefit to us in entering into the transaction; (2) the alternatives to entering into a related person transaction; and (3) whether the transaction is on terms comparable to those available to third parties.
If a director is involved in the transaction, he or she will be recused from all discussions and decisions about the transaction. The transaction must be approved in advance of its consummation. The Audit Committee will periodically monitor the transaction to ensure that there are no changed circumstances that would render it advisable for us to amend or terminate the transaction and will review the transaction annually to determine whether it continues to be in our interests.
The Audit Committee approved our lease payments for the Salt Lake City office building, described below, in accordance with the above policy and continues to monitor the other arrangements described below consistent with the above policy although such arrangements had been entered into prior to the adoption of the policy described above.
Transactions
Aircraft Sublease and Time-Sharing Agreements
Pursuant to an agreement entered into in 2001, our subsidiary Airstar Corporation ("Airstar") subleases a Gulfstream IV-SP Aircraft (the "Aircraft") from Jstar Corporation ("Jstar"), a corporation wholly owned by Jon M. Huntsman. Jon M. Huntsman is the father of our Chief Executive Officer, Peter R. Huntsman; our Division President, Advanced Materials, James H. Huntsman; and our director, Gov. Jon M. Huntsman, Jr. In 2011, this arrangement was extended for an additional 10 year period. In connection with this extension, monthly sublease payments from Airstar to Jstar were reduced from approximately $193,000 to approximately $115,000 and an aggregate of $13.8 million is payable through the end of the current 10 year lease term. These monthly sublease payments are used to fund financing costs paid by Jstar to a leasing company. An unrelated third-party pays $2.4 million per year to our subsidiary for such third-party's part-time use of the Aircraft (or an alternate owned by us if the Aircraft is unavailable), subject to an annual adjustment, which typically has been at least fair market value for the number of flight hours used by such third-party. We bear all other costs of operating the Aircraft. In accordance with our Aircraft Use Policy, we have entered into aircraft time-sharing agreements with certain members of the Huntsman family, pursuant to which these persons pay for the costs of any personal use of the Aircraft by them.
176
Salt Lake City Office Building
An agreement was reached prior to the initial public offering of our common stock in February 2005 with the Huntsman Foundation, a private charitable foundation established by Jon M. and Karen H. Huntsman to further the charitable interests of the Huntsman family, that we would donate our Salt Lake City office building and our option to acquire an adjacent undeveloped parcel of land to the foundation free of debt. Jon M. and Karen H. Huntsman are the parents of our Chief Executive Officer, Peter R. Huntsman; our Division President, Advanced Materials, James H. Huntsman; and our director, Gov. Jon M. Huntsman, Jr. On March 24, 2010, we completed this donation. At the time of the donation, the building had an appraised value of approximately $10.1 million. We continue to occupy and use a portion of the building under a lease pursuant to which we make annual lease payments of approximately $1.5 million to the Huntsman Foundation. During 2012, we made payments of $1,556,483 to the Huntsman Foundation under the lease. The lease expires on December 31, 2013, subject to two five-year extensions, at our option.
Consulting Agreement
Effective May 1, 2012, we entered into a Consulting Agreement with Gov. Jon M. Huntsman, Jr., one of our directors and the former governor of Utah and U.S. Ambassador to Singapore and China. Gov. Huntsman is the son of our Executive Chairman, Jon M. Huntsman; the brother of our Chief Executive Officer, Peter R. Huntsman; and the brother of our Division President, Advanced Materials, James H. Huntsman. Pursuant to the Consulting Agreement, Gov. Huntsman agreed to provide strategic advice to senior management of our company on political, economic and business matters, particularly in connection with markets and opportunities in Asia; participate from time to time in negotiations and discussions with business leaders and dignitaries; assist in marketing our products and participate in such other meetings or discussions as may be requested by senior management of the Company upon reasonable notice. In exchange for these services, we pay Gov. Huntsman $27,500 per month through the term of the Consulting Agreement, which ends on December 31, 2013.
Other Transactions with the Huntsman Family
James H. Huntsman is the Division President of our Advanced Materials business, a position he was appointed to in May 2011. He is the son of the Executive Chairman, Jon M. Huntsman, the brother of the Chief Executive Officer, Peter R. Huntsman, and the brother of our director, Gov. Jon M. Huntsman, Jr. During 2012, James Huntsman was paid a salary of $412,000 and earned a cash performance award of $253,100. In February 2012, he was granted 31,447 option awards with an exercise price of $13.41, the closing price of a share of our common stock on the grant date. These options vest and become exercisable ratably in three equal annual installments beginning on the first anniversary of the grant date. In addition, he was granted 14,914 restricted stock awards in February 2012 that will vest ratably in three equal annual installments beginning on the first anniversary of the grant date. All amounts paid to James Huntsman for 2012 were approved by the Compensation Committee, which reviews and approves, for corporate and executive officers and their family members that are employees, all annual and other compensation arrangements and components. For 2013, James Huntsman will be paid a salary of $412,000 and may earn a cash performance award of up to 60% of his 2013 salary. The final amount of the cash performance award will be determined by the Compensation Committee in 2014.
Registration Rights Agreement
In connection with a reorganization transaction we consummated upon the completion of our initial public offering, we entered into a registration rights agreement with Huntsman Family Holdings Company LLC and other stockholders pursuant to which they were granted demand and piggyback registration rights for the shares of our common stock controlled by them. The agreement provides that
177
we will pay the costs and expenses, other than underwriting discounts and commissions, related to the registration and sale of shares of our common stock that are registered pursuant to the agreement. The agreement contains customary registration procedures and indemnification and contribution provisions for the benefit of Huntsman Family Holdings and us. In addition, all of our stockholders who received shares of our common stock in the reorganization transaction, including certain of our directors, executive officers and other key officers, have the right to include their shares in certain registrations. Our Executive Chairman, Jon M. Huntsman, and our Division President, Advanced Materials, James H. Huntsman, are affiliates of Huntsman Family Holdings. In addition, Peter R. Huntsman, our Chief Executive Officer, and J. Kimo Esplin, our Chief Financial Officer, are parties to the registration rights agreement.
Indemnification Agreements
We entered into indemnification agreements with our directors and officers, including each of our named executive officers, in connection with the completion of our initial public offering. Pursuant to these agreements, we agree to provide customary indemnification to our officers and directors against expenses incurred by such persons in connection with their service as directors or officers (as applicable) or in connection with their service at our request as directors, officers, trustees, employees or agents of other entities.
178
You can find the definitions of certain terms used in this description under the subheading "—Certain Definitions." In this description, the phrase "Huntsman International" refers only to Huntsman International LLC, a wholly owned Subsidiary of Huntsman Corporation, and not to any of its Subsidiaries. Additionally, the word "guarantors" refers to our Subsidiaries who will initially guarantee the notes as described below and any other Subsidiary of Huntsman International that in the future agrees to become a guarantor.
On November 19, 2012, we issued $400.0 million in aggregate principal amount of 4.875% Senior Notes due 2020 (the "initial notes") under an indenture dated November 19, 2012 among our Company, the guarantors and Wells Fargo Bank, National Association, as trustee (the "Trustee"). On March 4, 2013, we issued $250.0 million in aggregate principal amount of additional notes under the indenture dated November 19, 2012 (the "old notes"). The old notes are treated together with the initial notes as a single series of debt securities for all purposes under the indenture, including, without limitation, waivers, amendments, redemptions and offers to purchase, and have terms identical to the initial notes, other than issue date and offering price. Accordingly, the $250.0 million in aggregate principal amount of old notes carry only approximately 38% of the total voting power of the $650.0 million in aggregate principal amount of notes outstanding. The terms of the new notes include those stated in the indenture and those made part of the indenture by reference to the Trust Indenture Act of 1939, as amended (the "Trust Indenture Act").
The indenture provides for the issuance of an unlimited amount of additional notes (including the $250.0 million of old notes and the new notes to be issued in exchange for the old notes). The term "notes" as used in this description will mean all notes issued pursuant to the indenture and will include all notes issued in exchange for any such notes pursuant to a registration rights agreement, from time to time outstanding. All additional notes will be identical to the initial notes and will constitute a part of the same series, including with respect to redemption and matters requiring approval of the holders. There can be no assurances, however, that any additional notes subsequently issued under the indenture will be treated as fungible with the initial notes for United States federal income tax purposes.
The following description is a summary of the material provisions of the indenture dated November 19, 2012 and the exchange and registration rights agreement dated March 4, 2013, by and among Huntsman International and the initial purchasers of the notes, for the benefit of the holders of the old notes. It does not restate those agreements in their entirety. The outstanding old notes that you currently hold and the new notes that will be issued upon exchange of the old notes that you hold will be identical in all material respects, except that the new notes will have been registered under the Securities Act. Accordingly, unless specified to the contrary, the following description applies to both the outstanding old notes that you currently hold and the new notes to be issued upon exchange of your old notes. We urge you to read the indenture and the exchange and registration rights agreement because they, and not this description, define your rights as holders of the notes. Copies of the indenture and the exchange and registration rights agreement with respect to the $250 million of old notes sold pursuant to a purchase agreement dated February 28, 2013 were filed with the Securities and Exchange Commission as exhibits to our current reports on Form 8-K dated November 19, 2012 and March 4, 2013, respectively. You may read and copy these exhibits and any reports, statements or other information that we and our parent have filed with the SEC, at the SEC's public reference room at 100 F Street, N.E., Room 1580, Washington, D.C. 20549. You may also request copies of these documents, upon payment of a duplicating fee, by writing to the Public Reference Section of the SEC. Please call the SEC at 1-800-SEC-0330 for further information on the operation of the SEC's Public Reference Rooms. The SEC also maintains an Internet site at http://www.sec.gov from which you can access our filings and our parent's filings.
179
The registered holder of a note will be treated as its owner for all purposes under the terms of the indenture. Only registered holders will have rights under the indenture.
Brief Description of the Notes and the Guarantees
The Notes
The notes are:
Since the notes are unsecured, in the event of a bankruptcy or insolvency, Huntsman International's secured lenders will have a prior secured claim with respect to any collateral securing the debt owed to them.
The Guarantees
As of the date of this prospectus, Airstar Corporation, Huntsman Advanced Materials Americas LLC, Huntsman Advanced Materials LLC, Huntsman Australia LLC, Huntsman Australia Holdings LLC, Huntsman Chemical Purchasing LLC, Huntsman Enterprises LLC, Huntsman Ethyleneamines LLC, Huntsman Fuels LLC, Huntsman International Financial LLC, Huntsman International Fuels LLC, Huntsman International Trading Corporation, Huntsman MA Investment Corporation, Huntsman MA Services Corporation, Huntsman Petrochemical LLC, Huntsman Petrochemical Purchasing LLC, Huntsman Procurement LLC, Huntsman Propylene Oxide LLC, Huntsman Purchasing, Ltd., Polymer Materials Inc., Huntsman Surfactants Technology Corporation, Tioxide Americas (Holdings) LLC, Tioxide Americas LLC and Tioxide Group, are our only Subsidiaries that will guarantee Huntsman International's obligations under the notes and the indenture. Other Subsidiaries may become guarantors after the consummation of the offering of the additional notes as provided in the indenture. The obligations of the guarantors under their guarantees will be limited as necessary to minimize the risk that such guarantees would constitute a fraudulent conveyance under applicable law. See "Risk Factors—The notes and guarantees may be void, avoided or subordinated under laws governing fraudulent transfers and insolvency."
The guarantees of the notes are:
Since the guarantees are unsecured obligations of each guarantor, in the event of a bankruptcy or insolvency, such guarantor's secured lenders will have a prior secured claim to any collateral securing the debt owed to them.
180
As of December 31, 2012, as adjusted for the offering of the old notes and the application of the proceeds thereof, Huntsman International LLC and the guarantors would have had approximately $2.9 billion of outstanding senior indebtedness (excluding intercompany subsidiary indebtedness but including the note payable to our parent), of which approximately $1.6 billion would have been secured. Further and not included above, our non-guarantor Subsidiaries had approximately $661 million of indebtedness (excluding intercompany subsidiary indebtedness) outstanding on December 31, 2012. See "Note 28. Condensed Consolidating Financial Information" to our audited consolidated financial statements for certain financial information about our non-guarantor Subsidiaries.
The obligations of any guarantor under its guarantee of the notes will be automatically and unconditionally released and discharged when any of the following occurs:
Principal, Maturity and Interest of Notes
The notes will be issued in denominations of $2,000 and integral multiples of $1,000 in excess thereof. The notes will mature on November 15, 2020, at the principal amount, plus accrued and unpaid interest and special interest, if any, to, but not including, the maturity date.
Interest on the notes will accrue at the rate of 4.875% per annum. Interest on the notes is payable semi-annually in arrears on May 15 and November 15, commencing on May 15, 2013. Huntsman International will make each interest payment to the holders of record of the notes on the immediately preceding May 1 and November 1.
Interest on the notes will accrue from November 19, 2012, or, if interest has already been paid, from the date it was most recently paid. Interest will be computed on the basis of a 360-day year comprised of twelve 30-day months.
Optional Redemption
Prior to the date that is 90 days prior to the scheduled maturity date of the notes, Huntsman International may redeem all or part of the notes upon not less than 30 nor more than 60 days' notice, at a redemption price equal to 100% of the principal amount thereof plus the Applicable Premium as of, and accrued and unpaid interest and special interest, if any, to, but not including, the applicable redemption date (subject to the right of holders of record on the relevant record date to receive interest due on the relevant interest payment date).
181
At any time on or after the date that is 90 days prior to the final maturity date of the notes, Huntsman International may redeem all or part of the notes upon not less than 30 nor more than 60 days' notice, at a redemption price equal to 100% of the principal amount thereof, plus accrued and unpaid interest and special interest, if any, to, but not including, the applicable redemption date (subject to the right of holders of record on the relevant record date to receive interest due on the relevant interest payment date).
Selection and Notice
If less than all the notes are to be redeemed at any time in connection with an optional redemption, the trustee will select notes on a pro rata basis, unless another method is required by law or stock exchange requirement or the procedures of DTC.
No notes of $2,000 or less may be redeemed in part. Notices of redemption will be sent by first class mail or sent electronically at least 30 but not more than 60 days before the redemption date to each holder of notes to be redeemed at its registered address except that redemption notices may be sent more than 60 days prior to a redemption date if the notice is issued in connection with a defeasance of the notes or a satisfaction and discharge of the indenture, in each case in accordance with the provisions of the indenture.
A notice of redemption will state:
Any notice of redemption may be given prior to the completion of any event or transaction related to such redemption, and any such redemption or notice may be subject to one or more conditions precedent. In addition, if such redemption or notice is subject to satisfaction of one or more conditions precedent, such notice will state that, in the discretion of Huntsman International, the redemption date may be delayed until such time as any or all of such conditions have been satisfied, or such redemption may not occur and such notice may be rescinded in the event that any or all such conditions have not been satisfied by the redemption date, or by the redemption date so delayed.
Upon surrender of a physical note to be redeemed in part, Huntsman International will issue a new note in a principal amount equal to and in exchange for the unredeemed portion of the original note in the name of the holder upon cancellation of the original note.
182
Change of Control
Upon the occurrence of a Change of Control Repurchase Event with respect to the notes, each holder of notes will have the right to require Huntsman International to repurchase all or any part of such holder's notes at a purchase price in cash equal to 101% of the principal amount thereof plus accrued and unpaid interest and special interest, if any, to the date of repurchase (subject to the right of holders of record on the relevant record date to receive interest due on the relevant interest payment date).
Within 30 days following any Change of Control Repurchase Event, Huntsman International will mail a notice (a "Change of Control Offer") to each holder of notes with a copy to the trustee stating:
A Change of Control Offer may be made in advance of a Change of Control, and conditioned upon the consummation of a Change of Control, if a definitive agreement is in place for the Change of Control at the time of making of the Change of Control Offer.
In addition, Huntsman International will not be required to make a Change of Control Offer with respect to the notes upon the consummation of a Change of Control Repurchase Event if a third party makes the Change of Control Offer in the manner, at the time and otherwise in compliance with the requirements set forth in the indenture applicable to a Change of Control Offer made by Huntsman International and purchases all notes properly tendered and not withdrawn under such Change of Control Offer.
Notes repurchased by Huntsman International pursuant to a Change of Control Offer will have the status of notes issued but not outstanding or will be retired and canceled at the option of Huntsman International. Notes purchased by a third party pursuant to the preceding paragraph will have the status of notes issued and outstanding.
We will comply, to the extent applicable, with the requirements of Section 14(e) of the Exchange Act and any other securities laws, rules or regulations in connection with the repurchase of notes pursuant to this covenant. To the extent that the provisions of any securities laws, rules or regulations conflict with any provision of this covenant, we will comply with the applicable securities laws, rules and regulations and will not be deemed to have breached our obligations under this covenant by virtue thereof.
This Change of Control repurchase provision is a result of negotiations between Huntsman International and the initial purchasers of the initial notes. We have no present intention to engage in a transaction that would constitute a Change of Control, although it is possible that we could decide to do so in the future. Subject to the limitations discussed below, we could, in the future, enter into certain transactions, including acquisitions, refinancings or other recapitalizations, that would not constitute a Change of Control under the indenture, but that could increase the amount of indebtedness outstanding at such time or otherwise affect our capital structure or credit rating.
183
The occurrence of events that would constitute a Change of Control may also constitute an event of default under or require repurchase of our currently outstanding indebtedness. Future indebtedness of Huntsman International or its Subsidiaries may contain prohibitions on certain events that would constitute a Change of Control or require such indebtedness to be repurchased upon a Change of Control. Moreover, the exercise by the holders of notes of their right to require us to repurchase the notes could cause a default under such credit facility, even if the Change of Control itself does not, due to the financial effect of such repurchase on us. Finally, our ability to pay cash to the holders upon a repurchase may be limited by our then existing financial resources. There can be no assurance that sufficient funds will be available when necessary to make any required repurchases. See "Risk Factors—Risks Relating to Our Indebtedness and the Notes—We may not have the ability to repurchase notes upon a change of control as required by the indenture."
The definition of Change of Control includes a phrase relating to the sale, lease or transfer of "all or substantially all" the assets of Huntsman International and its Subsidiaries taken as a whole. Although there is a developing body of case law interpreting the phrase "substantially all" under New York law, which governs the indenture, there is no precise established definition of the phrase. Accordingly, the ability of a holder of notes to require us to repurchase such notes as a result of a sale, lease or transfer of less than all of the assets of Huntsman International and its Subsidiaries, taken as a whole, to another Person or group may be uncertain.
The provisions under the indenture relating to our obligation to make an offer to repurchase the notes as a result of a Change of Control Repurchase Event may be waived or modified with the written consent of the holders of a majority in aggregate principal amount of the notes.
Certain Covenants
As of the Issue Date, all the Subsidiaries of Huntsman International were "Restricted Subsidiaries" other than Huntsman China Investments B.V., Huntsman Distribution Corporation, Huntsman SA Investment Corporation, Huntsman Styrenics Investments Holdings LLC, Huntsman Verwaltungs GmbH, Huntsman Pigments LLC, Huntsman Saudi Industries BV, Huntsman Offshore Investments Limited and their respective subsidiaries. However, under certain circumstances we are permitted to designate certain of our other subsidiaries as "Unrestricted Subsidiaries." Unrestricted Subsidiaries are not subject to the restrictive covenants in the indenture.
Limitation on Secured Debt. The indenture provides that neither Huntsman International nor any of its Restricted Subsidiaries will create, incur, issue, assume or guarantee any indebtedness for borrowed money secured by a mortgage, security interest, pledge or lien (which we refer to herein, collectively, as a "mortgage") on or upon any Principal Property, whether owned at the Issue Date or acquired after the Issue Date, without ensuring that the notes (together, at Huntsman International's option, with any other indebtedness created, issued, assumed or guaranteed by Huntsman International or any of its Restricted Subsidiaries then existing or thereafter created) will be secured by such mortgage equally and ratably with (or, at Huntsman International's option, prior to) such indebtedness for so long as such indebtedness is so secured. This restriction will not apply to indebtedness secured by any of the following:
184
Notwithstanding the restrictions described above, Huntsman International and its Restricted Subsidiaries may, without having to equally and ratably secure the notes, issue, assume or guarantee indebtedness secured by a mortgage, if at the time of such issuance, assumption or guarantee, after giving effect thereto and to the retirement of any indebtedness that is concurrently being retired, the aggregate amount of all such indebtedness secured by mortgages that would otherwise be subject to such restriction (other than any indebtedness secured by mortgages permitted as described in clauses (1) through (9) of the immediately preceding paragraph) plus the aggregate amount (without duplication) of (a) all Non-Guarantor Subsidiary Debt (other than Non-Guarantor Subsidiary Debt described in clauses (1) through (7) of the first sentence of the second paragraph of the covenant described below under the caption "—Limitation on Subsidiary Debt") and (b) all Attributable Debt of Huntsman International and any of its Restricted Subsidiaries in respect of Sale and Lease-Back Transactions (with the exception of any such transactions permitted under clauses (1) and (2) of the first sentence of the first paragraph of the covenant described below under the caption "—Limitation on Sale and Lease-Back Transactions") does not exceed 15% of the Consolidated Net Tangible Assets of Huntsman International as of the date on which any such indebtedness is incurred.
Limitation on Subsidiary Debt. The indenture provides that Huntsman International will not permit any of its Restricted Subsidiaries that is not a guarantor to create, assume, incur, issue or guarantee any indebtedness for borrowed money (any such indebtedness of a non-guarantor Subsidiary,
185
"Non-Guarantor Subsidiary Debt"), unless such Restricted Subsidiary guarantees the payment of the principal of, premium, if any, and interest on the notes on an unsecured unsubordinated basis.
The foregoing restriction will not apply to Non-Guarantor Subsidiary Debt constituting:
Notwithstanding the restrictions described above, Huntsman International and any of its Restricted Subsidiaries may create, incur, issue, assume or guarantee Non-Guarantor Subsidiary Debt, without guaranteeing the notes, if at the time of such creation, incurrence, issuance, assumption or guarantee, after giving effect thereto and to the retirement of any indebtedness that is concurrently being retired, the aggregate amount of all such Non-Guarantor Subsidiary Debt that would otherwise be subject to such restrictions (other than Non-Guarantor Subsidiary Debt described in clauses (1) through (7) of the immediately preceding paragraph) plus the aggregate amount (without duplication) of (a) all indebtedness secured by mortgages (not including any such indebtedness secured by mortgages described in clauses (1) through (9) of the first paragraph of the covenant described above under the caption "—Limitation on Secured Debt") and (b) all Attributable Debt of Huntsman International and any of its Restricted Subsidiaries in respect of Sale and Lease-Back Transactions (with the exception of any such transactions that are permitted under clauses (1) and (2) of the first sentence of the first paragraph of the covenant described below under the caption "—Limitation on Sale and Lease-Back Transactions") does not exceed 15% of the Consolidated Net Tangible Assets of Huntsman International as of the date on which any such indebtedness is incurred.
186
Limitation on Sale and Lease-Back Transactions. The indenture provides that neither Huntsman International nor any of its Restricted Subsidiaries will enter into any Sale and Lease-Back Transaction with respect to any of their Principal Properties unless:
Merger, Consolidation and Sale of Assets. The indenture provides that Huntsman International may consolidate or merge with or into any other Person, or lease, sell or transfer all or substantially all of its property and assets if:
187
If, upon any such consolidation or merger, or upon any such lease, sale or transfer of property and assets, any Principal Property owned immediately prior to the transaction, would thereupon become subject to a mortgage securing any indebtedness for borrowed money of, or guaranteed by, such other Person (other than any mortgage, security interest, pledge or mortgage permitted pursuant to clauses (1) through (9) of the first sentence of the second paragraph of the covenant described above under the caption "—Certain Covenants—Limitation on Secured Debt" above), Huntsman International or such Restricted Subsidiary will, prior to such consolidation, merger, lease, sale or transfer, by executing and delivering to the trustee a supplemental indenture, secure the due and punctual payment of the principal of, and any premium and interest on, the notes (together, at Huntsman International's option, with any other indebtedness of, or guaranteed by, Huntsman International or any of its Restricted Subsidiaries then existing or thereafter created) equally and ratably with (or, at Huntsman International's option, prior to) the indebtedness secured by such mortgage for so long as such indebtedness is so secured.
The indenture further provides that any guarantor may consolidate or merge with or into any other Person, or sell, lease or transfer all or substantially all of the properties or assets of such guarantor if:
Subject to certain limitations described in the indenture, the successor guarantor (if other than such guarantor) will succeed to, and be substituted for, such guarantor under the indenture and such guarantor's obligations in respect of the notes, and such guarantor will automatically be released and discharged from its obligations under the indenture and such guarantor's obligations in respect of the notes.
In addition, notwithstanding the foregoing, Huntsman International or any guarantor may (a) consolidate or merge with or into, or sell, lease or transfer all or substantially all of its properties or assets to, Huntsman International or any of its Restricted Subsidiaries or (b) merge or consolidate with an affiliate incorporated solely for the purpose of reincorporating or reorganizing Huntsman International or such guarantor in another jurisdiction.
Reports to Holders. The indenture provides that, whether or not required by the SEC, so long as any notes are outstanding, Huntsman International will furnish to the trustee and to the holders of notes, within the time periods specified in the SEC's rules and regulations including any extension periods available under such rules and regulations and excluding any requirement and time periods
188
applicable to "accelerated filers" (as defined in Rule 12b-2 under the Exchange Act) under such rules and regulations, and make available to securities analysts and potential investors upon request:
Notwithstanding the foregoing, Huntsman International will not be required to furnish any information or reports that are separate from information or reports furnished by Huntsman Corporation, and the requirements specified in this paragraph will be deemed to be satisfied upon Huntsman Corporation's filing of its required reports within the time periods specified in the SEC's rules and regulations including any extension periods available under such rules and regulations, in each case provided that the assets, liabilities, revenues and net income of Huntsman Corporation are substantially similar to those of Huntsman International at the time of such filing.
If Huntsman International has designated as an Unrestricted Subsidiary any of its Subsidiaries that would constitute a significant subsidiary within the meaning of Regulation S-X under the Exchange Act, then the quarterly and annual financial information required by the preceding paragraph will include a reasonably detailed presentation, either on the face of the financial statements or in the footnotes or schedules thereto, or in Narrative Analysis of Results of Operations or Management's Discussion and Analysis of Financial Condition and Results of Operations, as applicable, of the financial condition and results of operations of Huntsman International and its Restricted Subsidiaries separate from the financial condition and results of operations of any such Unrestricted Subsidiaries of Huntsman International.
In the event that any direct or indirect parent company of Huntsman International is or becomes a guarantor of the notes, the indenture permits Huntsman International to satisfy its obligations in this covenant with respect to financial information relating to Huntsman International by furnishing financial information relating to such direct or indirect parent company as provided in Section 3-10 of Regulation S-X under the Exchange Act.
Events of Default
Each of the following events is an "Event of Default" under the indenture:
189
and in each case, the aggregate principal amount of such indebtedness unpaid or accelerated aggregates $100.0 million or more and has not been discharged in full or such acceleration has not been rescinded or annulled within 30 days of such final maturity or acceleration;
If an Event of Default arising from certain events of bankruptcy with respect to Huntsman International occurs and is continuing, then all unpaid principal of, and premium, if any, and accrued and unpaid interest on all of the outstanding notes will become immediately due and payable without further action or notice. If any other Event of Default occurs and is continuing, then the trustee or the holders of at least 25% in principal amount of outstanding notes may declare the principal of and accrued interest on all the notes to be due and payable by notice in writing (the "Acceleration Notice") to Huntsman International and the trustee, which notice must also specify that it is a "notice of acceleration." In that event, the notes will become immediately due and payable.
At any time after a declaration of acceleration with respect to the notes as described in the preceding paragraph, the holders of a majority in principal amount of the outstanding notes may rescind and cancel such declaration and its consequences:
No such rescission shall affect any subsequent Default or impair any right consequent thereto.
The holders of a majority in principal amount of the outstanding notes may waive any existing Default or Event of Default under the indenture, and its consequences, except a default in the payment of the principal of or interest on any notes.
Holders of the notes may not enforce the indenture or the notes except as provided in the indenture. Subject to certain limitations, the holders of a majority in aggregate principal amount of the then outstanding notes may direct the trustee in its exercise of any trust or power or may exercise any
190
of the trustee's powers. Subject to the provisions of the indenture relating to the duties of the trustee, the trustee will be under no obligation to exercise any of its rights or powers under the indenture at the request, order or direction of any of the holders, unless such holders have offered to the trustee indemnity satisfactory to it. The trustee may withhold from holders of the notes notice of any continuing Default or Event of Default (except a Default or Event of Default relating to the payment of principal, premium or interest) if it determines in good faith that withholding notice is in their interest.
Under the indenture, Huntsman International will be required to provide an officers' certificate to the trustee promptly upon any officer obtaining knowledge of any Default or Event of Default, and will provide a certification at least annually as to whether or not they know of any Default or Event of Default, that has occurred and, if applicable, describe such Default or Event of Default and the status thereof.
Legal Defeasance and Covenant Defeasance
Huntsman International may, at its option and at any time, elect to have its obligations and the obligations of the guarantors discharged with respect to the outstanding notes ("Legal Defeasance"). Legal Defeasance means that Huntsman International will be deemed to have paid and discharged the entire indebtedness represented by the outstanding notes, except for:
In addition, Huntsman International may, at its option and at any time, elect to have the obligations of Huntsman International released with respect to certain covenants that are described in the indenture ("Covenant Defeasance") and will be absolved from liability thereafter for failing to comply with such obligations with respect to the notes. In the event Covenant Defeasance occurs, certain events (not including non-payment, bankruptcy, receivership, reorganization and insolvency events) described under "Events of Default" will no longer constitute an Event of Default with respect to the notes.
In order to exercise either Legal Defeasance or Covenant Defeasance:
191
in either case to the effect that, and based thereon such opinion of counsel shall confirm that, the holders of the outstanding notes will not recognize income, gain or loss for federal income tax purposes as a result of such Legal Defeasance and will be subject to federal income tax on the same amounts, in the same manner and at the same times as would have been the case if such Legal Defeasance had not occurred; provided, however, such opinion of counsel shall not be required if all the notes will become due and payable on the maturity date within one year or are to be called for redemption within one year under arrangements satisfactory to the trustee;
Satisfaction and Discharge
The indenture will be discharged and will cease to be of further effect (except as to surviving rights or registration of transfer or exchange of the notes, as expressly provided for in the indenture) as to all outstanding notes when
192
instructions delivered by Huntsman International to the trustee to effect the redemption of the notes), and Huntsman International has irrevocably deposited or caused to be deposited with the trustee as trust funds in trust solely for the benefit of the holders of such notes, funds in amounts as will be sufficient without consideration of any reinvestment of interest to pay and discharge the entire indebtedness on such notes not already delivered to the trustee for cancellation, for principal of, premium, if any, and interest on the notes to the date of deposit together with irrevocable instructions from Huntsman International directing the trustee to apply such funds to the payment thereof at maturity or redemption, as the case may be;
All funds that remain unclaimed for one year will be paid to Huntsman International, and thereafter holders of notes must look to Huntsman International for payment as general creditors.
Cancellation
All notes which are redeemed by or on behalf of Huntsman International will be cancelled and, accordingly, may not be reissued or resold. If Huntsman International purchases any notes, such acquisition shall not operate as a redemption unless such notes are surrendered for cancellation.
Withholding Taxes
As described under "Certain United States Federal Income Tax Consequences," a holder of notes may be subject to withholding taxes and Huntsman International will not be required to pay any additional amounts to cover such withholding taxes.
Modification of the Indenture
Without the consent of each holder of an outstanding note affected thereby, no amendment of the indenture, the notes or the guarantees may:
193
Other modifications and amendments of the indenture, the notes or the guarantees may be made with the consent of the holders of a majority in principal amount of the then outstanding notes affected thereby.
Without the consent of any holders of notes, Huntsman International, the guarantors and the trustee also may amend or supplement the indenture or the notes or the guarantees to:
Governing Law
The indenture provides that it, the notes and the guarantees will be governed by, and construed in accordance with, the laws of the State of New York.
The Trustee
The indenture provides that, except during the continuance of an Event of Default, the trustee will perform only such duties as are specifically set forth in the indenture. During the existence of an Event of Default, the trustee will exercise such rights and powers vested in it by the indenture, and use the same degree of care and skill in its exercise as a prudent person would exercise or use under the circumstances in the conduct of his or her own affairs.
The indenture and the provisions of the Trust Indenture Act will contain certain limitations on the rights of the trustee, should it become a creditor of Huntsman International, to obtain payments of claims in certain cases or to realize on certain property received in respect of any such claim as security or otherwise. Subject to the Trust Indenture Act, the trustee will be permitted to engage in other transactions; provided that if the trustee acquires any conflicting interest as described in the Trust Indenture Act, it must eliminate such conflict or resign.
Certain Definitions
Set forth below is a summary of certain of the defined terms used in the indenture. Reference is made to the indenture for the full definition of all such terms, as well as any other terms used herein for which no definition is provided.
194
"Adjusted Treasury Rate" means with respect to any redemption date, the rate per annum equal to the semiannual equivalent yield to maturity of the Comparable Treasury Issue, plus 0.50%.
"Applicable Premium" means in connection with the optional redemption of any note, the greater of:
"Asset Acquisition" means:
"Attributable Debt" means, in the context of a Sale and Lease-Back Transaction, the amount that Huntsman International determines in good faith to be the present value, discounted at the interest rate implicit in the lease involved in such Sale and Lease-Back Transaction, of the lessee's obligation under the lease for rental payments during the remaining term of such lease, as it may be extended. For purposes of this definition, any amounts lessee must pay, whether or not designated as rent or additional rent, on account of maintenance and repairs, insurance, taxes, assessments, water rates or similar charges or any amounts lessee must pay under the lease contingent upon the amount of sales, maintenance and repairs, insurance, taxes, assessments, water rates or similar charges are not included in the determination of lessee's obligations under the lease.
"Bank Product Obligations" means obligations under any agreement or other arrangement governing the provision of treasury or cash management services, including deposit accounts, overdraft, credit or debit card, funds transfer, automated clearinghouse, zero balance accounts, returned check concentration, controlled disbursement, lockbox, account reconciliation and reporting and trade finance services and other cash management services.
"Capitalized Lease Obligation" means, as to any Person, the obligations of such Person under a lease that are required to be classified and accounted for as capital lease obligations under GAAP and, for purposes of this definition, the amount of such obligations at any date shall be the capitalized amount of such obligations at such date, determined in accordance with GAAP.
"Change of Control" means the occurrence of any of the following:
195
For the avoidance of doubt, transactions among Huntsman International and its Subsidiaries will not constitute a Change of Control.
"Change of Control Offer" has the meaning assigned to such term under "—Change of Control."
"Change of Control Repurchase Event" means the occurrence of both a Change of Control and a Ratings Event.
"Commodity Agreement" means any commodity futures contract, commodity option or other similar agreement or arrangement entered into by Huntsman International or any of its Restricted Subsidiaries designed to protect Huntsman International or any of its Restricted Subsidiaries against fluctuations in the price of commodities actually at that time used in the ordinary course of business of Huntsman International or its Restricted Subsidiaries.
"Comparable Treasury Issue" means the United States Treasury Security with a constant maturity (as compiled and published in the most recent Federal Reserve Statistical Release H.15(519) that has become available at least two business days prior to the redemption date (or, if such Statistical Release is no longer published, any publicly available source of comparable market data)) most nearly equal to the remaining maturity of the note being redeemed; provided that, if such period is less than one year, the United States Treasury Security with a constant maturity of one year will be used.
"Consolidated Net Tangible Assets" means, with respect to any Person, as of any date, the Total Assets of such Person and its Subsidiaries less goodwill and intangibles (other than intangibles arising from, or relating to, intellectual property, licenses or permits (including, but not limited to, emissions rights) of such Person), in each case calculated in accordance with GAAP based upon the most recent internal financial statements available as of such date; provided that in the event that such Person or any of its Subsidiaries assumes or acquires any assets in connection with the transaction for which Consolidated Net Tangible Assets is being calculated, then Consolidated Net Tangible Assets will be calculated giving pro forma effect to such assumption or acquisition of assets, as if the same had occurred at the beginning of the applicable period.
"Currency Agreement" means any foreign exchange contract, currency swap agreement or other similar agreement or arrangement designed to protect Huntsman International or any Restricted Subsidiary of Huntsman International against fluctuations in currency values.
"Default" means an event or condition the occurrence of which is, or with the lapse of time or the giving of notice or both would be, an Event of Default.
"Exchange Act" means the Securities Exchange Act of 1934, as amended, or any successor statute or statutes thereto.
196
"Existing Senior Notes" means the $600.0 million in aggregate principal amount outstanding (as of the Issue Date) of the 5.5% Senior Notes due 2016 of Huntsman International.
"Existing Subordinated Notes" means the $530.0 million in aggregate principal amount of the 8.625% Senior Subordinated Notes due 2021 of Huntsman International and the $350.0 million in aggregate principal amount of 8.625% Senior Subordinated Notes due 2020 of Huntsman International.
"fair market value" means, with respect to any asset or property, the price which could be negotiated in an arm's-length, free market transaction, for cash, between a willing seller and a willing and able buyer, neither of whom is under undue pressure or compulsion to complete the transaction. Fair market value (i) with respect to a determination of value in excess of $100.0 million shall be determined by the Board of Managers of Huntsman International acting reasonably and in good faith and (ii) in all other cases, by an authorized officer of Huntsman International and delivered to the trustee in an officers' certificate.
"Foreign Subsidiary" means any Subsidiary of Huntsman International (other than a guarantor) organized under the laws of, and conducting a substantial portion of its business in, any jurisdiction other than the United States of America or any state thereof or the District of Columbia.
"GAAP" means generally accepted accounting principles set forth in the opinions and pronouncements of the Accounting Principles Board of the American Institute of Certified Public Accountants and statements and pronouncements of the Financial Accounting Standards Board or in such other statements by such other entity as may be approved by a significant segment of the accounting profession of the United States, which were in effect as of the Issue Date.
"Holdings U.K." means, Huntsman (Holdings) UK, a private unlimited company incorporated under the laws of England and Wales.
"Huntsman Corporation" means Huntsman Corporation, a Delaware corporation.
"Interest Swap Obligations" means the obligations of any Person pursuant to any arrangement with any other Person, whereby, directly or indirectly, such Person is entitled to receive from time to time periodic payments calculated by applying either a floating or a fixed rate of interest on a stated notional amount in exchange for payments made by such other Person calculated by applying a fixed or a floating rate of interest on the same notional amount and shall include, without limitation, interest rate swaps, caps, floors, collars and similar agreements.
"Issue Date" means the date on which the initial notes were first issued under the indenture.
"Investment Grade Rating" means a rating equal to or higher than Baa3 (or the equivalent) by Moody's and BBB- (or the equivalent) by S&P, or an equivalent rating by any other Rating Agency.
"Moody's" means Moody's Investors Service, Inc. and its successors.
"Permitted Liens" means each of the following:
197
"Person" means an individual, partnership, corporation, unincorporated organization, trust or joint venture, or a governmental agency or political subdivision thereof.
"Principal Property" means, as of any date, any property, plant and equipment comprising a manufacturing facility owned by Huntsman International or any of its Restricted Subsidiaries; provided that Huntsman International may exclude (and subsequently include in whole or in part, at its option) from "Principal Property" any such facilities with an aggregate fair market value not in excess of 5.0% of Consolidated Net Tangible Assets of Huntsman International, determined as of the date of such exclusion.
"Qualified Securitization Transaction" means any transaction or series of transactions that may be entered into by Huntsman International or any of its Subsidiaries pursuant to which Huntsman International or any of its Subsidiaries may sell, convey or otherwise transfer pursuant to terms necessary or customary in the relevant jurisdiction, directly or indirectly, to
or may grant a security interest, in any accounts receivable or any participations or other interests therein (whether now existing or arising or acquired in the future) of Huntsman International or any of
198
its Subsidiaries or other entities formed as necessary or customary under the laws of the relevant jurisdiction, and any assets related thereto including, without limitation, all collateral securing such accounts receivable, all contracts and contract rights and all guarantees or other obligations in respect of such accounts receivable, proceeds of such accounts receivable and other assets (including contract rights) which are necessarily or customarily transferred in the relevant jurisdiction or in respect of which security interests are necessarily or customarily granted in the relevant jurisdiction in connection with asset securitization transactions involving accounts receivable.
"Rating Agency" means each of (i) S&P and Moody's or (ii) if either S&P or Moody's or both of them are not making ratings of the notes publicly available, a nationally recognized U.S. rating agency or agencies, as the case may be, selected by Huntsman International, which will be substituted for S&P or Moody's or both, as the case may be.
"Ratings Event" means (1) to the extent the notes were rated with an Investment Grade Rating by either of the Rating Agencies at the commencement of the Relevant Period (as defined below), and the ratings of such notes are downgraded by one or both of the Rating Agencies on any date from the date of the public notice of an arrangement that could result in a Change of Control until the end of the 60-day period following public notice of the occurrence of the Change of Control (the "Relevant Period") such that the rating of the notes by both of the Rating Agencies at the end of the Relevant Period is below an Investment Grade Rating, which downgrading is a result of the transactions constituting or occurring simultaneously with the applicable Change of Control (as evidenced by a public statement by the Rating Agency or Rating Agencies that downgraded the notes) or (2) to the extent the notes were not rated with an Investment Grade Rating by either of the Rating Agencies at the commencement of the Relevant Period, the notes continue to be rated at a level below an Investment Grade Rating by both of the Rating Agencies at the end of the Relevant Period.
"Restricted Subsidiary" of any Person means any Subsidiary of such Person that owns one or more Principal Properties and that, at the time of determination, is not an Unrestricted Subsidiary.
"S&P" means Standard & Poor's Ratings Services, a division of the McGraw-Hill Companies, Inc. and its successors.
"Sale and Lease-Back Transaction" means the leasing by Huntsman International or any of its Restricted Subsidiaries of any asset, whether owned at the Issue Date or acquired after the Issue Date (except for temporary leases for a term, including any renewal term, of up to three years and except for leases between or among Huntsman International and any of its Restricted Subsidiaries), which property has been or is to be sold or transferred by Huntsman International or any of its Restricted Subsidiaries to any party with the intention of taking back a lease of such property.
"SEC" means the Securities and Exchange Commission.
"Securitization Entity" means a wholly owned Subsidiary of Huntsman International (or Tioxide Group, Holdings U.K. or another Person in which Huntsman International or any Subsidiary of Huntsman International makes an investment and to which Huntsman International or any Subsidiary of Huntsman International transfers, directly or indirectly, accounts receivable or participations or interests therein or related assets) which engages in no activities other than in connection with the financing of accounts receivable and which is designated by the board of managers of Huntsman International (as provided below) as a Securitization Entity
199
Any such designation by the board of managers of Huntsman International shall be evidenced to the trustee by filing with the trustee a certified copy of the resolution of the board of managers of Huntsman International giving effect to such designation and an officers' certificate certifying that such designation complied with the foregoing conditions; provided that Huntsman Receivables Finance LLC and Huntsman Receivables Finance II LLC shall be deemed to have been so designated as of the Issue Date.
"Significant Subsidiary" means any Restricted Subsidiary of Huntsman International which, at the date of determination, is a "Significant Subsidiary" as such term is defined in Regulation S-X under the Exchange Act.
"Standard Securitization Undertakings" means obligations, representations, warranties, covenants and indemnities entered into by Huntsman International or any Securitization Entity or any Subsidiary of Huntsman International which are customary or necessary in the relevant jurisdiction in an accounts receivable securitization transaction. Following the Initial Public Equity Offering of a Huntsman Public Parent, references in the foregoing definition to "Huntsman International" shall be deemed also to refer to such Huntsman Public Parent.
"Subsidiary" means with respect to any Person, (1) any corporation of which the outstanding capital stock having at least a majority of the votes entitled to be cast in the election of managers or directors, as applicable, under ordinary circumstances shall at the time be owned, directly or indirectly, by such Person; or (2) any other Person of which at least a majority of the voting interests under ordinary circumstances is at the time, directly or indirectly, owned by such Person.
"Total Assets" means, with respect to any Person, as of any date, the total consolidated assets of such Person and its Subsidiaries, without giving effect to any amortization of the amount of intangible assets since the Issue Date, as shown on the most recent internal balance sheet of such Person available of such date, prepared in accordance with GAAP.
"Unrestricted Subsidiary" of any Person means:
200
Huntsman China Investments B.V., Huntsman Distribution Corporation, Huntsman SA Investment Corporation, Huntsman Styrenics Investments Holdings LLC, Huntsman Verwaltungs GmbH, Huntsman Pigments LLC, Huntsman Saudi Industries BV, Huntsman Offshore Investments Limited and their respective Subsidiaries are Unrestricted Subsidiaries as of the date of the offering of the old notes. In the future, the board of managers of Huntsman International may designate any Subsidiary (including any newly acquired or newly formed subsidiary) to be an Unrestricted Subsidiary if:
The board of managers of Huntsman International may designate any Unrestricted Subsidiary to be a Restricted Subsidiary only if immediately before and immediately after giving effect to such designation, no Default or Event of Default will have occurred and be continuing.
Any such designation by the board of managers of Huntsman International will be evidenced to the trustee by promptly filing with the trustee a copy of the board resolution approving the designation and an officers' certificate certifying that the designation complied with the indenture.
Book-Entry; Delivery and Form
Notes sold in reliance on Rule 144A will initially be represented by permanent global notes in fully registered form without interest coupons (each a "Restricted Global Note") and will be deposited with the trustee as a custodian for DTC and registered in the name of a nominee of such depositary.
Notes sold in offshore transactions in reliance on Regulation S under the Securities Act will initially be represented by global notes in fully registered form without interest coupons (each a "Regulation S Global Note") and will be deposited with the trustee as custodian for DTC, as depositary, and registered in the name of a nominee of such depositary. Prior to expiration of the "distribution compliance period" (as defined in Regulation S) and, a beneficial interest in the Regulation S Global Note may be transferred to a person who takes delivery in the form of an interest in the Restricted Global Note only upon receipt by the trustee of a written certification from the transferor to the effect that such transfer is being made to a person whom the transferor reasonably believes is a QIB in a transaction meeting the requirements of Rule 144A. Beneficial interests in a Restricted Global Note may be transferred to a person who takes delivery in the form of an interest in a Regulation S Global Note whether before, on or after such time, only upon receipt by the trustee of a written certification to the effect that such transfer is being made in accordance with Regulation S.
Any beneficial interest in a Regulation S Global Note or a Restricted Global Note (each a "Global Note") that is transferred to a person who takes delivery in the form of an interest in a Restricted Global Note or a Regulation S Global Note, respectively, will, upon transfer, cease to be an interest in the type of Global Note previously held and become an interest in the other type of Global Note and, accordingly, will thereafter be subject to all transfer restrictions, if any, and other procedures applicable to beneficial interests in such other type of Global Note for as long as it remains such an interest.
201
The Global Notes
We expect that pursuant to procedures established by DTC (i) upon the issuance of the Global Notes, DTC or its custodian will credit, on its internal system, the principal amount at maturity of the individual beneficial interests represented by such Global Notes to the respective accounts of persons who have accounts with such depositary and (ii) ownership of beneficial interests in the Global Notes will be shown on, and the transfer of such ownership will be effected only through, records maintained by DTC or its nominee (with respect to interests of participants) and the records of participants (with respect to interests of persons other than participants). Such accounts initially will be designated by or on behalf of the initial purchasers and ownership of beneficial interests in the Global Notes will be limited to persons who have accounts with DTC ("participants") or persons who hold interests through participants. Holders may hold their interests in the Global Notes directly through DTC if they are participants in such system, or indirectly through organizations which are participants in such system.
So long as DTC, or its nominee, is the registered owner or holder of the notes, DTC or such nominee, as the case may be, will be considered the sole owner or holder of the notes represented by such Global Notes for all purposes under the indenture. No beneficial owner of an interest in the Global Notes will be able to transfer that interest except in accordance with DTC's procedures, in addition to those provided for under the indenture.
Payments of the principal of, premium (if any), and interest (including additional interest) on the Global Notes will be made to DTC or its nominee, as the case may be, as the registered owner thereof. Neither us nor the trustee or any paying agent will have any responsibility or liability for any aspect of the records relating to or payments made on account of beneficial ownership interests in the Global Notes or for maintaining, supervising or reviewing any records relating to such beneficial ownership interest.
We expect that DTC or its nominee, upon receipt of any payment of principal, premium, if any, or interest (including additional interest) on the Global Notes, will credit participants' accounts with payments in amounts proportionate to their respective beneficial interests in the principal amount of the Global Notes as shown on the records of DTC or its nominee. We also expect that payments by participants to owners of beneficial interests in the Global Notes held through such participants will be governed by standing instructions and customary practice, as is now the case with securities held for the accounts of customers registered in the names of nominees for such customers. Such payments will be the responsibility of such participants.
Transfers between participants in DTC will be effected in the ordinary way through DTC's same-day funds system in accordance with DTC rules and will be settled in same day funds. DTC has advised us that it will take any action permitted to be taken by a holder of notes (including the presentation of notes for exchange as described below) only at the direction of one or more participants to whose account the DTC interests in the Global Notes are credited and only in respect of such portion of the aggregate principal amount of notes as to which such participant or participants has or have given such direction.
DTC has advised us as follows: DTC is a limited purpose trust company organized under the laws of the State of New York, a member of the Federal Reserve System, a "clearing corporation" within the meaning of the Uniform Commercial Code and a "Clearing Agency" registered pursuant to the provisions of Section 17A of the Exchange Act. DTC was created to hold securities for its participants and facilitate the clearance and settlement of securities transactions between participants through electronic book-entry changes in accounts of its participants, thereby eliminating the need for physical movement of certificates. Participants include securities brokers and dealers, banks, trust companies and clearing corporations and certain other organizations. Indirect access to the DTC system is available to others such as banks, brokers, dealers and trust companies that clear through or maintain a custodial relationship with a participant, either directly or indirectly ("indirect participants").
202
Although DTC has agreed to the foregoing procedures in order to facilitate transfers of interests in the Global Notes among participants of DTC, it is under no obligation to perform such procedures, and such procedures may be discontinued at any time. Neither we nor the trustee will have any responsibility for the performance by DTC or its participants or indirect participants of their respective obligations under the rules and procedures governing their operations.
Certificated Securities
Certificated notes shall be issued in exchange for beneficial interests in the Global Notes only (i) following an Event of Default, at the request of DTC or (ii) if DTC is at any time unwilling or unable to continue as a depositary for the Global Notes and a successor depositary is not appointed by us within 90 days.
Exchange Offer; Registration Rights
We and the initial purchasers of the old notes entered into an exchange and registration rights agreement on March 4, 2013, pursuant to which we agreed that we would, at our expense and for the benefit of the holders of the old notes, use our reasonable best efforts to:
Promptly after the registration statement is declared effective, we have agreed to commence the exchange offer. We will keep the exchange offer open for not less than 20 business days (or longer if required by applicable law) after the date notice of the exchange offer is mailed to the holders of the old notes. For each of the old notes validly tendered and not withdrawn before the expiration of the exchange offer, the holder who surrendered such old note will receive a new note having a principal amount equal to that of the surrendered old note. Under existing interpretations of the SEC contained in several no-action letters to third parties, the new notes will be freely transferable by holders thereof after the exchange offer without further registration under the Securities Act; provided, however, that each holder that wishes to exchange its old notes for new notes will be required to represent:
203
We agree to make available, during the period required by the Securities Act, a prospectus meeting the requirements of the Securities Act for use by Participating Broker-Dealers and other persons, if any, with similar prospectus delivery requirements for use in connection with any resale of new notes.
If on or before the date of consummation of the exchange offer, we are not permitted to effect an exchange offer because of any change in law or in currently prevailing interpretations of the staff of the SEC, then we will, in lieu of effecting registration of new notes, use our reasonable best efforts to cause a shelf registration covering resales of the notes (the "Shelf Registration Statement") to become effective and to remain effective until the earlier of two years following the effective date of such registration statement or such time as the notes are no longer required to be registered as provided in the registration rights agreement.
We will, in the event that a Shelf Registration Statement is filed, provide to each holder copies of the prospectus that is a part of the Shelf Registration Statement, notify each such holder when the Shelf Registration Statement for the notes has become effective and take certain other actions as are required to permit unrestricted resales of the notes. A holder that sells notes pursuant to the Shelf Registration Statement will generally be required to be named as a selling securityholder in the related prospectus and to deliver a prospectus to purchasers, will be subject to certain of the civil liability provisions under Securities Act in connection with such sales and will be bound by the provisions of the registration rights agreement that are applicable to such a holder (including certain indemnification rights and obligations).
Although we intend to file the registration statement described above, we cannot assure you that the registration statement will be filed or, if filed, will become effective.
In the event that:
then the per annum interest rate on the applicable notes will increase, for the period from the occurrence of the Registration Default until such time as no Registration Default is in effect (at which time the interest rate will be reduced to its initial rate) by 0.125% during the first 90-day period following the occurrence of such Registration Default, which rate shall increase by an additional 0.125% during each subsequent 90-day period, up to a maximum of 0.50%. Our obligation to pay additional interest shall cease when the registration default is cured or the notes are no longer required to be registered as provided in the registration rights agreement.
The summary herein of certain provisions of the registration rights agreement does not purport to be complete and is subject to, and is qualified in its entirety by reference to, all the provisions of the registration rights agreement, a copy of which will be available upon request.
204
MATERIAL UNITED STATES FEDERAL INCOME TAX CONSEQUENCES
The following discussion is a summary of the material United States federal income tax consequences relevant to the exchange of old notes for new notes, but is not intended to be a complete analysis of all potential tax effects. This discussion is based upon current provisions of the Internal Revenue Code of 1986, as amended, applicable Treasury regulations, judicial authority and administrative rulings and practice. There can be no assurance that the Internal Revenue Service (the "IRS") will not take a contrary view, and no ruling from the IRS has been or will be sought. Future legislative, judicial or administrative changes or interpretation could alter or modify the statements and conditions set forth herein. Any such changes or interpretations could be retroactive and could affect the tax consequences to holders. Certain holders (including insurance companies, tax-exempt organizations, financial institutions, broker-dealers, foreign corporations and persons who are not citizens or residents of the United States) may be subject to special rules not discussed below.
The exchange of old notes for new notes pursuant to the exchange offer will not be treated as a taxable exchange for United States federal income tax purposes. Accordingly, no gain or loss will be recognized as a result of exchanging old notes for new notes. Further, your tax basis in the old note will equal your tax basis in the new note determined as of the time of the exchange, and your holding period for the new note will include the period during which you held the old note.
WE RECOMMEND THAT EACH HOLDER CONSULT SUCH HOLDER'S OWN TAX ADVISOR AS TO THE PARTICULAR TAX CONSEQUENCES OF EXCHANGING SUCH HOLDER'S OLD NOTES FOR NEW NOTES, INCLUDING THE APPLICABILITY AND EFFECT OF ANY STATE, LOCAL OR FOREIGN TAX LAWS.
205
Each broker-dealer that receives new notes for its own account in the exchange offer must acknowledge that it will deliver a prospectus meeting the requirements of the Securities Act in connection with any resale of those notes. This prospectus, as it may be amended or supplemented from time to time, may be used by a broker-dealer in connection with resales of new notes received in the exchange offer for old notes where such old notes were acquired as a result of market-making activities or other trading activities. We have agreed that, for a period of 120 days after the consummation of the exchange offer, we will make this prospectus, as amended and supplemented, available to any broker-dealer for use in connection with any such resale.
Neither we nor any of the guarantors will receive any proceeds from any sale of new notes by broker-dealers. New notes received by broker-dealers for their own account in the exchange offer may be sold from time to time in one or more transactions in the over-the-counter market, in negotiated transactions, through the writing of options on the new notes or a combination of such methods of resale, at market prices prevailing at the time of resale, at prices related to such prevailing market prices or at negotiated prices. Any such resale may be made directly to purchasers or to or through brokers or dealers who may receive compensation in the form of commissions or concessions from any such broker- dealer or the purchasers of any such new notes. Any broker-dealer that resells new notes that were received by it for its own account in the exchange offer and any broker or dealer that participates in a distribution of such new notes may be deemed to be an "underwriter" within the meaning of the Securities Act, and profit on any such resale of notes issued in the exchange and any commission or concessions received by any such persons may be deemed to be underwriting compensation under the Securities Act. The letter of transmittal states that, by acknowledging that it will deliver and by delivering a prospectus, a broker- dealer will not be deemed to admit that it is an "underwriter" within the meaning of the Securities Act.
For a period of 120 days after the consummation of the exchange offer, we will promptly send additional copies of this prospectus and any amendment or supplement to this prospectus to any broker-dealer that requests such documents in the letter of transmittal. We have agreed to pay all expenses incident to the exchange offer and will indemnify the holders of the new notes, including any broker-dealers, against certain liabilities, including liabilities under the Securities Act. We note, however, that, in the opinion of the SEC, indemnification against liabilities arising under federal securities laws is against public policy and may be unenforceable.
CHANGES IN AND DISAGREEMENTS WITH ACCOUNTANTS ON
ACCOUNTING AND FINANCIAL DISCLOSURE
There have been no changes in our independent registered public accounting firm, Deloitte & Touche LLP, or disagreements with them on matters of accounting or financial disclosure at any time during the two most recent fiscal years or any subsequent interim period.
Certain legal matters as to the enforceability of the obligations of Huntsman International LLC under the notes and the enforceability of the obligations of the guarantors under the related guarantees will be passed upon for these entities and for us by Stoel Rives LLP, Salt Lake City, Utah. Certain legal matters as to the enforceability of the guarantee of the notes by Huntsman Ethyleneamines LLC, Huntsman Fuels LLC, Huntsman International Fuels LLC, and Huntsman Propylene Oxide LLC will be passed upon for these entities by Latham & Watkins LLP, Houston, Texas. Certain legal matters as to the validity of the enforceability of the notes by Tioxide Americas LLC will be passed upon for Tioxide Americas LLC by Walkers, Cayman Islands. Certain legal matters as to the enforceability of the
206
guarantee of the notes by Tioxide Group will be passed upon for Tioxide Group by Dickinson Dees LLP.
The consolidated financial statements and the related financial statement schedule of Huntsman International LLC as of December 31, 2012 and 2011 and for each of the three years in the period ended December 31, 2012, included in this prospectus have been audited by Deloitte & Touche LLP, an independent registered public accounting firm, as stated in their report appearing herein (which report expresses an unqualified opinion and includes an explanatory paragraph regarding the Company's application of new accounting guidance relating to its method of accounting for transfers of accounts receivable under the Company's accounts receivable securitization programs, effective January 1, 2010). Such consolidated financial statements and financial statement schedule have been so included in reliance upon the report of such firm given upon their authority as experts in accounting and auditing.
WHERE YOU CAN FIND MORE INFORMATION
We have filed with the SEC a registration statement on Form S-4 (Reg. No. 333-187504) with respect to the securities being offered hereby. This prospectus does not contain all of the information contained in the registration statement, including the exhibits and schedules. You should refer to the registration statement, including the exhibits and schedules, for further information about us and the securities being offered hereby. Statements we make in this prospectus about certain contracts or other documents are not necessarily complete. When we make such statements, we refer you to the copies of the contracts or documents that are filed as exhibits to the registration statement because those statements are qualified in all respects by reference to those exhibits.
We and our parent file annual, quarterly and current reports and other information with the SEC. You may read and copy reports and other information that we or our parent file with the SEC at the public reference facilities maintained by the SEC at 100 F Street, N.E., Room 1580, Washington, D.C. 20549. Please call the SEC at 1-800-SEC-0330 for more information on the public reference rooms. The SEC also maintains an Internet site at http://www.sec.gov from which you can access our filings and our parent's filings. See "Description of New Notes—Certain Covenants—Reports to Holders" for information about the reports and other information that we are required to furnish to holders of notes and how those obligations may be satisfied.
207
HUNTSMAN INTERNATIONAL LLC AND SUBSIDIARIES
INDEX TO CONSOLIDATED FINANCIAL STATEMENTS
F-1
REPORT OF INDEPENDENT REGISTERED PUBLIC ACCOUNTING FIRM
To
the Board of Managers and Members of
Huntsman International LLC and subsidiaries
We have audited the accompanying consolidated balance sheets of Huntsman International LLC and subsidiaries (the "Company") as of December 31, 2012 and 2011, and the related consolidated statements of operations, comprehensive income (loss), equity, and cash flows for each of the three years in the period ended December 31, 2012. Our audits also included the financial statement schedule listed in the Index on page F-1. These financial statements and financial statement schedule are the responsibility of the Company's management. Our responsibility is to express an opinion on the financial statements and financial statement schedule based on our audits.
We conducted our audits in accordance with the standards of the Public Company Accounting Oversight Board (United States). Those standards require that we plan and perform the audit to obtain reasonable assurance about whether the financial statements are free of material misstatement. An audit includes examining, on a test basis, evidence supporting the amounts and disclosures in the financial statements. An audit also includes assessing the accounting principles used and significant estimates made by management, as well as evaluating the overall financial statement presentation. We believe that our audits provide a reasonable basis for our opinion.
In our opinion, such consolidated financial statements present fairly, in all material respects, the financial position of Huntsman International LLC and subsidiaries as of December 31, 2012 and 2011, and the results of their operations and their cash flows for each of the three years ended December 31, 2012, in conformity with accounting principles generally accepted in the United States of America. Also, in our opinion, such financial statement schedule, when considered in relation to the basic consolidated financial statements taken as a whole, presents fairly, in all material respects, the information set forth therein.
As discussed in Note 2 to the consolidated financial statements, the Company adopted new accounting guidance which changed its method of accounting for transfers of accounts receivable under the Company's accounts receivable securitization programs, effective January 1, 2010.
We have also audited, in accordance with the standards of the Public Company Accounting Oversight Board (United States), the Company's internal control over financial reporting as of December 31, 2012, based on the criteria established in Internal Control—Integrated Framework issued by the Committee of Sponsoring Organizations of the Treadway Commission and our report dated February 12, 2013 (not presented herein) expressed an unqualified opinion on the Company's internal control over financial reporting.
/s/ DELOITTE & TOUCHE LLP
Houston,
Texas
February 12, 2013
F-2
HUNTSMAN INTERNATIONAL LLC AND SUBSIDIARIES
CONSOLIDATED BALANCE SHEETS
(Dollars in Millions)
| |
December 31, 2012 |
December 31, 2011 |
|||||
|---|---|---|---|---|---|---|---|
ASSETS |
|||||||
Current assets: |
|||||||
Cash and cash equivalents(a) |
$ | 210 | $ | 231 | |||
Restricted cash(a) |
9 | 8 | |||||
Accounts and notes receivable (net of allowance for doubtful accounts of $47 and $46, respectively), ($520 and $659 pledged as collateral, respectively)(a) |
1,534 | 1,529 | |||||
Accounts receivable from affiliates |
299 | 148 | |||||
Inventories(a) |
1,819 | 1,539 | |||||
Prepaid expenses |
48 | 46 | |||||
Deferred income taxes |
51 | 40 | |||||
Other current assets(a) |
222 | 220 | |||||
Total current assets |
4,192 | 3,761 | |||||
Property, plant and equipment, net(a) |
3,656 | 3,510 | |||||
Investment in unconsolidated affiliates |
238 | 202 | |||||
Intangible assets, net(a) |
70 | 93 | |||||
Goodwill |
117 | 114 | |||||
Deferred income taxes |
229 | 163 | |||||
Notes receivable from affiliates |
2 | 5 | |||||
Other noncurrent assets(a) |
366 | 482 | |||||
Total assets |
$ | 8,870 | $ | 8,330 | |||
LIABILITIES AND EQUITY |
|||||||
Current liabilities: |
|||||||
Accounts payable(a) |
$ | 1,101 | $ | 862 | |||
Accounts payable to affiliates |
62 | 64 | |||||
Accrued liabilities(a) |
723 | 694 | |||||
Deferred income taxes |
39 | 29 | |||||
Note payable to affiliate |
100 | 100 | |||||
Current portion of debt(a) |
288 | 212 | |||||
Total current liabilities |
2,313 | 1,961 | |||||
Long-term debt(a) |
3,414 | 3,730 | |||||
Notes payable to affiliates |
599 | 439 | |||||
Deferred income taxes |
170 | 106 | |||||
Other noncurrent liabilities(a) |
1,157 | 1,003 | |||||
Total liabilities |
7,653 | 7,239 | |||||
Commitments and contingencies (Notes 19 and 20) |
|||||||
Equity |
|||||||
Huntsman International LLC members' equity: |
|||||||
Members' equity, 2,728 units issued and outstanding |
3,109 | 3,081 | |||||
Accumulated deficit |
(1,224 | ) | (1,493 | ) | |||
Accumulated other comprehensive loss |
(791 | ) | (611 | ) | |||
Total Huntsman International LLC members' equity |
1,094 | 977 | |||||
Noncontrolling interests in subsidiaries |
123 | 114 | |||||
Total equity |
1,217 | 1,091 | |||||
Total liabilities and equity |
$ | 8,870 | $ | 8,330 | |||
See accompanying notes to consolidated financial statements.
F-3
HUNTSMAN INTERNATIONAL LLC AND SUBSIDIARIES
CONSOLIDATED STATEMENTS OF OPERATIONS
(Dollars in Millions)
| |
Year ended December 31, | |||||||||
|---|---|---|---|---|---|---|---|---|---|---|
| |
2012 | 2011 | 2010 | |||||||
Revenues: |
||||||||||
Trade sales, services and fees, net |
$ | 10,964 | $ | 11,041 | $ | 9,049 | ||||
Related party sales |
223 | 180 | 201 | |||||||
Total revenues |
11,187 | 11,221 | 9,250 | |||||||
Cost of goods sold |
9,146 | 9,363 | 7,772 | |||||||
Gross profit |
2,041 | 1,858 | 1,478 | |||||||
Operating expenses: |
||||||||||
Selling, general and administrative |
934 | 916 | 855 | |||||||
Research and development |
152 | 166 | 151 | |||||||
Other operating income |
(6 | ) | (20 | ) | — | |||||
Restructuring, impairment and plant closing costs |
92 | 167 | 29 | |||||||
Total expenses |
1,172 | 1,229 | 1,035 | |||||||
Operating income |
869 | 629 | 443 | |||||||
Interest expense, net |
(238 | ) | (262 | ) | (248 | ) | ||||
Equity in income of investment in unconsolidated affiliates |
7 | 8 | 24 | |||||||
Loss on early extinguishment of debt |
(80 | ) | (7 | ) | (37 | ) | ||||
Other income |
1 | 2 | 2 | |||||||
Income from continuing operations before income taxes |
559 | 370 | 184 | |||||||
Income tax expense |
(179 | ) | (113 | ) | (40 | ) | ||||
Income from continuing operations |
380 | 257 | 144 | |||||||
(Loss) income from discontinued operations, net of tax |
(7 | ) | (1 | ) | 42 | |||||
Income before extraordinary gain (loss) |
373 | 256 | 186 | |||||||
Extraordinary gain (loss) on the acquisition of a business, net of tax of nil |
2 | 4 | (1 | ) | ||||||
Net income |
375 | 260 | 185 | |||||||
Net income attributable to noncontrolling interests |
(10 | ) | (7 | ) | (5 | ) | ||||
Net income attributable to Huntsman International LLC |
$ | 365 | $ | 253 | $ | 180 | ||||
See accompanying notes to consolidated financial statements.
F-4
HUNTSMAN INTERNATIONAL LLC AND SUBSIDIARIES
CONSOLIDATED STATEMENTS OF COMPREHENSIVE INCOME (LOSS)
(Dollars in Millions)
| |
Year ended December 31, | |||||||||
|---|---|---|---|---|---|---|---|---|---|---|
| |
2012 | 2011 | 2010 | |||||||
Net income |
$ | 375 | $ | 260 | $ | 185 | ||||
Other comprehensive loss, net of tax: |
||||||||||
Foreign currency translations adjustments |
51 | (79 | ) | 23 | ||||||
Pension and other postretirement benefits adjustments |
(231 | ) | (182 | ) | (28 | ) | ||||
Other, net |
(1 | ) | (1 | ) | (2 | ) | ||||
Other comprehensive loss |
(181 | ) | (262 | ) | (7 | ) | ||||
Comprehensive income (loss) |
194 | (2 | ) | 178 | ||||||
Comprehensive income attributable to noncontrolling interests |
(9 | ) | (2 | ) | (4 | ) | ||||
Comprehensive income (loss) attributable to Huntsman International LLC |
$ | 185 | $ | (4 | ) | $ | 174 | |||
See accompanying notes to consolidated financial statements.
F-5
HUNTSMAN INTERNATIONAL LLC AND SUBSIDIARIES
CONSOLIDATED STATEMENTS OF EQUITY
(Dollars in Millions)
| |
Huntsman International LLC Members | |
|
||||||||||||||||
|---|---|---|---|---|---|---|---|---|---|---|---|---|---|---|---|---|---|---|---|
| |
Members' equity |
|
|
|
|
||||||||||||||
| |
|
Accumulated other comprehensive loss |
|
|
|||||||||||||||
| |
Accumulated deficit |
Noncontrolling interests in subsidiaries |
Total equity |
||||||||||||||||
| |
Units | Amount | |||||||||||||||||
Balance, January 1, 2010 |
2,728 | $ | 3,021 | $ | (1,847 | ) | $ | (348 | ) | $ | 21 | $ | 847 | ||||||
Net income |
— | — | 180 | — | 5 | 185 | |||||||||||||
Other comprehensive loss |
— | — | — | (6 | ) | (1 | ) | (7 | ) | ||||||||||
Consolidation of a variable interest entity |
— | — | — | — | 35 | 35 | |||||||||||||
Contribution from parent |
— | 24 | — | — | — | 24 | |||||||||||||
Excess tax benefit related to stock-based compensation |
— | 4 | — | — | — | 4 | |||||||||||||
Balance, December 31, 2010 |
2,728 | 3,049 | (1,667 | ) | (354 | ) | 60 | 1,088 | |||||||||||
Net income |
— | — | 253 | — | 7 | 260 | |||||||||||||
Dividend paid to noncontrolling interest |
— | — | — | — | (9 | ) | (9 | ) | |||||||||||
Dividends paid to parent |
— | — | (79 | ) | — | — | (79 | ) | |||||||||||
Other comprehensive loss |
— | — | — | (257 | ) | (5 | ) | (262 | ) | ||||||||||
Consolidation of a variable interest entity |
— | — | — | — | 61 | 61 | |||||||||||||
Contribution from parent |
— | 22 | — | — | — | 22 | |||||||||||||
Excess tax benefit related to stock-based compensation |
— | 10 | — | — | — | 10 | |||||||||||||
Balance, December 31, 2011 |
2,728 | 3,081 | (1,493 | ) | (611 | ) | 114 | 1,091 | |||||||||||
Net income |
— | — | 365 | — | 10 | 375 | |||||||||||||
Dividends paid to parent |
— | — | (96 | ) | — | — | (96 | ) | |||||||||||
Other comprehensive loss |
— | — | — | (180 | ) | (1 | ) | (181 | ) | ||||||||||
Contribution from parent |
— | 26 | — | — | — | 26 | |||||||||||||
Acquisition of a business |
— | (2 | ) | — | — | — | (2 | ) | |||||||||||
Excess tax benefit related to stock-based compensation |
— | 4 | — | — | — | 4 | |||||||||||||
Balance, December 31, 2012 |
2,728 | $ | 3,109 | $ | (1,224 | ) | $ | (791 | ) | $ | 123 | $ | 1,217 | ||||||
See accompanying notes to consolidated financial statements.
F-6
HUNTSMAN INTERNATIONAL LLC AND SUBSIDIARIES
CONSOLIDATED STATEMENTS OF CASH FLOWS
(Dollars in Millions)
| |
Year ended December 31, | |||||||||
|---|---|---|---|---|---|---|---|---|---|---|
| |
2012 | 2011 | 2010 | |||||||
Operating Activities: |
||||||||||
Net income |
$ | 375 | $ | 260 | $ | 185 | ||||
Adjustments to reconcile net income to net cash provided by (used in) operating activities: |
||||||||||
Extraordinary (gain) loss on the acquisition of a business, net of tax |
(2 | ) | (4 | ) | 1 | |||||
Loss (gain) on initial consolidation of subsidiaries |
4 | (12 | ) | — | ||||||
Equity in income of investment in unconsolidated affiliates |
(7 | ) | (8 | ) | (24 | ) | ||||
Depreciation and amortization |
408 | 416 | 382 | |||||||
Provision for losses (gains) on accounts receivable |
4 | (4 | ) | 6 | ||||||
(Gain) loss on disposal of businesses/assets, net |
— | (38 | ) | 8 | ||||||
Loss on early extinguishment of debt |
80 | 7 | 37 | |||||||
Noncash interest expense |
45 | 51 | 40 | |||||||
Deferred income taxes |
76 | 40 | 45 | |||||||
Noncash impairment charge |
15 | 60 | 2 | |||||||
Noncash loss (gain) on foreign currency transactions |
11 | (32 | ) | 22 | ||||||
Noncash compensation |
26 | 22 | 24 | |||||||
Portion of insurance settlement representing cash provided by investing activities |
— | — | (34 | ) | ||||||
Other, net |
(4 | ) | (1 | ) | 1 | |||||
Changes in operating assets and liabilities: |
||||||||||
Accounts and notes receivable |
— | (121 | ) | (183 | ) | |||||
Accounts receivable from A/R Programs |
— | — | (254 | ) | ||||||
Inventories |
(248 | ) | (161 | ) | (207 | ) | ||||
Prepaid expenses |
(3 | ) | (4 | ) | (2 | ) | ||||
Other current assets |
(1 | ) | (87 | ) | (1 | ) | ||||
Other noncurrent assets |
103 | 2 | (102 | ) | ||||||
Accounts payable |
134 | 13 | 97 | |||||||
Accrued liabilities |
41 | 108 | (32 | ) | ||||||
Other noncurrent liabilities |
(197 | ) | (75 | ) | (57 | ) | ||||
Net cash provided by (used in) operating activities |
860 | 432 | (46 | ) | ||||||
Investing Activities: |
||||||||||
Capital expenditures |
(412 | ) | (330 | ) | (236 | ) | ||||
Proceeds from settlements treated as reimbursement of capital expenditures |
— | 3 | 34 | |||||||
Acquisition of businesses, net of cash acquired and post-closing adjustments |
(18 | ) | (34 | ) | — | |||||
Cash assumed in connection with the initial consolidation of a variable interest entity |
— | 28 | 14 | |||||||
Proceeds from sale of businesses/assets |
6 | 48 | 2 | |||||||
Increase in receivable from affiliate |
(108 | ) | (57 | ) | (57 | ) | ||||
Investment in unconsolidated affiliates |
(127 | ) | (26 | ) | (27 | ) | ||||
Cash received from unconsolidated affiliates |
82 | 32 | 31 | |||||||
Other, net |
(1 | ) | (1 | ) | 1 | |||||
Net cash used in investing activities |
(578 | ) | (337 | ) | (238 | ) | ||||
(continued)
F-7
HUNTSMAN INTERNATIONAL LLC AND SUBSIDIARIES
CONSOLIDATED STATEMENTS OF CASH FLOWS (Continued)
(Dollars in Millions)
| |
Year ended December 31, | |||||||||
|---|---|---|---|---|---|---|---|---|---|---|
| |
2012 | 2011 | 2010 | |||||||
Financing Activities: |
||||||||||
Net repayments under revolving loan facilities |
$ | (15 | ) | $ | (2 | ) | $ | (6 | ) | |
Revolving loan facility from A/R Programs |
— | — | 254 | |||||||
Net borrowings (repayments) on overdraft facilities |
2 | 9 | (2 | ) | ||||||
Repayments of short-term debt |
(53 | ) | (187 | ) | (175 | ) | ||||
Borrowings on short-term debt |
— | 162 | 212 | |||||||
Repayments of long-term debt |
(694 | ) | (408 | ) | (1,207 | ) | ||||
Proceeds from issuance of long-term debt |
405 | 98 | 923 | |||||||
Repayments of notes payable to affiliate |
(139 | ) | (105 | ) | (125 | ) | ||||
Proceeds from notes payable to affiliate |
299 | 105 | 110 | |||||||
Repayments of notes payable |
(37 | ) | (34 | ) | (53 | ) | ||||
Borrowings on notes payable |
34 | 35 | 46 | |||||||
Debt issuance costs paid |
(11 | ) | (7 | ) | (29 | ) | ||||
Call premiums related to early extinguishment of debt |
(2 | ) | (6 | ) | (28 | ) | ||||
Dividends paid to parent |
(96 | ) | (79 | ) | — | |||||
Dividends paid to noncontrolling interest |
— | (9 | ) | — | ||||||
Excess tax benefit related to stock-based compensation |
4 | 10 | 4 | |||||||
Other, net |
(3 | ) | — | (2 | ) | |||||
Net cash used in financing activities |
(306 | ) | (418 | ) | (78 | ) | ||||
Effect of exchange rate changes on cash |
3 | (7 | ) | 4 | ||||||
Decrease in cash and cash equivalents |
(21 | ) | (330 | ) | (358 | ) | ||||
Cash and cash equivalents at beginning of period |
231 | 561 | 919 | |||||||
Cash and cash equivalents at end of period |
$ | 210 | $ | 231 | $ | 561 | ||||
Supplemental cash flow information: |
||||||||||
Cash paid for interest |
$ | 209 | $ | 205 | $ | 194 | ||||
Cash paid for income taxes |
129 | 44 | 32 | |||||||
During 2012, 2011 and 2010, the amount of capital expenditures in accounts payable increased by $31, $16 and $14, respectively. During the years ended 2012, 2011 and 2010, Huntsman Corporation contributed $26, $22 and $24, respectively to stock based compensation.
See accompanying notes to consolidated financial statements.
F-8
HUNTSMAN INTERNATIONAL LLC AND SUBSIDIARIES
NOTES TO CONSOLIDATED FINANCIAL STATEMENTS
1. GENERAL
DEFINITIONS
We are a wholly-owned subsidiary of Huntsman Corporation, which we refer to in these notes as our "parent." Unless the context otherwise requires, references in these financial statements to "we," "us," "our" or "our Company" refer to Huntsman International LLC, together with its subsidiaries, and not to Huntsman Corporation and its other subsidiaries; references to "guarantors" or "guarantor subsidiaries" refer to our subsidiaries that have guaranteed our debt obligations, including the notes, consisting of substantially all of our domestic subsidiaries and certain of our foreign subsidiaries; "HPS" refers to Huntsman Polyurethanes Shanghai Ltd. (our consolidated splitting joint venture with Shanghai Chlor-Alkali Chemical Company, Ltd); and "SLIC" refers to Shanghai Liengheng Isocyanate Investment BV (our unconsolidated manufacturing joint venture with BASF AG and three Chinese chemical companies).
Each capitalized term used without definition in these notes to consolidated financial statements has the meaning specified in the prospectus with which these notes to consolidated financial statements are included. In these financial statements, we may use, without definition, the common names of competitors or other industry participants. We may also use the common names or abbreviations for certain chemicals or products.
DESCRIPTION OF BUSINESS
We are a global manufacturer of differentiated organic chemical products and of inorganic chemical products. Our products comprise a broad range of chemicals and formulations, which we market globally to a diversified group of consumer and industrial customers. Our products are used in a wide range of applications, including those in the adhesives, aerospace, automotive, construction products, personal care and hygiene, durable and non-durable consumer products, electronics, medical, packaging, paints and coatings, power generation, refining, synthetic fiber, textile chemicals and dye industries. We are a leading global producer in many of our key product lines, including MDI, amines, surfactants, maleic anhydride, epoxy-based polymer formulations, textile chemicals, dyes and titanium dioxide.
We operate in five segments: Polyurethanes, Performance Products, Advanced Materials, Textile Effects and Pigments. Our Polyurethanes, Performance Products, Advanced Materials and Textile Effects segments produce differentiated organic chemical products and our Pigments segment produces inorganic chemical products. In a series of transactions beginning in 2006, we sold or shutdown substantially all of our Australian styrenics operations and our North American polymers and base chemicals operations. We report the results of these businesses as discontinued operations. See "Note 25. Discontinued Operations."
COMPANY
Our Company, a Delaware limited liability company, was formed in 1999. We are a wholly-owned subsidiary of Huntsman Corporation.
F-9
HUNTSMAN INTERNATIONAL LLC AND SUBSIDIARIES
NOTES TO CONSOLIDATED FINANCIAL STATEMENTS (Continued)
2. SUMMARY OF SIGNIFICANT ACCOUNTING POLICIES
ALLOWANCE FOR DOUBTFUL TRADE RECEIVABLES
An allowance for doubtful trade receivables is estimated based on a combination of write-off history, aging analysis and any specific, known troubled accounts.
ASSET RETIREMENT OBLIGATIONS
We accrue for asset retirement obligations, which consist primarily of landfill closure costs and asbestos abatement costs, in the period in which the obligations are incurred. Asset retirement obligations are accrued at estimated fair value. When the liability is initially recorded, we capitalize the cost by increasing the carrying amount of the related long-lived asset. Over time, the liability is accreted to its settlement value and the capitalized cost is depreciated over the useful life of the related asset. Upon settlement of the liability, we will recognize a gain or loss for any difference between the settlement amount and the liability recorded. See "Note 12. Asset Retirement Obligations."
CARRYING VALUE OF LONG-LIVED ASSETS
We review long-lived assets and all amortizable intangible assets for impairment whenever events or changes in circumstances indicate that the carrying amount of these assets may not be recoverable. Recoverability is based upon current and anticipated undiscounted cash flows, and we recognize an impairment when such estimated cash flows are less than the carrying value of the asset. Measurement of the amount of impairment, if any, is based upon the difference between carrying value and fair value. Fair value is generally estimated by discounting estimated future cash flows using a discount rate commensurate with the risks involved. See "Note 11. Restructuring, Impairment and Plant Closing Costs."
CASH AND CASH EQUIVALENTS
We consider cash in checking accounts and cash in short-term highly liquid investments with remaining maturities of three months or less at the date of purchase, to be cash and cash equivalents. Cash flows from discontinued operations are not presented separately in the accompanying consolidated statements of cash flows.
COST OF GOODS SOLD
We classify the costs of manufacturing and distributing our products as cost of goods sold. Manufacturing costs include variable costs, primarily raw materials and energy, and fixed expenses directly associated with production. Manufacturing costs also include, among other things, plant site operating costs and overhead (including depreciation), production planning and logistics costs, repair and maintenance costs, plant site purchasing costs, and engineering and technical support costs. Distribution, freight and warehousing costs are also included in cost of goods sold.
DERIVATIVES AND HEDGING ACTIVITIES
All derivatives, whether designated in hedging relationships or not, are recorded on our balance sheet at fair value. If the derivative is designated as a fair value hedge, the changes in the fair value of the derivative and the hedged items are recognized in earnings. If the derivative is designated as a cash flow hedge, changes in the fair value of the derivative are recorded in accumulated other
F-10
HUNTSMAN INTERNATIONAL LLC AND SUBSIDIARIES
NOTES TO CONSOLIDATED FINANCIAL STATEMENTS (Continued)
2. SUMMARY OF SIGNIFICANT ACCOUNTING POLICIES (Continued)
comprehensive loss, to the extent effective, and will be recognized in the income statement when the hedged item affects earnings. Changes in the fair value of the hedge in the net investment of certain international operations are recorded in other comprehensive income, to the extent effective. The effectiveness of a cash flow hedging relationship is established at the inception of the hedge, and after inception we perform effectiveness assessments at least every three months. A derivative designated as a cash flow hedge is determined to be effective if the change in value of the hedge divided by the change in value of the hedged item is within a range of 80% to 125%. Hedge ineffectiveness in a cash flow hedge occurs only if the cumulative gain or loss on the derivative hedging instrument exceeds the cumulative change in the expected future cash flows on the hedged transaction. For a derivative that does not qualify or has not been designated as a hedge, changes in fair value are recognized in earnings.
ENVIRONMENTAL EXPENDITURES
Environmental related restoration and remediation costs are recorded as liabilities when site restoration and environmental remediation and clean-up obligations are either known or considered probable and the related costs can be reasonably estimated. Other environmental expenditures that are principally maintenance or preventative in nature are recorded when expended and incurred and are expensed or capitalized as appropriate. See "Note 20. Environmental, Health and Safety Matters."
FINANCIAL INSTRUMENTS
The carrying amounts reported in the balance sheet for cash and cash equivalents, accounts receivable and accounts payable approximate fair value because of the immediate or short-term maturity of these financial instruments. The fair value of non-qualified employee benefit plan investments is estimated using prevailing market prices. The estimated fair values of our long-term debt are based on quoted market prices for the identical liability when traded as an asset in an active market.
FOREIGN CURRENCY TRANSLATION
The accounts of our operating subsidiaries outside of the U.S., unless they are operating in highly inflationary economic environments, consider the functional currency to be the currency of the economic environment in which they operate. Accordingly, assets and liabilities are translated at rates prevailing at the balance sheet date. Revenues, expenses, gains and losses are translated at a weighted average rate for the period. Cumulative translation adjustments are recorded to equity as a component of accumulated other comprehensive loss.
If a subsidiary operates in an economic environment that is considered to be highly inflationary (100% cumulative inflation over a three-year period), the U.S. dollar is considered to be the functional currency and gains and losses from remeasurement to the U.S. dollar from the local currency are included in the statement of operations. Where a subsidiary's operations are effectively run, managed, financed and contracted in U.S. dollars, such as certain finance subsidiaries outside of the U.S., the U.S. dollar is considered to be the functional currency.
Foreign currency transaction gains and losses are recorded in other operating (income) expense in the consolidated statements of operations and were net losses of $4 million, $3 million and $2 million for the years ended December 31, 2012, 2011 and 2010, respectively.
F-11
HUNTSMAN INTERNATIONAL LLC AND SUBSIDIARIES
NOTES TO CONSOLIDATED FINANCIAL STATEMENTS (Continued)
2. SUMMARY OF SIGNIFICANT ACCOUNTING POLICIES (Continued)
INCOME TAXES
We use the asset and liability method of accounting for income taxes. Deferred income taxes reflect the net tax effects of temporary differences between the carrying amounts of assets and liabilities for financial and tax reporting purposes. We evaluate deferred tax assets to determine whether it is more likely than not that they will be realized. Valuation allowances are reviewed on a tax jurisdiction basis to analyze whether there is sufficient positive or negative evidence to support a change in judgment about the realizability of the related deferred tax assets for each jurisdiction. These conclusions require significant judgment. In evaluating the objective evidence that historical results provide, we consider the cyclicality of businesses and cumulative income or losses during the applicable period. Cumulative losses incurred over the period limits our ability to consider other subjective evidence such as our projections for the future. Changes in expected future income in applicable jurisdictions could affect the realization of deferred tax assets in those jurisdictions.
We do not provide for income taxes or benefits on the undistributed earnings of our non-U.S. subsidiaries as earnings are reinvested and, in the opinion of management, will continue to be reinvested indefinitely.
Accounting for uncertainty in income taxes prescribes a recognition threshold and measurement attribute for the financial statement recognition and measurement of a tax position taken or expected to be taken in a tax return. The application of income tax law is inherently complex. We are required to determine if an income tax position meets the criteria of more-likely-than-not to be realized based on the merits of the position under tax law, in order to recognize an income tax benefit. This requires us to make significant judgments regarding the merits of income tax positions and the application of income tax law. Additionally, if a tax position meets the recognition criteria of more-likely-than-not we are required to make judgments and apply assumptions in order to measure the amount of the tax benefits to recognize. These judgments are based on the probability of the amount of tax benefits that would be realized if the tax position was challenged by the taxing authorities. Interpretations and guidance surrounding income tax laws and regulations change over time. As a consequence, changes in assumptions and judgments can materially affect amounts recognized in the consolidated financial statements.
INTANGIBLE ASSETS AND GOODWILL
Intangible assets are stated at cost (fair value at the time of acquisition) and are amortized using the straight-line method over the estimated useful lives or the life of the related agreement as follows:
Patents and technology |
5 - 30 years | |
Trademarks |
15 - 30 years | |
Licenses and other agreements |
5 - 15 years | |
Other intangibles |
5 - 15 years |
Goodwill represents costs in excess of fair values assigned to the underlying net assets of acquired businesses. Goodwill is not subject to any method of amortization, but is tested for impairment annually (at the beginning of the third quarter) and when events and circumstances change that would more likely than not reduce the fair value of a reporting unit below its carrying amount. When the fair value is less than the carrying value of the related reporting unit, we are required to reduce the amount of goodwill through a charge to earnings. Fair value is estimated using the market approach, as well as
F-12
HUNTSMAN INTERNATIONAL LLC AND SUBSIDIARIES
NOTES TO CONSOLIDATED FINANCIAL STATEMENTS (Continued)
2. SUMMARY OF SIGNIFICANT ACCOUNTING POLICIES (Continued)
the income approach based on discounted cash flow projections. Goodwill has been assigned to reporting units for purposes of impairment testing.
INVENTORIES
Inventories are stated at the lower of cost or market, with cost determined using LIFO, first-in first-out, and average costs methods for different components of inventory.
INVESTMENT IN UNCONSOLIDATED AFFILIATES
Investments in companies in which we exercise significant influence, but do not control, are accounted for using the equity method. Investments in companies in which we do not exercise significant influence are accounted for using the cost method.
LEGAL COSTS
We expense legal costs, including those legal costs incurred in connection with a loss contingency, as incurred.
OTHER NONCURRENT ASSETS
Other noncurrent assets consist primarily of spare parts, deferred debt issuance costs, the overfunded portion related to defined benefit plans for employees and capitalized turnaround costs. Debt issuance costs are amortized using the interest method over the term of the related debt.
PRINCIPLES OF CONSOLIDATION
Our consolidated financial statements include the accounts of our wholly-owned and majority-owned subsidiaries and any variable interest entities for which we are the primary beneficiary. All intercompany accounts and transactions have been eliminated, except for intercompany sales between continuing and discontinued operations.
PROPERTY, PLANT AND EQUIPMENT
Property, plant and equipment is stated at cost less accumulated depreciation. Depreciation is computed using the straight-line method over the estimated useful lives or lease term as follows:
Buildings and equipment |
10 - 33 years | |
Plant and equipment |
3 - 25 years | |
Furniture, fixtures and leasehold improvements |
5 - 20 years |
Interest expense capitalized as part of plant and equipment was $4 million, $2 million and $1 million for the years ended December 31, 2012, 2011 and 2010, respectively.
Periodic maintenance and repairs applicable to major units of manufacturing facilities (a "turnaround") are accounted for on the deferral basis by capitalizing the costs of the turnaround and amortizing the costs over the estimated period until the next turnaround. Normal maintenance and repairs of plant and equipment are charged to expense as incurred. Renewals, betterments and major
F-13
HUNTSMAN INTERNATIONAL LLC AND SUBSIDIARIES
NOTES TO CONSOLIDATED FINANCIAL STATEMENTS (Continued)
2. SUMMARY OF SIGNIFICANT ACCOUNTING POLICIES (Continued)
repairs that materially extend the useful life of the assets are capitalized, and the assets replaced, if any, are retired.
RESEARCH AND DEVELOPMENT
Research and development costs are expensed as incurred.
REVENUE RECOGNITION
We generate substantially all of our revenues through sales in the open market and long-term supply agreements. We recognize revenue when it is realized or realizable and earned. Revenue for product sales is recognized when a sales arrangement exists, risk and title to the product transfer to the customer, collectability is reasonably assured and pricing is fixed or determinable. The transfer of risk and title to the product to the customer usually occurs at the time shipment is made.
Revenue arrangements that contain multiple deliverables, which relate primarily to licensing of technology, are evaluated to determine whether the arrangements should be divided into separate units of accounting and how the arrangement consideration should be measured and allocated among the separate units of accounting.
SECURITIZATION OF ACCOUNTS RECEIVABLE
Under our A/R Programs, we grant an undivided interest in certain of our trade receivables to the U.S. SPE and the EU SPE. This undivided interest serves as security for the issuance of debt. The A/R Programs provide for financing through a conduit program (in both U.S. dollars and euros). Receivables transferred under the A/R Programs qualified as sales through December 31, 2009. Upon adoption of new accounting guidance on January 1, 2010, transfers of accounts receivable under our A/R Programs no longer met the criteria for derecognition. Accordingly, the amounts outstanding under our A/R Programs are accounted for as secured borrowings beginning in 2010. See "Note 14. Debt—A/R Programs."
STOCK-BASED COMPENSATION
We measure the cost of employee services received in exchange for an award of equity instruments based on the grant-date fair value of the award. That cost will be recognized over the period during which the employee is required to provide services in exchange for the award. See "Note 22. Stock-Based Compensation Plan."
SUBSEQUENT EVENTS
We have evaluated material subsequent events through the date these consolidated financial statements were issued.
USE OF ESTIMATES
The preparation of financial statements in conformity with GAAP requires management to make estimates and assumptions that affect the reported amounts of assets and liabilities and disclosure of contingent assets and liabilities at the date of the financial statements and the reported amounts of revenues and expenses during the reporting period. Actual results could differ from those estimates.
F-14
HUNTSMAN INTERNATIONAL LLC AND SUBSIDIARIES
NOTES TO CONSOLIDATED FINANCIAL STATEMENTS (Continued)
2. SUMMARY OF SIGNIFICANT ACCOUNTING POLICIES (Continued)
RECENTLY ISSUED ACCOUNTING PRONOUNCEMENTS
ACCOUNTING PRONOUNCEMENTS ADOPTED DURING 2012
In May 2011, the Financial Accounting Standards Board ("FASB") issued Accounting Standards Update ("ASU") No. 2011-04, Fair Value Measurement (Topic 820): Amendments to Achieve Common Fair Value Measurement and Disclosure Requirements in U.S. GAAP and IFRSs, providing a consistent definition of fair value between U.S. GAAP and International Financial Reporting Standards ("IFRSs") as well as developing common requirements for measuring fair value and for disclosing information about fair value measurements in accordance with U.S. GAAP and IFRSs. The amendments in this ASU were effective prospectively for interim and annual periods beginning after December 15, 2011. We adopted the amendments of this ASU effective January 1, 2012, and the initial adoption of the amendments in this ASU did not have a significant impact on our consolidated financial statements.
In June 2011, the FASB issued ASU No. 2011-05, Comprehensive Income (Topic 220): Presentation of Comprehensive Income, requiring entities to present net income and other comprehensive income in either a single continuous statement of comprehensive income or in two separate, but consecutive, statements of net income and other comprehensive income. The option to present components of other comprehensive income as part of the statement of equity is eliminated. The amendments do not change the option to present components of other comprehensive income either net of related tax effects or before related tax effects, with one amount shown for the aggregate income tax expense or benefit related to the total of other comprehensive income components. The amendments in this ASU were effective retrospectively for fiscal years, and interim periods within those years, beginning after December 15, 2011. We adopted this ASU effective January 1, 2012 and have presented our consolidated net income and consolidated comprehensive income in two separate, but consecutive, statements.
In September 2011, the FASB issued ASU No. 2011-08, Intangibles—Goodwill and Other (Topic 350): Testing Goodwill for Impairment. The guidance in this ASU is intended to reduce complexity and costs of the annual goodwill impairment test by providing entities with the option of performing a qualitative assessment to determine whether further impairment testing is necessary. The amendments in this ASU include examples of events and circumstances that might indicate that a reporting unit's fair value is less than its carrying value. The amendments in this ASU were effective prospectively for annual and interim goodwill impairment tests performed for fiscal years beginning after December 15, 2011. We adopted the amendments in this ASU effective January 1, 2012, and the initial adoption of the amendments in this ASU did not have a significant impact on our consolidated financial statements.
ACCOUNTING PRONOUNCEMENTS PENDING ADOPTION IN FUTURE PERIODS
In July 2012, the FASB issued ASU No. 2012-02, Intangibles—Goodwill and Other (Topic 350): Testing Indefinite-Lived Intangible Assets for Impairment. The guidance in this ASU is intended to reduce complexity and costs of the annual impairment tests for indefinite-lived intangible assets by providing entities with the option of performing a qualitative assessment to determine whether further impairment testing is necessary. The amendments in this ASU include examples of events and circumstances that might indicate that an asset's fair value is less than its carrying value. The amendments in this ASU are effective for annual and interim indefinite-lived intangible assets impairment tests performed for fiscal years beginning after September 15, 2012 with early adoption
F-15
HUNTSMAN INTERNATIONAL LLC AND SUBSIDIARIES
NOTES TO CONSOLIDATED FINANCIAL STATEMENTS (Continued)
2. SUMMARY OF SIGNIFICANT ACCOUNTING POLICIES (Continued)
permitted. We do not expect the adoption of the amendments in this ASU to have a significant impact on our consolidated financial statements.
3. BUSINESS COMBINATIONS AND DISPOSITIONS
RUSSIAN MDI, COATINGS AND SYSTEMS ACQUISITION
On July 3, 2012, we completed our acquisition of the remaining 55% ownership interest in International Polyurethane Investments B.V. This company's wholly owned subsidiary, Huntsman NMG ZAO, is a leading supplier of polyurethane systems to the adhesives, coatings and footwear markets in Russia, Ukraine and Belarus and is headquartered in Obninsk, Russia. The acquisition cost was approximately €13 million (approximately $16 million). The acquired business was integrated into our Polyurethanes segment. Transaction costs charged to expense related to this acquisition were not significant. The fair value of our existing 45% ownership interest immediately prior to the acquisition was $13 million, valued by applying the income approach. Key assumptions include a discount rate of 17% and a terminal growth rate of 4%. In connection with this transaction, we recorded a noncash pretax loss of approximately $4 million in other operating (income) expense on the consolidation of this investment. The long-term debt of approximately $7 million that was assumed as part of this transaction was repaid shortly after the acquisition date.
We have accounted for the Russian Systems House Acquisition using the acquisition method. As such, we analyzed the fair value of tangible and intangible assets acquired and liabilities assumed. The preliminary allocation of acquisition cost to the assets acquired and liabilities assumed is summarized as follows (dollars in millions):
Fair value of original 45% ownership interest acquired in 2007 |
$ | 13 | ||
Acquisition cost of 55% ownership interest acquired in 2012 |
16 | |||
Total fair value of net assets acquired |
$ | 29 | ||
Fair value of assets acquired and liabilities assumed: |
||||
Accounts receivable |
$ | 2 | ||
Inventories |
9 | |||
Other current assets |
1 | |||
Property, plant and equipment |
31 | |||
Accounts payable |
(4 | ) | ||
Accrued liabilities |
(1 | ) | ||
Deferred income taxes |
(2 | ) | ||
Long-term debt |
(7 | ) | ||
Total fair value of net assets acquired |
$ | 29 | ||
The acquisition cost allocation is preliminary pending final determination of the fair value of assets acquired and liabilities assumed, including final valuation of working capital, property, plant and equipment, intangible assets and the determination of related deferred taxes. For purposes of this preliminary allocation of fair value, we have assigned any excess of the acquisition cost over historical carrying values to property, plant and equipment and no amounts have been allocated to goodwill. It is possible that changes to this preliminary allocation could occur.
F-16
HUNTSMAN INTERNATIONAL LLC AND SUBSIDIARIES
NOTES TO CONSOLIDATED FINANCIAL STATEMENTS (Continued)
3. BUSINESS COMBINATIONS AND DISPOSITIONS (Continued)
International Polyurethane Investments B.V. had revenues and earnings of $28 million and $1 million, respectively, for the period from the date of acquisition to December 31, 2012. If this acquisition were to have occurred on January 1, 2010, there would have been no significant impact from the approximate pro forma combined earnings attributable to our Company for 2010, 2011 and 2012. The following estimated pro forma revenues attributable to our Company would have been reported (dollars in millions):
| |
Pro Forma | |||||||||
|---|---|---|---|---|---|---|---|---|---|---|
| |
Year ended December 31, (unaudited) |
|||||||||
| |
2012 | 2011 | 2010 | |||||||
Revenues |
$ | 11,231 | $ | 11,257 | $ | 9,277 | ||||
EMA ACQUISITION
On December 30, 2011, we completed the acquisition of EMA Kimya Sistemleri Sanayive Ticaret A.S. (the "EMA Acquisition"), an MDI-based polyurethanes systems house in Istanbul, Turkey for approximately $11 million, net of cash acquired and including the repayment of assumed debt. The acquired business was integrated into our Polyurethanes segment. We have accounted for the EMA Acquisition using the acquisition method, and transaction costs charged to expense associated with this acquisition were not significant. We recorded goodwill of approximately $9 million in conjunction with this acquisition. Net sales for the years ended December 31, 2011 and 2010 related to the business acquired were approximately $23 million and $17 million, respectively, and net loss associated with this business was $3 million and nil, respectively, for the same periods.
SALE OF STEREOLITHOGRAPHY RESIN AND DIGITALIS® MACHINE MANUFACTURING BUSINESSES
On November 1, 2011, our Advanced Materials division completed the sale of its stereolithography resin and Digitalis® machine manufacturing businesses to 3D Systems Corporation for $41 million in cash. The stereolithography business had revenues of approximately $7 million in 2010 and its products are used primarily in three-dimensional part building systems. The Digitalis® business is a stereolithography rapid manufacturing system that we were developing. In connection with this sale, we recognized a pre-tax gain in the fourth quarter of 2011 of $34 million which was reflected in other operating income on the accompanying consolidated statements of operations and comprehensive income (loss). We also derecognized $2 million of goodwill that was allocated to these businesses.
LAFFANS ACQUISITION
On April 2, 2011, we completed the acquisition of the chemical business of Laffans Petrochemicals Limited, an amines and surfactants manufacturer located in Ankleshwar, India at an acquisition cost of approximately $23 million. The acquired business was integrated into our Performance Products segment. Transaction costs charged to expense related to this acquisition were not significant.
We have accounted for the Laffans Acquisition using the acquisition method. As such, we analyzed the fair value of tangible and intangible assets acquired and liabilities assumed. The allocation of
F-17
HUNTSMAN INTERNATIONAL LLC AND SUBSIDIARIES
NOTES TO CONSOLIDATED FINANCIAL STATEMENTS (Continued)
3. BUSINESS COMBINATIONS AND DISPOSITIONS (Continued)
acquisition cost to the assets acquired and liabilities assumed is summarized as follows (dollars in millions):
Acquisition cost |
$ | 23 | ||
Fair value of assets acquired and liabilities assumed: |
||||
Accounts receivable |
$ | 9 | ||
Inventories |
2 | |||
Other current assets |
2 | |||
Property, plant and equipment |
12 | |||
Intangibles |
3 | |||
Accounts payable |
(3 | ) | ||
Accrued liabilities |
(1 | ) | ||
Other noncurrent liabilities |
(1 | ) | ||
Total fair value of net assets acquired |
$ | 23 | ||
If this acquisition were to have occurred on January 1, 2010 the following estimated pro forma revenues and net income attributable to Huntsman International would have been reported (dollars in millions):
| |
Pro Forma | ||||||
|---|---|---|---|---|---|---|---|
| |
Year ended December 31, (unaudited) |
||||||
| |
2011 | 2010 | |||||
Revenues |
$ | 11,235 | $ | 9,301 | |||
Net income attributable to Huntsman International |
254 | 181 | |||||
TEXTILE EFFECTS ACQUISITION
On June 30, 2006, we acquired Ciba's textile effects business and accounted for the Textile Effects Acquisition using the purchase method. As such, we analyzed the fair value of tangible and intangible assets acquired and liabilities assumed and determined the excess of fair value of net assets over cost. Because the fair value of the acquired assets and liabilities assumed exceeded the purchase price, the value of the long-lived assets acquired was reduced to zero. Accordingly, no basis was assigned to property, plant and equipment or any other non-current nonfinancial assets and the remaining excess was recorded as an extraordinary gain. During 2012, 2011 and 2010, we recorded an additional extraordinary gain (loss) on the acquisition of $2 million, $4 million and $(1) million, respectively, related to settlement of contingent purchase price consideration, the reversal of accruals for certain restructuring and employee termination costs recorded in connection with the Textile Effects Acquisition and a reimbursement by Ciba of certain costs pursuant to the acquisition agreements.
F-18
HUNTSMAN INTERNATIONAL LLC AND SUBSIDIARIES
NOTES TO CONSOLIDATED FINANCIAL STATEMENTS (Continued)
4. INVENTORIES
Inventories consisted of the following (dollars in millions):
| |
December 31, | ||||||
|---|---|---|---|---|---|---|---|
| |
2012 | 2011 | |||||
Raw materials and supplies |
$ | 484 | $ | 374 | |||
Work in progress |
98 | 92 | |||||
Finished goods |
1,311 | 1,162 | |||||
Total |
1,893 | 1,628 | |||||
LIFO reserves |
(74 | ) | (89 | ) | |||
Net |
$ | 1,819 | $ | 1,539 | |||
As of December 31, 2012 and 2011, approximately 11% and 12%, respectively, of inventories were recorded using the LIFO cost method.
In the normal course of operations we, at times, exchange raw materials and finished goods with other companies for the purpose of reducing transportation costs. The net non-monetary open exchange positions are valued at cost. The amounts included in inventory under non-monetary open exchange agreements receivable by us for December 31, 2012 and 2011 were $6 million and $3 million, respectively. Other open exchanges are settled in cash and result in a net deferred profit margin. The amounts under these open exchange agreements for both December 31, 2012 and 2011 were nil.
5. PROPERTY, PLANT AND EQUIPMENT
The cost and accumulated depreciation of property, plant and equipment were as follows (dollars in millions):
| |
December 31, | ||||||
|---|---|---|---|---|---|---|---|
| |
2012 | 2011 | |||||
Land |
$ | 151 | $ | 148 | |||
Buildings |
666 | 629 | |||||
Plant and equipment |
6,270 | 6,058 | |||||
Construction in progress |
549 | 330 | |||||
Total |
7,636 | 7,165 | |||||
Less accumulated depreciation |
(3,980 | ) | (3,655 | ) | |||
Net |
$ | 3,656 | $ | 3,510 | |||
Depreciation expense for 2012, 2011 and 2010 was $375 million, $374 million and $340 million, respectively, of which $5 million, nil and $1 million was related to discontinued operations in 2012, 2011 and 2010, respectively.
Property, plant and equipment includes gross assets acquired under capital leases of $1 million and $2 million, respectively, at December 31, 2012 and 2011 and related amounts included in accumulated depreciation were nil and $1 million at December 31, 2012 and 2011, respectively.
F-19
HUNTSMAN INTERNATIONAL LLC AND SUBSIDIARIES
NOTES TO CONSOLIDATED FINANCIAL STATEMENTS (Continued)
6. INVESTMENT IN UNCONSOLIDATED AFFILIATES
Our ownership percentage and investment in unconsolidated affiliates were as follows (dollars in millions):
| |
December 31, | ||||||
|---|---|---|---|---|---|---|---|
| |
2012 | 2011 | |||||
Equity Method: |
|||||||
Louisiana Pigment Company, L.P. (50%) |
$ | 111 | $ | 90 | |||
BASF Huntsman Shanghai Isocyanate Investment BV (50%)(1) |
81 | 79 | |||||
Nanjing Jinling Huntsman New Material Co., Ltd. (49%) |
24 | — | |||||
International Polyurethanes Investments B.V. (45%)(2) |
— | 17 | |||||
Jurong Ningwu New Materials Development Co., Ltd. (30%) |
12 | 10 | |||||
Others |
2 | 1 | |||||
Total equity method investments |
230 | 197 | |||||
Cost Method: |
|||||||
International Diol Company (4.35%) |
5 | 5 | |||||
White Mountain Titanium Corporation (3%) |
3 | — | |||||
Total investments |
$ | 238 | $ | 202 | |||
Summarized applicable financial information of Sasol-Huntsman is presented below (dollars in millions):
| |
Year ended December 31, |
||||||
|---|---|---|---|---|---|---|---|
| |
2011(1) | 2010 | |||||
Revenues |
$ | 40 | $ | 108 | |||
Gross profit |
7 | 14 | |||||
Net income |
(2 | ) | 10 | ||||
F-20
HUNTSMAN INTERNATIONAL LLC AND SUBSIDIARIES
NOTES TO CONSOLIDATED FINANCIAL STATEMENTS (Continued)
6. INVESTMENT IN UNCONSOLIDATED AFFILIATES (Continued)
Summarized applicable financial information of our other unconsolidated affiliates is presented below (dollars in millions):
| |
December 31, | |||||||||
|---|---|---|---|---|---|---|---|---|---|---|
| |
2012 | 2011 | 2010 | |||||||
Assets |
$ | 624 | $ | 621 | ||||||
Liabilities |
257 | 285 | ||||||||
Revenues |
1,083 | (1) | 954 | $ | 936 | |||||
Net income |
17 | (1) | 22 | 10 | ||||||
In 2008, we and our joint venture partner, the Zamil Group, formed Arabian Amines Company, our ethyleneamines manufacturing joint venture in Jubail, Saudi Arabia. Arabian Amines Company's funding requirements have been satisfied through a combination of debt and equity, with the equity already provided on a 50/50 basis by us and the Zamil Group. Trial production commenced in the second quarter of 2010, and from July 2010, Arabian Amines Company generated significant revenues from the sale of product. The plant has an approximate annual capacity of 60 million pounds. We purchase and sell all of the production from this joint venture. Arabian Amines Company was accounted for under the equity method during its development stage; we began consolidating this joint venture beginning July 1, 2010. For more information, see "Note 7. Variable Interest Entities."
During 2010, we recorded an immaterial non-recurring $18 million credit to equity income of investment in unconsolidated affiliates to appropriately reflect our investment in the Sasol-Huntsman joint venture. This credit represented a cumulative correction of an error that was also individually immaterial in each year since our initial investment in the joint venture in 1997. In connection with the expansion of the maleic anhydride capacity at our Sasol-Huntsman joint venture, a variable interest entity reconsideration event occurred in the second quarter of 2011 when the plant expansion began production. As a result of our assessment, we concluded that the joint venture is a variable interest entity and that we are the primary beneficiary. Accordingly, we began consolidating this joint venture during the second quarter of 2011. For more information, see "Note 7. Variable Interest Entities."
On November 13, 2012, we entered into an agreement to form a joint venture with Sinopec. The joint venture will involve the construction and operation of a PO/MTBE facility in China. Under the joint venture agreement, we will have a 49% interest in the joint venture and Sinopec will hold a 51% interest. Our equity investment is anticipated to be approximately $120 million, and we expect to receive significant license fees from the joint venture. The timing of equity contributions and license fee payments depends on various factors, but the majority are intended to be made over the course of the construction period of the plant (expected to be completed by the end of 2014).
F-21
HUNTSMAN INTERNATIONAL LLC AND SUBSIDIARIES
NOTES TO CONSOLIDATED FINANCIAL STATEMENTS (Continued)
7. VARIABLE INTEREST ENTITIES
We evaluate our investments and transactions to identify variable interest entities for which we are the primary beneficiary. We hold a variable interest in the following four joint ventures for which we are the primary beneficiary:
Creditors of these entities have no recourse to our general credit, except in the event that we offer guarantees of specified indebtedness. See "Note 14. Debt—Direct and Subsidiary Debt." As the primary beneficiary of these variable interest entities at December 31, 2012, the joint ventures' assets, liabilities and results of operations are included in our consolidated financial statements.
F-22
HUNTSMAN INTERNATIONAL LLC AND SUBSIDIARIES
NOTES TO CONSOLIDATED FINANCIAL STATEMENTS (Continued)
7. VARIABLE INTEREST ENTITIES (Continued)
The following table summarizes the carrying amount of our variable interest entities' assets and liabilities included in our consolidated balance sheets, before intercompany eliminations, as of December 31, 2012 and 2011 (dollars in millions):
| |
December 31, | ||||||
|---|---|---|---|---|---|---|---|
| |
2012 | 2011 | |||||
Current assets |
$ | 163 | $ | 140 | |||
Property, plant and equipment, net |
378 | 403 | |||||
Other noncurrent assets |
61 | 61 | |||||
Deferred income taxes |
45 | 45 | |||||
Intangible assets |
19 | 23 | |||||
Goodwill |
16 | 15 | |||||
Total assets |
$ | 682 | $ | 687 | |||
Current liabilities |
$ | 348 | $ | 145 | |||
Long-term debt |
82 | 269 | |||||
Deferred income taxes |
8 | 9 | |||||
Other noncurrent liabilities |
102 | 110 | |||||
Total liabilities |
$ | 540 | $ | 533 | |||
In April 2011, Arabian Amines Company settled a dispute with its contractors and received an amount totaling $11 million. Of this $11 million settlement, $8 million was related to damages incurred due to the delayed initial acceptance of the plant. This amount was recorded as other operating (income) expense in the consolidated statements of operations and included in the cash flows from operating activities in the consolidated statements of cash flows. The remaining $3 million of the settlement was received for the reimbursement of capital expenditures for work left unfinished by the contractors. This amount was included in cash flows from investing activities in the consolidated statements of cash flows.
F-23
HUNTSMAN INTERNATIONAL LLC AND SUBSIDIARIES
NOTES TO CONSOLIDATED FINANCIAL STATEMENTS (Continued)
7. VARIABLE INTEREST ENTITIES (Continued)
The following table summarizes the fair value of Sasol-Huntsman's assets and liabilities recorded upon initial consolidation in our consolidated balance sheet, before intercompany eliminations (dollars in millions):
| |
April 1, 2011 |
|||
|---|---|---|---|---|
Current assets |
$ | 61 | ||
Property, plant and equipment, net |
155 | |||
Intangible assets |
16 | |||
Goodwill |
17 | |||
Total assets |
$ | 249 | ||
Current liabilities |
$ | 23 | ||
Long-term debt |
93 | |||
Deferred income taxes |
8 | |||
Other noncurrent liabilities |
7 | |||
Total liabilities |
$ | 131 | ||
Goodwill of $17 million was recognized upon consolidation of Sasol-Huntsman, of which approximately $12 million is deductible for income tax purposes. The total amount of goodwill changed approximately $2 million from the date of consolidation to December 31, 2011, due to a change in the foreign currency exchange rate. All other intangible assets are being amortized over an average useful life of 18 years. The net change to goodwill in response to changes in the foreign currency exchange rate during 2012 was $1 million.
Sasol-Huntsman had revenues and earnings of $116 million and $7 million, respectively, for the period from the date of consolidation to December 31, 2011. If this consolidation had occurred on January 1, 2010, the approximate pro forma revenues attributable to our Company would have been $11,259 million and $9,337 million for 2011 and 2010, respectively. There would have been no impact to the combined earnings attributable to us excluding a one-time noncash gain of approximately $12 million recognized upon consolidation included in other operating income in the consolidated statements of operations and comprehensive (loss) income. Upon consolidation we also recognized a one-time noncash income tax expense of approximately $2 million. The fair value of the noncontrolling interest was estimated to be $61 million at April 1, 2011. The noncontrolling interest was valued at 50% of the fair value of the net assets as of April 1, 2011, as dictated by the ownership interest percentages, adjusted for certain tax consequences only applicable to one parent.
F-24
HUNTSMAN INTERNATIONAL LLC AND SUBSIDIARIES
NOTES TO CONSOLIDATED FINANCIAL STATEMENTS (Continued)
8. INTANGIBLE ASSETS
The gross carrying amount and accumulated amortization of intangible assets were as follows (dollars in millions):
| |
December 31, 2012 | December 31, 2011 | |||||||||||||||||
|---|---|---|---|---|---|---|---|---|---|---|---|---|---|---|---|---|---|---|---|
| |
Carrying Amount |
Accumulated Amortization |
Net | Carrying Amount |
Accumulated Amortization |
Net | |||||||||||||
Patents, trademarks and technology |
$ | 355 | $ | 318 | $ | 37 | $ | 363 | $ | 307 | $ | 56 | |||||||
Licenses and other agreements |
41 | 16 | 25 | 39 | 14 | 25 | |||||||||||||
Non-compete agreements |
2 | 2 | — | 2 | 2 | — | |||||||||||||
Other intangibles |
68 | 60 | 8 | 48 | 36 | 12 | |||||||||||||
Total |
$ | 466 | $ | 396 | $ | 70 | $ | 452 | $ | 359 | $ | 93 | |||||||
Amortization expense was $23 million, $30 million and $30 million for the years ended December 31, 2012, 2011 and 2010, respectively.
Our estimated future amortization expense for intangible assets over the next five years is as follows (dollars in millions):
Year ending December 31
|
|
|||
|---|---|---|---|---|
2013 |
$ | 21 | ||
2014 |
13 | |||
2015 |
5 | |||
2016 |
5 | |||
2017 |
4 | |||
9. OTHER NONCURRENT ASSETS
Other noncurrent assets consisted of the following (dollars in millions):
| |
December 31, | ||||||
|---|---|---|---|---|---|---|---|
| |
2012 | 2011 | |||||
Pension assets |
$ | 1 | $ | 100 | |||
Debt issuance costs |
29 | 31 | |||||
Capitalized turnaround costs |
127 | 141 | |||||
Spare parts inventory |
93 | 89 | |||||
Catalyst assets |
25 | 23 | |||||
Deposits |
33 | 31 | |||||
Other |
58 | 67 | |||||
Total |
$ | 366 | $ | 482 | |||
Amortization expense of catalyst assets for the years ended December 31, 2012, 2011 and 2010 was $10 million, $12 million and $12 million, respectively.
F-25
HUNTSMAN INTERNATIONAL LLC AND SUBSIDIARIES
NOTES TO CONSOLIDATED FINANCIAL STATEMENTS (Continued)
10. ACCRUED LIABILITIES
Accrued liabilities consisted of the following (dollars in millions):
| |
December 31, | ||||||
|---|---|---|---|---|---|---|---|
| |
2012 | 2011 | |||||
Payroll and related costs |
$ | 149 | $ | 158 | |||
Interest |
34 | 49 | |||||
Volume and rebate accruals |
85 | 91 | |||||
Income taxes |
44 | 46 | |||||
Taxes other than income taxes |
87 | 61 | |||||
Restructuring and plant closing costs |
93 | 91 | |||||
Environmental accruals |
10 | 7 | |||||
Pension liabilities |
11 | 12 | |||||
Other postretirement benefits |
12 | 12 | |||||
Self-insured casualty loss reserves |
11 | 13 | |||||
Deferred revenue |
16 | 28 | |||||
Legal reserve |
15 | 15 | |||||
Other miscellaneous accruals |
156 | 111 | |||||
Total |
$ | 723 | $ | 694 | |||
F-26
HUNTSMAN INTERNATIONAL LLC AND SUBSIDIARIES
NOTES TO CONSOLIDATED FINANCIAL STATEMENTS (Continued)
11. RESTRUCTURING, IMPAIRMENT AND PLANT CLOSING COSTS
As of December 31, 2012, 2011 and 2010, accrued restructuring, impairment and plant closing costs by type of cost and initiative consisted of the following (dollars in millions):
| |
Workforce reductions(1) |
Demolition and decommissioning |
Non-cancelable lease costs |
Other restructuring costs |
Total(2) | |||||||||||
|---|---|---|---|---|---|---|---|---|---|---|---|---|---|---|---|---|
Accrued liabilities as of January 1, 2010 |
$ | 60 | $ | 2 | $ | 2 | $ | 11 | $ | 75 | ||||||
2010 charges for 2005 and prior initiatives |
1 | — | — | — | 1 | |||||||||||
2010 charges for 2008 initiatives |
1 | — | — | — | 1 | |||||||||||
2010 charges for 2009 initiatives |
4 | — | — | 5 | 9 | |||||||||||
2010 charges for 2010 initiatives |
22 | — | — | 1 | 23 | |||||||||||
Reversal of reserves no longer required |
(6 | ) | — | (1 | ) | — | (7 | ) | ||||||||
2010 payments for 2005 and prior initiatives |
(1 | ) | (1 | ) | — | — | (2 | ) | ||||||||
2010 payments for 2006 initiatives |
(3 | ) | — | — | — | (3 | ) | |||||||||
2010 payments for 2008 initiatives |
(7 | ) | — | — | — | (7 | ) | |||||||||
2010 payments for 2009 initiatives |
(11 | ) | — | — | (5 | ) | (16 | ) | ||||||||
2010 payments for 2010 initiatives |
(1 | ) | — | — | (2 | ) | (3 | ) | ||||||||
Net activity of discontinued operations |
(26 | ) | — | — | — | (26 | ) | |||||||||
Foreign currency effect on liability balance |
3 | — | — | 1 | 4 | |||||||||||
Accrued liabilities as of December 31, 2010 |
36 | 1 | 1 | 11 | 49 | |||||||||||
2011 charges for 2006 and prior initiatives |
1 | — | — | — | 1 | |||||||||||
2011 charges for 2009 initiatives |
1 | — | — | 6 | 7 | |||||||||||
2011 charges for 2010 initiatives |
2 | 2 | 10 | 1 | 15 | |||||||||||
2011 charges for 2011 initiatives |
87 | — | 1 | 1 | 89 | |||||||||||
Reversal of reserves no longer required |
(5 | ) | — | — | — | (5 | ) | |||||||||
2011 payments for 2006 and prior initiatives |
(1 | ) | — | (1 | ) | (1 | ) | (3 | ) | |||||||
2011 payments for 2008 initiatives |
(2 | ) | — | — | — | (2 | ) | |||||||||
2011 payments for 2009 initiatives |
(6 | ) | — | — | (6 | ) | (12 | ) | ||||||||
2011 payments for 2010 initiatives |
(17 | ) | (3 | ) | — | (1 | ) | (21 | ) | |||||||
2011 payments for 2011 initiatives |
(13 | ) | — | — | (1 | ) | (14 | ) | ||||||||
Net activity of discontinued operations |
— | — | — | (2 | ) | (2 | ) | |||||||||
Foreign currency effect on liability balance |
(10 | ) | — | — | — | (10 | ) | |||||||||
Accrued liabilities as of December 31, 2011 |
73 | — | 11 | 8 | 92 | |||||||||||
2012 charges for 2007 and prior initiatives |
2 | — | — | — | 2 | |||||||||||
2012 charges for 2009 initiatives |
1 | — | — | 4 | 5 | |||||||||||
2012 charges for 2010 initiatives |
2 | — | — | — | 2 | |||||||||||
2012 charges for 2011 initiatives |
4 | 5 | — | 6 | 15 | |||||||||||
2012 charges for 2012 initiatives |
64 | — | — | 5 | 69 | |||||||||||
Reversal of reserves no longer required |
(15 | ) | — | — | (1 | ) | (16 | ) | ||||||||
2012 payments for 2007 and prior initiatives |
(2 | ) | — | — | (1 | ) | (3 | ) | ||||||||
2012 payments for 2009 initiatives |
(1 | ) | — | — | (5 | ) | (6 | ) | ||||||||
2012 payments for 2010 initiatives |
(3 | ) | — | (1 | ) | — | (4 | ) | ||||||||
2012 payments for 2011 initiatives |
(25 | ) | (6 | ) | (1 | ) | (5 | ) | (37 | ) | ||||||
2012 payments for 2012 initiatives |
(12 | ) | — | — | (6 | ) | (18 | ) | ||||||||
Foreign currency effect on liability balance |
2 | 1 | — | 1 | 4 | |||||||||||
Accrued liabilities as of December 31, 2012 |
$ | 90 | $ | — | $ | 9 | $ | 6 | $ | 105 | ||||||
F-27
HUNTSMAN INTERNATIONAL LLC AND SUBSIDIARIES
NOTES TO CONSOLIDATED FINANCIAL STATEMENTS (Continued)
11. RESTRUCTURING, IMPAIRMENT AND PLANT CLOSING COSTS (Continued)
| |
December 31, | ||||||
|---|---|---|---|---|---|---|---|
| |
2012 | 2011 | |||||
2007 initiatives and prior |
$ | 2 | $ | 2 | |||
2009 initiatives |
7 | 11 | |||||
2010 initiatives |
9 | 16 | |||||
2011 initiatives |
34 | 63 | |||||
2012 initiatives |
53 | — | |||||
Total |
$ | 105 | $ | 92 | |||
Details with respect to our reserves for restructuring, impairment and plant closing costs are provided below by segment and initiative (dollars in millions):
| |
Polyurethanes | Performance Products |
Advanced Materials |
Textile Effects |
Pigments | Discontinued Operations |
Corporate & Other |
Total | |||||||||||||||||
|---|---|---|---|---|---|---|---|---|---|---|---|---|---|---|---|---|---|---|---|---|---|---|---|---|---|
Accrued liabilities as of January 1, 2010 |
$ | 2 | $ | — | $ | 7 | $ | 17 | $ | 11 | $ | 34 | $ | 4 | $ | 75 | |||||||||
2010 charges for 2005 initiatives |
— | — | — | — | 1 | — | — | 1 | |||||||||||||||||
2010 charges for 2008 initiatives |
— | — | — | 1 | — | — | — | 1 | |||||||||||||||||
2010 charges for 2009 initiatives |
— | — | 1 | — | 8 | — | — | 9 | |||||||||||||||||
2010 charges for 2010 initiatives |
— | 2 | — | 15 | — | — | 6 | 23 | |||||||||||||||||
Reversal of reserves no longer required |
— | — | (3 | ) | (1 | ) | (2 | ) | — | (1 | ) | (7 | ) | ||||||||||||
2010 payments for 2005 initiatives |
(1 | ) | — | — | — | (1 | ) | — | — | (2 | ) | ||||||||||||||
2010 payments for 2006 initiatives |
— | — | — | (3 | ) | — | — | — | (3 | ) | |||||||||||||||
2010 payments for 2008 initiatives |
(1 | ) | — | — | (5 | ) | (1 | ) | — | — | (7 | ) | |||||||||||||
2010 payments for 2009 initiatives |
— | — | (3 | ) | (2 | ) | (8 | ) | — | (3 | ) | (16 | ) | ||||||||||||
2010 payments for 2010 initiatives |
— | (1 | ) | — | — | — | — | (2 | ) | (3 | ) | ||||||||||||||
Net activity of discontinued operations |
— | — | — | — | — | (26 | ) | — | (26 | ) | |||||||||||||||
Foreign currency effect on liability balance |
— | — | — | 3 | — | — | 1 | 4 | |||||||||||||||||
Accrued liabilities as of December 31, 2010 |
— | 1 | 2 | 25 | 8 | 8 | 5 | 49 | |||||||||||||||||
2011 charges for 2006 and prior initiatives |
— | — | — | 1 | — | — | — | 1 | |||||||||||||||||
2011 charges for 2009 Initiatives |
— | — | — | — | 7 | — | — | 7 | |||||||||||||||||
2011 charges for 2010 Initiatives |
— | — | — | 13 | — | — | 2 | 15 | |||||||||||||||||
2011 charges for 2011 Initiatives |
— | — | 21 | 65 | 3 | — | — | 89 | |||||||||||||||||
Reversal of reserves no longer required |
— | — | (1 | ) | (4 | ) | — | — | — | (5 | ) | ||||||||||||||
2011 payments for 2006 and prior initiatives |
— | — | — | (2 | ) | (1 | ) | — | — | (3 | ) | ||||||||||||||
2011 payments for 2008 Initiatives |
— | — | — | (1 | ) | (1 | ) | — | — | (2 | ) | ||||||||||||||
2011 payments for 2009 Initiatives |
— | — | (1 | ) | — | (11 | ) | — | — | (12 | ) | ||||||||||||||
2011 payments for 2010 Initiatives |
— | — | — | (15 | ) | — | — | (6 | ) | (21 | ) | ||||||||||||||
2011 payments for 2011 Initiatives |
— | — | (7 | ) | (5 | ) | (2 | ) | — | — | (14 | ) | |||||||||||||
Net activity of discontinued operations |
— | — | — | — | — | (2 | ) | — | (2 | ) | |||||||||||||||
Foreign currency effect on liability balance |
— | — | (2 | ) | (8 | ) | — | — | — | (10 | ) | ||||||||||||||
F-28
HUNTSMAN INTERNATIONAL LLC AND SUBSIDIARIES
NOTES TO CONSOLIDATED FINANCIAL STATEMENTS (Continued)
11. RESTRUCTURING, IMPAIRMENT AND PLANT CLOSING COSTS (Continued)
| |
Polyurethanes | Performance Products |
Advanced Materials |
Textile Effects |
Pigments | Discontinued Operations |
Corporate & Other |
Total | |||||||||||||||||
|---|---|---|---|---|---|---|---|---|---|---|---|---|---|---|---|---|---|---|---|---|---|---|---|---|---|
Accrued liabilities as of December 31, 2011 |
— | 1 | 12 | 69 | 3 | 6 | 1 | 92 | |||||||||||||||||
2012 charges for 2007 and prior initiatives |
— | — | — | 2 | — | — | — | 2 | |||||||||||||||||
2012 charges for 2009 Initiatives |
— | — | 1 | — | 4 | — | — | 5 | |||||||||||||||||
2012 charges for 2010 Initiatives |
— | 1 | — | — | — | — | 1 | 2 | |||||||||||||||||
2012 charges for 2011 Initiatives |
— | — | 3 | 12 | — | — | — | 15 | |||||||||||||||||
2012 charges for 2012 Initiatives |
38 | — | 30 | — | — | — | 1 | 69 | |||||||||||||||||
Reversal of reserves no longer required |
— | — | — | (16 | ) | — | — | — | (16 | ) | |||||||||||||||
2012 payments for 2007 and prior initiatives |
— | — | — | (3 | ) | — | — | — | (3 | ) | |||||||||||||||
2012 payments for 2009 Initiatives |
— | — | (1 | ) | — | (5 | ) | — | — | (6 | ) | ||||||||||||||
2012 payments for 2010 Initiatives |
— | (2 | ) | — | (1 | ) | — | — | (1 | ) | (4 | ) | |||||||||||||
2012 payments for 2011 Initiatives |
— | — | (14 | ) | (23 | ) | — | — | — | (37 | ) | ||||||||||||||
2012 payments for 2012 Initiatives |
(12 | ) | — | (6 | ) | — | — | — | — | (18 | ) | ||||||||||||||
Foreign currency effect on liability balance |
1 | — | 2 | 2 | (1 | ) | — | — | 4 | ||||||||||||||||
Accrued liabilities as of December 31, 2012 |
$ | 27 | $ | — | $ | 27 | $ | 42 | $ | 1 | $ | 6 | $ | 2 | $ | 105 | |||||||||
Current portion of restructuring reserves |
$ | 27 | $ | — | $ | 26 | $ | 31 | $ | 1 | $ | 6 | $ | 2 | $ | 93 | |||||||||
Long-term portion of restructuring reserve |
— | — | 1 | 11 | — | — | — | 12 | |||||||||||||||||
Estimated additional future charges for current restructuring projects |
|||||||||||||||||||||||||
Estimated additional charges within one year |
$ | 3 | $ | — | $ | 17 | $ | 80 | $ | — | $ | — | $ | — | $ | 100 | |||||||||
Estimated additional charges beyond one year |
— | — | 2 | — | — | — | — | 2 | |||||||||||||||||
F-29
HUNTSMAN INTERNATIONAL LLC AND SUBSIDIARIES
NOTES TO CONSOLIDATED FINANCIAL STATEMENTS (Continued)
11. RESTRUCTURING, IMPAIRMENT AND PLANT CLOSING COSTS (Continued)
Details with respect to cash and noncash restructuring charges for the years ended December 31, 2012, 2011 and 2010 by initiative are provided below (dollars in millions):
Cash charges: |
||||
2012 charges for 2007 and prior initiatives |
$ | 2 | ||
2012 charges for 2009 initiatives |
5 | |||
2012 charges for 2010 initiatives |
2 | |||
2012 charges for 2011 initiatives |
15 | |||
2012 charges for 2012 initiatives |
69 | |||
Reversal of reserves no longer required |
(16 | ) | ||
Non-cash charges |
15 | |||
Total 2012 Restructuring, Impairment and Plant Closing Costs |
$ | 92 | ||
Cash charges: |
||||
2011 charges for 2006 and prior initiatives |
$ | 1 | ||
2011 charges for 2009 initiatives |
7 | |||
2011 charges for 2010 initiatives |
15 | |||
2011 charges for 2011 initiatives |
89 | |||
Reversal of reserves no longer required |
(5 | ) | ||
Non-cash charges |
60 | |||
Total 2011 Restructuring, Impairment and Plant Closing Costs |
$ | 167 | ||
Cash charges: |
||||
2010 charges for 2005 and prior initiatives |
$ | 1 | ||
2010 charges for 2008 initiatives |
1 | |||
2010 charges for 2009 initiatives |
9 | |||
2010 charges for 2010 initiatives |
23 | |||
Reversal of reserves no longer required |
(7 | ) | ||
Non-cash charges |
2 | |||
Total 2010 Restructuring, Impairment and Plant Closing Costs |
$ | 29 | ||
2012 RESTRUCTURING ACTIVITIES
During 2012, our Polyurethanes segment implemented a restructuring program to reduce annualized fixed costs by approximately $75 million by the third quarter of 2013. In connection with this program, we recorded restructuring expenses of $38 million during 2012 primarily for workforce reductions. As of December 31, 2012, our Polyurethanes segment restructuring reserve consisted of $27 million related to this program. We expect to incur additional charges of $3 million through 2013 related to our initiative.
During the fourth quarter of 2012, our Advanced Materials segment began implementing a global transformational change program, subject to consultation with relevant employee representatives, designed to improve the segment's manufacturing efficiencies, enhance commercial excellence and ensure its long-term global competitiveness. As of December 31, 2012, our Advanced Materials segment restructuring reserve consisted of $27 million primarily related to this program. During 2012, we recorded charges of $38, million of which $28 million related to our global transformational change
F-30
HUNTSMAN INTERNATIONAL LLC AND SUBSIDIARIES
NOTES TO CONSOLIDATED FINANCIAL STATEMENTS (Continued)
11. RESTRUCTURING, IMPAIRMENT AND PLANT CLOSING COSTS (Continued)
program, $3 million related to the reorganization of our global structure and relocation of our divisional headquarters from Basel, Switzerland to The Woodlands, Texas and $3 million related primarily to a redesign of our planning process focused on inventory reduction. Our Advanced Materials segment also recorded noncash charges of $4 million related to pension settlements. We expect to incur additional charges of $19 million through the first half of 2014 related to our initiatives.
During 2011, our Textile Effects segment began implementing a significant restructuring program, including the closure of our production facilities and business support offices in Basel, Switzerland, as part of an ongoing strategic program aimed at improving the segment's long-term global competitiveness. In connection with this plan, during 2012, we recorded cash charges of $1 million for workforce reductions, $9 million for decommissioning and other restructuring expenses, and noncash charges of $11 million primarily for pension settlements. We expect to incur additional restructuring and plant closing charges of up to approximately $80 million through 2014 related to the closure of our production facilities and business support offices in Basel, Switzerland. In addition, during 2012, our Textile Effects segment recorded charges of $4 million of which $2 million related to the closure of our St. Fons, France facility and $2 million related to a global transfer pricing initiative. We reversed charges of $16 million which were no longer required for workforce reductions at our production facility in Langweid, Germany, the simplification of the commercial organization and optimization of our distribution network, the consolidation of manufacturing activities and processes at our site in Basel, Switzerland and the closure of our production facilities in Basel, Switzerland.
As of December 31, 2012, our Textile Effects segment restructuring reserve consisted of $42 million, of which $2 million related to opening balance sheet liabilities from the Textile Effects Acquisition, $9 million related to the consolidation of our Switzerland manufacturing facilities and $31 million related to the closure of our production facilities and business support offices in Basel, Switzerland.
As of December 31, 2012, our Pigments segment restructuring reserve consisted of $1 million primarily related to workforce reductions at our Scarlino, Italy plant. During 2012, our Pigments segment recorded charges of $4 million related to the closure of our Grimsby, U.K. plant.
The restructuring reserve related to discontinued operations as of December 31, 2012 of $6 million was associated with the closure of our Australian styrenics business. For more information, see "Note 25. Discontinued Operations—Australian Styrenics Business Shutdown."
As of December 31, 2012, our Corporate and other segment restructuring reserve consisted of $2 million primarily related to a reorganization and regional consolidation of our purchasing activities. During 2012, we recorded charges of $2 million in Corporate and other primarily related to workforce reductions in connection with this project.
2011 RESTRUCTURING ACTIVITIES
As of December 31, 2011, our Advanced Materials segment restructuring reserve consisted of $12 million related to workforce reductions in connection with a reorganization of its global structure and relocation of its divisional headquarters from Basel, Switzerland to The Woodlands, Texas. During 2011, our Advanced Materials segment recorded net charges of $20 million primarily related this activity.
F-31
HUNTSMAN INTERNATIONAL LLC AND SUBSIDIARIES
NOTES TO CONSOLIDATED FINANCIAL STATEMENTS (Continued)
11. RESTRUCTURING, IMPAIRMENT AND PLANT CLOSING COSTS (Continued)
On September 27, 2011, we announced plans to implement a significant restructuring of our Textile Effects segment, including the closure of our production facilities and business support offices in Basel, Switzerland, as part of an ongoing strategic program aimed at improving the Textile Effects segment's long-term global competitiveness. In connection with this plan during 2011, we recorded a charge of $62 million for workforce reduction, a pension curtailment gain of $38 million and a charge of $53 million for the impairment of long-lived assets at our Basel, Switzerland manufacturing facility. For purposes of calculating the impairment charge, the fair value of the Basel, Switzerland manufacturing facility was based on the discounted cash flows of that facility. As of December 31, 2011, our Textile Effects segment restructuring reserve consisted of $69 million, of which $2 million related to opening balance sheet liabilities from the Textile Effects Acquisition, $2 million related to workforce reductions at our production facility in Langweid, Germany, $2 million related to the simplification of the commercial organization and optimization of our distribution network, $15 million related to the consolidation of manufacturing activities and processes at our site in Basel, Switzerland, $47 million related to the closure of our production facilities and business support offices in Basel, Switzerland and $1 million related to the consolidation of our North Carolina sites.
In addition, during 2011, our Textile Effects segment recorded charges of $22 million, of which $5 million related to simplification of our commercial organization and optimization of our distribution network, $12 million related to non-workforce reductions incurred for the consolidation of our Switzerland manufacturing facilities, and $4 million related to the consolidation of our North Carolina sites. We reversed charges of $4 million which were no longer required for workforce reductions at our production facility in Langweid, Germany and the consolidation of manufacturing activities and processes at our site in Basel, Switzerland.
As of December 31, 2011, our Pigments segment restructuring reserve consisted of $3 million primarily related to workforce reductions at our Huelva, Spain and Scarlino, Italy plants. During 2011, our Pigments segment recorded charges of $10 million, of which $7 million related to the closure of our Grimsby, U.K. plant and $3 million related to workforce reductions at our Umbogintwini, South Africa plant.
The restructuring reserve related to discontinued operations as of December 31, 2011 of $6 million was associated with the closure of our Australian styrenics business. For more information, see "Note 25. Discontinued Operations—Australian Styrenics Business Shutdown."
As of December 31, 2011, our Corporate and other segment restructuring reserve consisted of $1 million primarily related to a reorganization and regional consolidation of our transactional accounting activities. During 2011, we recorded charges of $2 million in Corporate and other primarily related to workforce reductions in connection with this project.
2010 RESTRUCTURING ACTIVITIES
As of December 31, 2010, our Performance Products segment restructuring reserve consisted of $1 million related to workforce reductions in connection with a new Performance Products organizational structure. During 2010, we recorded charges of $2 million related to workforce reductions in connection with this project.
As of December 31, 2010, our Advanced Materials segment restructuring reserve consisted of $2 million related to workforce reductions in connection with a reorganization designed to implement a
F-32
HUNTSMAN INTERNATIONAL LLC AND SUBSIDIARIES
NOTES TO CONSOLIDATED FINANCIAL STATEMENTS (Continued)
11. RESTRUCTURING, IMPAIRMENT AND PLANT CLOSING COSTS (Continued)
regional management structure. During 2010, we recorded net reversals of $2 million primarily related to workforce reductions in connection to this project.
As of December 31, 2010, our Textile Effects segment restructuring reserve consisted of $25 million, of which $2 million related to opening balance sheet liabilities from the Textile Effects Acquisition, $1 million related to the streamlining of the textile effects business into two global strategic business units as announced during the fourth quarter of 2008, $3 million related to workforce reductions at our production facility in Langweid, Germany and $19 million related to the consolidation of manufacturing activities and processes at our site in Basel, Switzerland. During 2010, our Textile Effects segment recorded net charges of $15 million primarily related to the consolidation of manufacturing activities and processes at our site in Basel, Switzerland.
As of December 31, 2010, our Pigments segment restructuring reserve consisted of $8 million primarily related to workforce reductions at our Scarlino, Italy plant. During 2010, our Pigments segment recorded net charges of $7 million primarily related to the closure of our Grimsby, U.K. plant.
The restructuring reserve related to discontinued operations as of December 31, 2010 of $8 million was associated with the closure of our Australian styrenics business. For more information, see "Note 25. Discontinued Operations—Australian Styrenics Business Shutdown."
As of December 31, 2010, our Corporate and other segment restructuring reserve consisted of $5 million primarily related to a reorganization and regional consolidation of our transactional accounting and purchasing activities. During 2010, we recorded net charges of $5 million in Corporate and other primarily related to workforce reductions in connection with these projects.
12. ASSET RETIREMENT OBLIGATIONS
Asset retirement obligations consist primarily of landfill capping, closure and post-closure costs and asbestos abatement costs. We are legally required to perform capping and closure and post-closure care on the landfills and asbestos abatement on certain of our premises. For each asset retirement obligation we recognized the estimated fair value of a liability and capitalized the cost as part of the cost basis of the related asset.
The following table describes changes to our asset retirement obligation liabilities, all of which were recorded in other noncurrent liabilities on the accompanying balance sheets (dollars in millions):
| |
December 31, | ||||||
|---|---|---|---|---|---|---|---|
| |
2012 | 2011 | |||||
Asset retirement obligation at beginning of year |
$ | 26 | $ | 24 | |||
Accretion expense |
2 | 2 | |||||
Liabilities incurred |
2 | — | |||||
Liabilities assumed in connection with the consolidation of a variable interest entity |
— | 2 | |||||
Liabilities settled |
(3 | ) | (1 | ) | |||
Foreign currency effect on reserve balance |
1 | (1 | ) | ||||
Asset retirement obligation at end of year |
$ | 28 | $ | 26 | |||
F-33
HUNTSMAN INTERNATIONAL LLC AND SUBSIDIARIES
NOTES TO CONSOLIDATED FINANCIAL STATEMENTS (Continued)
13. OTHER NONCURRENT LIABILITIES
Other noncurrent liabilities consisted of the following (dollars in millions):
| |
December 31, | ||||||
|---|---|---|---|---|---|---|---|
| |
2012 | 2011 | |||||
Pension liabilities |
$ | 830 | $ | 689 | |||
Other postretirement benefits |
131 | 122 | |||||
Environmental accruals |
24 | 29 | |||||
Restructuring and plant closing costs |
12 | 1 | |||||
Asset retirement obligations |
28 | 26 | |||||
Employee benefit accrual |
34 | 22 | |||||
Legal reserve |
11 | 22 | |||||
Other |
87 | 92 | |||||
Total |
$ | 1,157 | $ | 1,003 | |||
14. DEBT
Outstanding debt of consolidated entities consisted of the following (dollars in millions):
| |
December 31, | ||||||
|---|---|---|---|---|---|---|---|
| |
2012 | 2011 | |||||
Senior Credit Facilities: |
|||||||
Term loans |
$ | 1,565 | $ | 1,696 | |||
Amounts outstanding under A/R programs |
241 | 237 | |||||
Senior notes |
568 | 472 | |||||
Senior subordinated notes |
892 | 976 | |||||
HPS (China) debt |
94 | 167 | |||||
Variable interest entities |
270 | 281 | |||||
Other |
72 | 113 | |||||
Total debt—excluding debt to affiliates |
$ | 3,702 | $ | 3,942 | |||
Total current portion of debt |
$ | 288 | $ | 212 | |||
Long-term portion |
3,414 | 3,730 | |||||
Total debt—excluding debt to affiliates |
$ | 3,702 | $ | 3,942 | |||
Total debt—excluding debt to affiliates |
$ | 3,702 | $ | 3,942 | |||
Notes payable to affiliates-current |
100 | 100 | |||||
Notes payable to affiliates-noncurrent |
599 | 439 | |||||
Total debt |
$ | 4,401 | $ | 4,481 | |||
F-34
HUNTSMAN INTERNATIONAL LLC AND SUBSIDIARIES
NOTES TO CONSOLIDATED FINANCIAL STATEMENTS (Continued)
14. DEBT (Continued)
Senior Credit Facilities
As of December 31, 2012, our Senior Credit Facilities consisted of our Revolving Facility, our Term Loan B, our Extended Term Loan B, our Extended Term Loan B—Series 2, and our Term Loan C as follows (dollars in millions):
Facility
|
Committed Amount |
Principal Outstanding |
Carrying Value |
Interest Rate(2) | Maturity | ||||||||||
|---|---|---|---|---|---|---|---|---|---|---|---|---|---|---|---|
Revolving Facility |
$ | 400 | $ | — | (1) | $ | — | (1) | USD LIBOR plus 2.50% | 2017 | (3) | ||||
Term Loan B |
NA | 193 | 193 | USD LIBOR plus 1.50% | 2014 | ||||||||||
Extended Term Loan B |
NA | 637 | 637 | USD LIBOR plus 2.50% | 2017 | (3) | |||||||||
Extended Term Loan B— Series 2 |
NA | 342 | 342 | USD LIBOR plus 2.75% | 2017 | (3) | |||||||||
Term Loan C |
NA | 419 | 393 | USD LIBOR plus 2.25% | 2016 | ||||||||||
Our obligations under the Senior Credit Facilities are guaranteed by our guarantors, which consist of substantially all of our domestic subsidiaries and certain of our foreign subsidiaries, and are secured by a first priority lien on substantially all of our domestic property, plant and equipment, the stock of all of our material domestic subsidiaries and certain foreign subsidiaries, and pledges of intercompany notes between certain of our subsidiaries.
During the year ended December 31, 2012, we made the following payments on our Senior Credit Facilities:
F-35
HUNTSMAN INTERNATIONAL LLC AND SUBSIDIARIES
NOTES TO CONSOLIDATED FINANCIAL STATEMENTS (Continued)
14. DEBT (Continued)
In connection with these debt repayments, we recognized a loss on early extinguishment of debt of approximately $2 million during the year ended December 31, 2012.
Amendment to Credit Agreement
On March 6, 2012, we entered into a seventh amendment to our Senior Credit Facilities. Among other things, the amendment:
On March 7, 2011, we entered into a sixth amendment to our credit agreement. The amendment, among other things, extended $650 million of aggregate principal of Term Loan B to a stated maturity of April 2017 (now referred to as Extended Term Loan B) and increased the interest rate on the Extended Term Loan B to LIBOR plus 2.50%.
A/R Programs
Our A/R Programs are structured so that we grant a participating undivided interest in certain of our trade receivables to the U.S. SPE and the EU SPE. We retain the servicing rights and a retained interest in the securitized receivables. Information regarding the A/R Programs was as follows (monetary amounts in millions):
| December 31, 2012 | ||||||||
|---|---|---|---|---|---|---|---|---|
Facility
|
Maturity | Maximum Funding Availability(1) |
Amount Outstanding |
Interest Rate(2)(3) | ||||
U.S. A/R Program |
April 2014 | $250 | $90(4) | Applicable Rate plus 1.50% - 1.65% |
||||
EU A/R Program |
April 2014 | €225 (approximately $297) |
€114 (approximately $151) |
Applicable Rate plus 2.0% | ||||
F-36
HUNTSMAN INTERNATIONAL LLC AND SUBSIDIARIES
NOTES TO CONSOLIDATED FINANCIAL STATEMENTS (Continued)
14. DEBT (Continued)
| December 31, 2011 | ||||||||
|---|---|---|---|---|---|---|---|---|
Facility
|
Maturity | Maximum Funding Availability(1) |
Amount Outstanding |
Interest Rate(2)(3) | ||||
U.S. A/R Program |
April 2014 | $250 | $90(4) | Applicable Rate plus 1.50% - 1.65% |
||||
EU A/R Program |
April 2014 | €225 (approximately $291) |
€114 (approximately $147) |
Applicable Rate plus 2.0% | ||||
As of December 31, 2012 and December 31, 2011, $520 million and $633 million, respectively, of accounts receivable were pledged as collateral under the A/R Programs.
On April 15, 2011, we entered into an amendment to our EU A/R Program. This amendment, among other things, extended the scheduled commitment termination date of the program to April 2014, added an additional lender to the program and reduced the applicable margin on borrowings to 2.0%.
On April 18, 2011, we entered into an amendment to our U.S. A/R Program. This amendment, among other things, extended the scheduled commitment termination date of the program to April 2014, added an additional lender to the program and reduced the applicable margin on borrowings to a range of 1.50% to 1.65%.
F-37
HUNTSMAN INTERNATIONAL LLC AND SUBSIDIARIES
NOTES TO CONSOLIDATED FINANCIAL STATEMENTS (Continued)
14. DEBT (Continued)
Notes
As of December 31, 2012, we had outstanding the following notes (monetary amounts in millions):
Notes
|
Maturity | Interest Rate | Amount Outstanding | ||||
|---|---|---|---|---|---|---|---|
2016 Senior Notes |
June 2016 | 5.50% | (1) | $200 ($168 carrying value) | |||
2020 Senior Notes |
November 2020 | 4.875 | % | $400 | |||
Senior Subordinated Notes |
March 2020 | 8.625 | % | $350 | |||
Senior Subordinated Notes |
March 2021 | 8.625 | % | $530 ($542 carrying value) | |||
Our notes are governed by indentures which impose certain limitations on our Company including, among other things limitations on the incurrence of debt, distributions, certain restricted payments, asset sales, and affiliate transactions. The notes are unsecured obligations and are guaranteed by certain subsidiaries named as guarantors.
On November 19, 2012, we completed a $400 million offering of the 2020 Senior Notes. We used the net proceeds to redeem a portion of the 2016 Senior Notes. See "—Redemption of Notes and Loss on Early Extinguishment of Debt."
The 2020 Senior Notes bear interest at the rate of 4.875% per year payable semi-annually on May 15 and November 15 of each year, beginning on May 15, 2013 and are due on November 15, 2020. We may redeem the 2020 Senior Notes in whole or in part at any time prior to August 17, 2020 at a price equal to 100% of the principal amount thereof plus a "make-whole" premium and accrued and unpaid interest. We may redeem the 2020 Senior Notes in whole or in part on or after August 17, 2020 at a price equal to 100% of the principal amount thereof plus accrued and unpaid interest.
The 2020 Senior Notes are general unsecured senior obligations and are guaranteed on a general unsecured senior basis by the Guarantors. The indenture with respect to the 2020 Senior Notes imposes certain limitations on the ability of us and our subsidiaries to, among other things, incur additional indebtedness secured by any principal properties, incur indebtedness of nonguarantor subsidiaries, enter into sale and leaseback transactions with respect to any principal properties and consolidate or merge with or into any other person or lease, sell or transfer all or substantially all of its properties and assets. Upon the occurrence of certain change of control events, holders of the 2020 Senior Notes will have the right to require that we purchase all or a portion of such holder's 2020 Senior Notes in cash at a purchase price equal to 101% of the principal amount thereof plus accrued and unpaid interest to the date of repurchase.
F-38
HUNTSMAN INTERNATIONAL LLC AND SUBSIDIARIES
NOTES TO CONSOLIDATED FINANCIAL STATEMENTS (Continued)
14. DEBT (Continued)
Redemption of Notes and Loss on Early Extinguishment of Debt
During the years ended December 31, 2012 and 2011, we redeemed or repurchased the following notes (monetary amounts in millions):
Date of Redemption |
Notes | Principal Amount of Notes Redeemed |
Amount Paid (Excluding Accrued Interest) |
Loss on Early Extinguishment of Debt |
||||||
|---|---|---|---|---|---|---|---|---|---|---|
December 3, 2012 |
5.50% Senior Notes due 2016 |
$400 | $400 | $ | 77 | |||||
March 26, 2012 |
7.50% Senior Subordinated Notes due 2015 |
€64 (approximately $86) |
€65 (approximately $87) |
$ | 1 | |||||
Three months ended December 31, 2011 |
6.875% Senior Subordinated Notes due 2013 |
€70 (approximately $94) |
€71 (approximately $96) |
$ | 2 | |||||
Three months ended September 30, 2011 |
6.875% Senior Subordinated Notes due 2013 |
€14 (approximately $19) |
€14 (approximately $19) |
$ | — | |||||
Three months ended September 30, 2011 |
7.50% Senior Subordinated Notes due 2015 |
€12 (approximately $17) |
€12 (approximately $17) |
$ | — | |||||
July 25, 2011 |
7.375% Senior Subordinated Notes due 2015 |
$75 | $77 | $ | 2 | |||||
January 18, 2011 |
7.375% Senior Subordinated Notes due 2015 |
$100 | $102 | $ | 3 | |||||
Variable Interest Entity Debt
As of December 31, 2012, Arabian Amines Company had $180 million outstanding under its loan commitments and debt financing arrangements described below. Arabian Amines Company, our consolidated 50%-owned joint venture, is currently not in compliance with certain financial covenants contained under these loan commitments. We do not guaranty these loan commitments and Arabian Amines Company is not a guarantor of any of our other debt obligations, and the noncompliance with these financial covenants does not affect any of our other debt obligations. Arabian Amines Company is currently in discussions with the lenders under these loan commitments and expects to resolve the noncompliance. The amounts outstanding under these loan commitments were classified as current on the accompanying consolidated balance sheets as of December 31, 2012.
F-39
HUNTSMAN INTERNATIONAL LLC AND SUBSIDIARIES
NOTES TO CONSOLIDATED FINANCIAL STATEMENTS (Continued)
14. DEBT (Continued)
assets of the project and is 100% guaranteed by the Zamil Group, our 50% joint venture partner.
As of December 31, 2012, Sasol-Huntsman had a facility agreement which included a €5 million (approximately $6 million) revolving facility and €68 million (approximately $90 million) outstanding under the term loan facility. The facility will be repaid over semiannual installments that began in 2011, with the final repayment scheduled for December 2018. Obligations under the facility agreement are secured by, among other things, first priority right on the property, plant and equipment of Sasol-Huntsman
Other Debt
During the year ended December 31, 2012, HPS repaid $4 million and RMB 120 million (approximately $19 million) on term loans and working capital loans under its secured facilities. As of December 31, 2012, HPS had $8 million and RMB 354 million (approximately $56 million) outstanding under its secured facilities. The interest rate on these facilities is LIBOR plus 0.48% for U.S. dollar borrowings and approximately 90% of the Peoples Bank of China rate for RMB borrowings. As of December 31, 2012, the interest rate was approximately 1% for the U.S. dollar borrowings and approximately 6% for RMB borrowings.
During the year ended December 31, 2012, HPS repaid RMB 309 million (approximately $50 million) under its loan facility for working capital loans and discounting of commercial drafts. As of December 31, 2012, HPS had RMB 190 million (approximately $30 million) outstanding, which is classified as current portion of debt on the accompanying consolidated balance sheets . Interest is calculated using a Peoples Bank of China rate plus the applicable margin. The average all-in rate as of December 31, 2012 was approximately 6%.
On March 30, 2012, we repaid the remaining A$26 million (approximately $27 million) outstanding under our Australian Credit Facility, which represents repayment of A$14 million (approximately $15 million) under the revolving facility and A$12 million (approximately $12 million) under the term loan facility.
Note Payable from Huntsman International to Huntsman Corporation
As of December 31, 2012, there was $695 million outstanding under the Intercompany Note owed by us to Huntsman Corporation. The Intercompany Note is unsecured and $100 million of the outstanding amount is classified as current as of December 31, 2012 on the accompanying consolidated balance sheets. As of December 31, 2012, under the terms of the Intercompany Note, we promise to pay Huntsman Corporation interest on the unpaid principal amount at a rate per annum based on the previous monthly average borrowing rate obtained under our U.S. A/R Program, less 10 basis points (provided that the rate shall not exceed an amount that is 25 basis points less than the monthly average borrowing rate obtained for the U.S. LIBOR-based borrowings under our Revolving Facility).
F-40
HUNTSMAN INTERNATIONAL LLC AND SUBSIDIARIES
NOTES TO CONSOLIDATED FINANCIAL STATEMENTS (Continued)
14. DEBT (Continued)
COMPLIANCE WITH COVENANTS
We believe that we are in compliance with the covenants contained in the agreements governing our material debt instruments, including our Senior Credit Facilities, our A/R Programs and our notes. However, Arabian Amines Company, our consolidated 50%-owned joint venture, is currently not in compliance with certain financial covenants under its loan commitments. See "—Variable Interest Entity Debt" above.
Our material financing arrangements contain certain covenants with which we must comply. A failure to comply with a covenant could result in a default under a financing arrangement unless we obtained an appropriate waiver or forbearance (as to which we can provide no assurance). A default under these material financing arrangements generally allows debt holders the option to declare the underlying debt obligations immediately due and payable. Furthermore, certain of our material financing arrangements contain cross-default and cross-acceleration provisions under which a failure to comply with the covenants in one financing arrangement may result in an event of default under another financing arrangement.
Our Senior Credit Facilities are subject to the Leverage Covenant which applies only to the Revolving Facility. The Leverage Covenant is applicable only if borrowings, letters of credit or guarantees are outstanding under the Revolving Facility (cash collateralized letters of credit or guarantees are not deemed outstanding). The Leverage Covenant is a net senior secured leverage ratio covenant which requires that our ratio of senior secured debt to EBITDA (as defined in the applicable agreement) is not more than 3.75 to 1.
If in the future we fail to comply with the Leverage Covenant, then we may not have access to liquidity under our Revolving Facility. If we fail to comply with the Leverage Covenant at a time when we had uncollateralized loans or letters of credit outstanding under the Revolving Facility, we would be in default under the Senior Credit Facilities, and, unless we obtained a waiver or forbearance with respect to such default (as to which we can provide no assurance), we could be required to pay off the balance of the Senior Credit Facilities in full, and we may not have further access to such facilities.
The agreements governing our A/R Programs also contain certain receivable performance metrics. Any material failure to meet the applicable A/R Programs' metrics in the future could lead to an early termination event under the A/R Programs, which could require us to cease our use of such facilities, prohibiting us from additional borrowings against our receivables or, at the discretion of the lenders, requiring that we repay the A/R Programs in full. An early termination event under the A/R Programs would also constitute an event of default under our Senior Credit Facilities, which could require us to pay off the balance of the Senior Credit Facilities in full and could result in the loss of our Senior Credit Facilities.
F-41
HUNTSMAN INTERNATIONAL LLC AND SUBSIDIARIES
NOTES TO CONSOLIDATED FINANCIAL STATEMENTS (Continued)
14. DEBT (Continued)
MATURITIES
The scheduled maturities of our debt (excluding debt to affiliates) by year as of December 31, 2012 are as follows (dollars in millions):
Year ending December 31 |
|
|||
|---|---|---|---|---|
2013 |
$ | 288 | ||
2014 |
522 | |||
2015 |
32 | |||
2016 |
577 | |||
2017 |
967 | |||
Thereafter |
1,316 | |||
|
$ | 3,702 | ||
15. DERIVATIVE INSTRUMENTS AND HEDGING ACTIVITIES
We are exposed to market risks, such as changes in interest rates, foreign exchange rates and commodity pricing risks. From time to time, we enter into transactions, including transactions involving derivative instruments, to manage certain of these exposures. We also hedge our net investment in certain European operations. Changes in the fair value of the hedge in the net investment of certain European operations are recorded in accumulated other comprehensive loss.
INTEREST RATE RISKS
Through our borrowing activities, we are exposed to interest rate risk. Such risk arises due to the structure of our debt portfolio, including the duration of the portfolio and the mix of fixed and floating interest rates. Actions taken to reduce interest rate risk include managing the mix and rate characteristics of various interest bearing liabilities, as well as entering into interest rate derivative instruments.
From time to time, we may purchase interest rate swaps and/or interest rate collars to reduce the impact of changes in interest rates on our floating-rate long-term debt. Under interest rate swaps, we agree with other parties to exchange, at specified intervals, the difference between fixed-rate and floating-rate interest amounts calculated by reference to an agreed notional principal amount. The collars entitle us to receive from the counterparties (major banks) the amounts, if any, by which our interest payments on certain of our floating-rate borrowings exceed a certain rate, and require us to pay to the counterparties (major banks) the amount, if any, by which our interest payments on certain of our floating-rate borrowings are less than a certain rate.
On December 9, 2009, we entered into a five-year interest rate contract to hedge the variability caused by monthly changes in cash flow due to associated changes in LIBOR under our Senior Credit Facilities. The notional value of the contract is $50 million, and it has been designated as a cash flow hedge. The effective portion of the changes in the fair value of the swap was recorded in other comprehensive loss. We will pay a fixed 2.6% on the hedge and receive the one-month LIBOR rate. As of December 31, 2012 and 2011 the fair value of the hedge was $2 million and $3 million, respectively, and was recorded in other noncurrent liabilities.
F-42
HUNTSMAN INTERNATIONAL LLC AND SUBSIDIARIES
NOTES TO CONSOLIDATED FINANCIAL STATEMENTS (Continued)
15. DERIVATIVE INSTRUMENTS AND HEDGING ACTIVITIES (Continued)
On January 19, 2010, we entered into an additional five-year interest rate contract to hedge the variability caused by monthly changes in cash flow due to associated changes in LIBOR under our Senior Credit Facilities. The notional value of the contract is $50 million, and it has been designated as a cash flow hedge. The effective portion of the changes in the fair value of the swap was recorded as other comprehensive loss. We will pay a fixed 2.8% on the hedge and receive the one-month LIBOR rate. As of December 31, 2012 and 2011, the fair value of the hedge was $3 million and $3 million, respectively, and was recorded in other noncurrent liabilities.
On September 1, 2011, we entered into a $50 million forward interest rate contract that will begin in December 2014 with maturity in April 2017 and a $50 million forward interest rate contract that will begin in January 2015 with maturity in April 2017. These two forward contracts are to hedge the variability caused by monthly changes in cash flow due to associated changes in LIBOR under our Senior Credit Facilities once our existing interest rate hedges mature. These swaps are designated as a cash flow hedges and the effective portion of the changes in the fair value of the swaps were recorded in other comprehensive income. Both interest rate contracts will pay a fixed 2.5% on the hedge and receive the one-month LIBOR rate once the contracts begin in 2014 and 2015, respectively. As of December 31, 2012 and 2011, the combined fair value of these two hedges was $4 million and $1 million, respectively and was recorded in other noncurrent liabilities.
In 2009, Sasol-Huntsman entered into derivative transactions to hedge the variable interest rate associated with its local credit facility. These derivative rate hedges include a floating to fixed interest rate contract providing Sasol-Huntsman with EURIBOR interest payments for a fixed payment of 3.62% and a cap for future periods with a strike price of 3.62%. In connection with the consolidation of Sasol-Huntsman as of April 1, 2011, the interest rate contract is now included in our consolidated results. See "Note 7. Variable Interest Entities." The notional amount of the hedge as of December 31, 2012 was €47 million (approximately $62 million) and the derivative transactions do not qualify for hedge accounting. As of December 31, 2012 and 2011, the fair value of this hedge was €2 million (approximately $3 million) and €3 million (approximately $3 million), respectively, and was recorded in other noncurrent liabilities on the accompanying consolidated balance sheets. For 2012 and 2011, we recorded additional (reduction of) interest expense of less than €(1) million (approximately $(1) million) and € 2 million (approximately $2 million) respectively, due to changes in the fair value of the swap.
Beginning in 2009, Arabian Amines Company entered into a 12-year floating to fixed interest rate contract providing for a receipt of LIBOR interest payments for a fixed payment of 5.02%. In connection with the consolidation of Arabian Amines Company as of July 1, 2010, the interest rate contract is now included in our consolidated results. See "Note 7. Variable Interest Entities." The notional amount of the swap as of December 31, 2012 was $36 million, and the interest rate contract is not designated as a cash flow hedge. As of December 31, 2012 and 2011, the fair value of the swap was $6 million and $6 million, respectively, and was recorded as other noncurrent liabilities on the accompanying consolidated balance sheets. For 2012 and 2011, we recorded additional (reduction of) interest expense of less than $(1) million and $1 million, respectively, due to changes in fair value of the swap. As of December 31, 2012 Arabian Amines Company was not in compliance with certain financial covenants contained in its loan commitments. For more information, see "Note 14. Debt—Direct and Subsidiary Debt—Variable Interest Entity Debt."
F-43
HUNTSMAN INTERNATIONAL LLC AND SUBSIDIARIES
NOTES TO CONSOLIDATED FINANCIAL STATEMENTS (Continued)
15. DERIVATIVE INSTRUMENTS AND HEDGING ACTIVITIES (Continued)
For the years ended December 31, 2012 and 2011, the changes in accumulated other comprehensive loss associated with these cash flow hedging activities was approximately $1 million and $4 million, respectively.
During 2013, accumulated other comprehensive loss of nil is expected to be reclassified to earnings. The actual amount that will be reclassified to earnings over the next twelve months may vary from this amount due to changing market conditions. We would be exposed to credit losses in the event of nonperformance by a counterparty to our derivative financial instruments. We anticipate, however, that the counterparties will be able to fully satisfy their obligations under the contracts. Market risk arises from changes in interest rates.
FOREIGN EXCHANGE RATE RISK
Our cash flows and earnings are subject to fluctuations due to exchange rate variation. Our revenues and expenses are denominated in various currencies. We enter into foreign currency derivative instruments to minimize the short-term impact of movements in foreign currency rates. Where practicable, we generally net multicurrency cash balances among our subsidiaries to help reduce exposure to foreign currency exchange rates. Certain other exposures may be managed from time to time through financial market transactions, principally through the purchase of spot or forward foreign exchange contracts (generally with maturities of three months or less). We do not hedge our currency exposures in a manner that would eliminate the effect of changes in exchange rates on our cash flows and earnings. As of December 31, 2012 and 2011, we had approximately $217 million and $263 million notional amount (in U.S. dollar equivalents) outstanding, respectively, in foreign currency contracts with a term of approximately one month.
In conjunction with the issuance of our 8.625% senior subordinated notes due 2020, we entered into cross-currency interest rate contracts with three counterparties. On March 17, 2010, we made payments of $350 million to these counterparties and received €255 million from these counterparties, and on maturity (March 15, 2015) we are required to pay €255 million to these counterparties and will receive $350 million from these counterparties. On March 15 and September 15 of each year, we will receive U.S. dollar interest payments of approximately $15 million (equivalent to an annual rate of 8.625%) and make interest payments of approximately €11 million (equivalent to an annual rate of approximately 8.41%). This swap is designated as a hedge of net investment for financial reporting purposes. As of December 31, 2012 and 2011, the fair value of this swap was $18 million and $27 million, respectively, and was recorded in noncurrent assets.
A portion of our debt is denominated in euros. We also finance certain of our non-U.S. subsidiaries with intercompany loans that are, in many cases, denominated in currencies other than the entities' functional currency. We manage the net foreign currency exposure created by this debt through various means, including cross-currency swaps, the designation of certain intercompany loans as permanent loans because they are not expected to be repaid in the foreseeable future and the designation of certain debt and swaps as net investment hedges.
Foreign currency transaction gains and losses on intercompany loans that are not designated as permanent loans are recorded in earnings. Foreign currency transaction gains and losses on intercompany loans that are designated as permanent loans are recorded in other comprehensive income. From time to time, we review such designation of intercompany loans.
F-44
HUNTSMAN INTERNATIONAL LLC AND SUBSIDIARIES
NOTES TO CONSOLIDATED FINANCIAL STATEMENTS (Continued)
15. DERIVATIVE INSTRUMENTS AND HEDGING ACTIVITIES (Continued)
We review our non-U.S. dollar denominated debt and derivative instruments to determine the appropriate amounts designated as hedges. As of December 31, 2012, we have designated approximately €255 million (approximately $336 million) of euro-denominated debt and cross-currency interest rate contracts as a hedge of our net investment. For the years ended December 31, 2012, 2011 and 2010, the amount of gain (loss) recognized on the hedge of our net investment was $(11) million, $5 million and $34 million, respectively, and was recorded in other comprehensive (loss) income. As of December 31, 2012, we had approximately €1,083 million (approximately $1,431 million) in net euro assets.
COMMODITY PRICES RISK
Our exposure to changing commodity prices is somewhat limited since the majority of our raw materials are acquired at posted or market related prices, and sales prices for many of our finished products are at market related prices which are largely set on a monthly or quarterly basis in line with industry practice. Consequently, we do not generally hedge our commodity exposures.
16. FAIR VALUE
The fair values of our financial instruments were as follows (dollars in millions):
| |
December 31, | ||||||||||||
|---|---|---|---|---|---|---|---|---|---|---|---|---|---|
| |
2012 | 2011 | |||||||||||
| |
Carrying Value |
Estimated Fair Value |
Carrying Value |
Estimated Fair Value |
|||||||||
Non-qualified employee benefit plan investments |
$ | 14 | $ | 14 | $ | 12 | $ | 12 | |||||
Cross-currency interest rate contacts |
18 | 18 | 27 | 27 | |||||||||
Interest rate contracts |
(18 | ) | (18 | ) | (17 | ) | (17 | ) | |||||
Long-term debt (including current portion) |
(3,702 | ) | (3,869 | ) | (3,942 | ) | (4,061 | ) | |||||
The carrying amounts reported in the balance sheets of cash and cash equivalents, accounts receivable and accounts payable approximate fair value because of the immediate or short-term maturity of these financial instruments. The fair value of non-qualified employee benefit plan investments is obtained through market observable pricing using prevailing market prices. The estimated fair values of our long-term debt are based on quoted market prices for the identical liability when traded as an asset in an active market (Level 1).
The fair value estimates presented herein are based on pertinent information available to management as of December 31, 2012 and 2011. Although management is not aware of any factors that would significantly affect the estimated fair value amounts, such amounts have not been comprehensively revalued for purposes of these financial statements since December 31, 2012, and current estimates of fair value may differ significantly from the amounts presented herein.
F-45
HUNTSMAN INTERNATIONAL LLC AND SUBSIDIARIES
NOTES TO CONSOLIDATED FINANCIAL STATEMENTS (Continued)
16. FAIR VALUE (Continued)
The following assets and liabilities are measured at fair value on a recurring basis (dollars in millions):
| |
|
Fair Value Amounts Using | |||||||||||
|---|---|---|---|---|---|---|---|---|---|---|---|---|---|
Description
|
December 31, 2012 |
Quoted prices in active markets for identical assets (Level 1)(3) |
Significant other observable inputs (Level 2)(3) |
Significant unobservable inputs (Level 3) |
|||||||||
Assets: |
|||||||||||||
Available-for sale equity securities: |
|||||||||||||
Equity mutual funds |
$ | 14 | $ | 14 | $ | — | $ | — | |||||
Derivatives: |
|||||||||||||
Cross-currency interest rate contracts(1) |
18 | — | 18 | — | |||||||||
Total assets |
$ | 32 | $ | 14 | $ | 18 | $ | — | |||||
Liabilities: |
|||||||||||||
Derivatives: |
|||||||||||||
Interest rate contracts(2) |
$ | (18 | ) | $ | — | $ | (18 | ) | $ | — | |||
| |
|
Fair Value Amounts Using | |||||||||||
|---|---|---|---|---|---|---|---|---|---|---|---|---|---|
Description
|
December 31, 2011 |
Quoted prices in active markets for identical assets (Level 1)(3) |
Significant other observable inputs (Level 2)(3) |
Significant unobservable inputs (Level 3) |
|||||||||
Assets: |
|||||||||||||
Available-for sale equity securities: |
|||||||||||||
Equity mutual funds |
$ | 12 | $ | 12 | $ | — | $ | — | |||||
Derivatives: |
|||||||||||||
Cross-currency interest rate contracts(1) |
27 | — | — | 27 | |||||||||
Total assets |
$ | 39 | $ | 12 | $ | — | $ | 27 | |||||
Liabilities: |
|||||||||||||
Derivatives: |
|||||||||||||
Interest rate contracts(2) |
$ | (17 | ) | $ | — | $ | (17 | ) | $ | — | |||
F-46
HUNTSMAN INTERNATIONAL LLC AND SUBSIDIARIES
NOTES TO CONSOLIDATED FINANCIAL STATEMENTS (Continued)
16. FAIR VALUE (Continued)
During the year ended December 31, 2012, no material changes were made to the valuation methods or assumptions used to determine fair value.
The following table shows a reconciliation of beginning and ending balances for instruments measured at fair value on a recurring basis using significant unobservable inputs (Level 3) (dollars in millions):
Fair Value Measurements Using Significant Unobservable Inputs (Level 3)
|
Cross-Currency Interest Rate Contracts |
|||
|---|---|---|---|---|
Beginning balance, January 1, 2012 |
$ | 27 | ||
Transfers into Level 3 |
— | |||
Transfers out of Level 3(1) |
(27 | ) | ||
Total gains (losses): |
||||
Included in earnings |
— | |||
Included in other comprehensive income (loss) |
— | |||
Purchases, sales, issuances and settlements |
— | |||
Ending balance, December 31, 2012 |
$ | — | ||
The amount of total gains (losses) for the period included in earnings attributable to the change in unrealized gains (losses) relating to assets still held at December 31, 2012 |
$ | — | ||
Fair Value Measurements Using Significant Unobservable Inputs (Level 3)
|
Cross-Currency Interest Rate Contracts |
|||
|---|---|---|---|---|
Beginning balance, January 1, 2011 |
$ | 19 | ||
Transfers into or out of Level 3 |
— | |||
Total gains (losses): |
||||
Included in earnings |
— | |||
Included in other comprehensive income (loss) |
8 | |||
Purchases, sales, issuances and settlements |
— | |||
Ending balance, December 31, 2011 |
$ | 27 | ||
The amount of total gains (losses) for the period included in earnings attributable to the change in unrealized gains (losses) relating to assets still held at December 31, 2011 |
$ | — | ||
F-47
HUNTSMAN INTERNATIONAL LLC AND SUBSIDIARIES
NOTES TO CONSOLIDATED FINANCIAL STATEMENTS (Continued)
16. FAIR VALUE (Continued)
Our policy is to recognize transfers between levels within the fair value hierarchy as of the beginning of the reporting period. Due to the change in significance of the credit valuation adjustment to the entire fair value measurement of these instruments, effective January 1, 2012, we have categorized our cross-currency interest rate contracts as Level 2 within the fair value hierarchy.
Gains and losses (realized and unrealized) included in earnings for instruments measured at fair value on a recurring basis using significant unobservable inputs (Level 3) are reported in interest expense and other comprehensive income (loss) as follows (dollars in millions):
| |
Interest expense | Other comprehensive income (loss) |
|||||
|---|---|---|---|---|---|---|---|
2012 |
|||||||
Total net gains included in earnings |
$ | — | $ | — | |||
Changes in unrealized gains relating to assets still held at December 31, 2012 |
— | — | |||||
| |
Interest expense | Other comprehensive income (loss) |
|||||
|---|---|---|---|---|---|---|---|
2011 |
|||||||
Total net gains included in earnings |
$ | — | $ | — | |||
Changes in unrealized gains relating to assets still held at December 31, 2011 |
— | 8 | |||||
We also have assets that under certain conditions are subject to measurement at fair value on a non-recurring basis. These assets include property, plant and equipment and those associated with acquired businesses, including goodwill and intangible assets. For these assets, measurement at fair value in periods subsequent to their initial recognition is applicable if one or more is determined to be impaired. During 2012, we had no impairments related to these assets. During 2011, in connection with the restructuring of our Textile Effects segment we recorded a charge of $53 million for the impairment of long-lived assets at our Basel, Switzerland manufacturing facility.
17. EMPLOYEE BENEFIT PLANS
DEFINED BENEFIT AND OTHER POSTRETIREMENT BENEFIT PLANS
Our employees participate in a trusteed, non-contributory defined benefit pension plan (the "Plan") that covers substantially all of our full-time U.S. employees. Effective July 1, 2004, the Plan formula for employees not covered by a collective bargaining agreement was converted to a cash balance design. For represented employees, participation in the cash balance design is subject to the terms of negotiated contracts. For participating employees, benefits accrued under the prior formula were converted to opening cash balance accounts. The new cash balance benefit formula provides annual pay credits from 4% to 12% of eligible pay, depending on age and service, plus accrued interest. Participants in the plan on July 1, 2004 may be eligible for additional annual pay credits from 1% to 8%, depending on their age and service as of that date, for up to five years. The conversion to the cash balance plan did not have a significant impact on the accrued benefit liability, the funded status or ongoing pension expense.
F-48
HUNTSMAN INTERNATIONAL LLC AND SUBSIDIARIES
NOTES TO CONSOLIDATED FINANCIAL STATEMENTS (Continued)
17. EMPLOYEE BENEFIT PLANS (Continued)
We sponsor defined benefit plans in a number of countries outside of the U.S. The availability of these plans, and their specific design provisions, are consistent with local competitive practices and regulations.
We also sponsor unfunded postretirement benefit plans other than pensions, which provide medical and life insurance benefits.
Our postretirement benefit plans provide a fully insured Medicare Part D plan including prescription drug benefits affected by the Medicare Prescription Drug, Improvement and Modernization Act of 2003 (the "Act"). We cannot determine whether the medical benefits provided by our postretirement benefit plans are actuarially equivalent to those provided by the Act. We do not collect a subsidy and our net periodic postretirement benefits cost, and related benefit obligation, do not reflect an amount associated with the subsidy.
On March 23, 2010, President Obama signed into law the Patient Protection and Affordable Care Act. On March 30, 2010, President Obama signed into law a reconciliation measure, the Health Care and Education Reconciliation Act of 2010. The passage of this legislation has resulted in comprehensive reform of health care in the U.S. We do not believe that this will have a significant impact on our financial position.
F-49
HUNTSMAN INTERNATIONAL LLC AND SUBSIDIARIES
NOTES TO CONSOLIDATED FINANCIAL STATEMENTS (Continued)
17. EMPLOYEE BENEFIT PLANS (Continued)
The following table sets forth the funded status of the plans for us and the amounts recognized in the consolidated balance sheets at December 31, 2012 and 2011 (dollars in millions):
| |
Defined Benefit Plans | Other Postretirement Benefit Plans | |||||||||||||||||||||||
|---|---|---|---|---|---|---|---|---|---|---|---|---|---|---|---|---|---|---|---|---|---|---|---|---|---|
| |
2012 | 2011 | 2012 | 2011 | |||||||||||||||||||||
| |
U.S. Plans |
Non-U.S. Plans |
U.S. Plans |
Non-U.S. Plans |
U.S. Plans |
Non-U.S. Plans |
U.S. Plans |
Non-U.S. Plans |
|||||||||||||||||
Change in benefit obligation |
|||||||||||||||||||||||||
Benefit obligation at beginning of year |
$ | 834 | $ | 2,331 | $ | 761 | $ | 2,255 | $ | 128 | $ | 7 | $ | 129 | $ | 7 | |||||||||
Service cost |
26 | 32 | 23 | 44 | 4 | — | 3 | — | |||||||||||||||||
Interest cost |
42 | 102 | 44 | 110 | 6 | — | 7 | 1 | |||||||||||||||||
Participant contributions |
— | 9 | — | 14 | 5 | — | 5 | — | |||||||||||||||||
Plan amendments |
(26 | ) | — | — | (1 | ) | — | — | — | — | |||||||||||||||
Foreign currency exchange rate changes |
— | 80 | — | (13 | ) | — | — | — | (1 | ) | |||||||||||||||
Settlements/transfers |
— | (2 | ) | — | (20 | ) | — | — | — | — | |||||||||||||||
Curtailments |
— | — | — | (38 | ) | — | — | — | — | ||||||||||||||||
Special termination benefits |
— | — | — | 8 | — | — | — | — | |||||||||||||||||
Actuarial loss |
127 | 360 | 47 | 83 | 9 | — | 1 | — | |||||||||||||||||
Benefits paid |
(45 | ) | (157 | ) | (41 | ) | (111 | ) | (16 | ) | — | (17 | ) | (1 | ) | ||||||||||
Benefit obligation at end of year |
$ | 958 | $ | 2,755 | $ | 834 | $ | 2,331 | $ | 136 | $ | 7 | $ | 128 | $ | 6 | |||||||||
Change in plan assets |
|||||||||||||||||||||||||
Fair value of plan assets at beginning of year |
$ | 538 | $ | 2,026 | $ | 517 | $ | 2,025 | $ | — | $ | — | $ | — | $ | — | |||||||||
Actual return on plan assets |
71 | 221 | (7 | ) | 43 | — | — | — | — | ||||||||||||||||
Foreign currency exchange rate changes |
— | 65 | — | (10 | ) | — | — | — | — | ||||||||||||||||
Participant contributions |
— | 9 | — | 14 | 5 | — | 5 | — | |||||||||||||||||
Other |
— | — | — | (1 | ) | — | — | — | — | ||||||||||||||||
Company contributions |
72 | 75 | 69 | 86 | 11 | 1 | 12 | 1 | |||||||||||||||||
Settlements/transfers |
— | (2 | ) | — | (20 | ) | — | — | — | — | |||||||||||||||
Benefits paid |
(45 | ) | (157 | ) | (41 | ) | (111 | ) | (16 | ) | (1 | ) | (17 | ) | (1 | ) | |||||||||
Fair value of plan assets at end of year |
$ | 636 | $ | 2,237 | $ | 538 | $ | 2,026 | $ | — | $ | — | $ | — | $ | — | |||||||||
Funded status |
|||||||||||||||||||||||||
Fair value of plan assets |
$ | 636 | $ | 2,237 | $ | 538 | $ | 2,026 | $ | — | $ | — | $ | — | $ | — | |||||||||
Benefit obligation |
958 | 2,755 | 834 | 2,331 | 136 | 7 | 128 | 6 | |||||||||||||||||
Accrued benefit cost |
$ | (322 | ) | $ | (518 | ) | $ | (296 | ) | $ | (305 | ) | $ | (136 | ) | $ | (7 | ) | $ | (128 | ) | $ | (6 | ) | |
Amounts recognized in balance sheet: |
|||||||||||||||||||||||||
Noncurrent asset |
$ | — | $ | 1 | $ | — | $ | 100 | $ | — | $ | — | $ | — | $ | — | |||||||||
Current liability |
(6 | ) | (5 | ) | (6 | ) | (6 | ) | (11 | ) | (1 | ) | (12 | ) | — | ||||||||||
Noncurrent liability |
(316 | ) | (514 | ) | (290 | ) | (399 | ) | (125 | ) | (6 | ) | (116 | ) | (6 | ) | |||||||||
|
$ | (322 | ) | $ | (518 | ) | $ | (296 | ) | $ | (305 | ) | $ | (136 | ) | $ | (7 | ) | $ | (128 | ) | $ | (6 | ) | |
F-50
HUNTSMAN INTERNATIONAL LLC AND SUBSIDIARIES
NOTES TO CONSOLIDATED FINANCIAL STATEMENTS (Continued)
17. EMPLOYEE BENEFIT PLANS (Continued)
| |
Defined Benefit Plans | Other Postretirement Benefit Plans |
|||||||||||||||||||||||
|---|---|---|---|---|---|---|---|---|---|---|---|---|---|---|---|---|---|---|---|---|---|---|---|---|---|
| |
2012 | 2011 | 2012 | 2011 | |||||||||||||||||||||
| |
U.S. Plans |
Non-U.S. Plans |
U.S. Plans |
Non-U.S. Plans |
U.S. Plans |
Non-U.S. Plans |
U.S. Plans |
Non-U.S. Plans |
|||||||||||||||||
Amounts recognized in accumulated other comprehensive loss: |
|||||||||||||||||||||||||
Net actuarial loss |
$ | 449 | $ | 867 | $ | 368 | $ | 636 | $ | 32 | $ | 1 | $ | 25 | $ | 1 | |||||||||
Prior service cost |
(42 | ) | 4 | (22 | ) | 2 | (8 | ) | — | (10 | ) | — | |||||||||||||
Transition obligation |
1 | — | 1 | — | — | — | — | — | |||||||||||||||||
|
$ | 408 | $ | 871 | $ | 347 | $ | 638 | $ | 24 | $ | 1 | $ | 15 | $ | 1 | |||||||||
The amounts in accumulated other comprehensive loss that are expected to be recognized as components of net periodic benefit cost during the next fiscal year are as follows (dollars in millions):
| |
Defined Benefit Plans | Other Postretirement Benefit Plans |
|||||||||||
|---|---|---|---|---|---|---|---|---|---|---|---|---|---|
| |
U.S. Plans | Non-U.S. Plans |
U.S. Plans | Non-U.S. Plans |
|||||||||
Actuarial loss |
$ | 34 | $ | 50 | $ | 2 | $ | — | |||||
Prior service cost |
(6 | ) | 1 | (3 | ) | — | |||||||
Total |
$ | 28 | $ | 51 | $ | (1 | ) | $ | — | ||||
Components of net periodic benefit costs for the years ended December 31, 2012, 2011 and 2010 were as follows (dollars in millions):
| |
Defined Benefit Plans | ||||||||||||||||||
|---|---|---|---|---|---|---|---|---|---|---|---|---|---|---|---|---|---|---|---|
| |
U.S. plans | Non-U.S. plans | |||||||||||||||||
| |
2012 | 2011 | 2010 | 2012 | 2011 | 2010 | |||||||||||||
Service cost |
$ | 26 | $ | 23 | $ | 21 | $ | 32 | $ | 44 | $ | 44 | |||||||
Interest cost |
42 | 44 | 40 | 102 | 110 | 102 | |||||||||||||
Expected return on plan assets |
(48 | ) | (47 | ) | (42 | ) | (133 | ) | (140 | ) | (121 | ) | |||||||
Amortization of prior service cost |
(6 | ) | (4 | ) | (5 | ) | (1 | ) | (2 | ) | (1 | ) | |||||||
Amortization of actuarial loss |
21 | 16 | 11 | 28 | 21 | 19 | |||||||||||||
Settlement loss |
— | — | — | 13 | — | — | |||||||||||||
Special termination benefits |
— | — | — | 8 | — | ||||||||||||||
Net periodic benefit cost |
$ | 35 | $ | 32 | $ | 25 | $ | 41 | $ | 41 | $ | 43 | |||||||
F-51
HUNTSMAN INTERNATIONAL LLC AND SUBSIDIARIES
NOTES TO CONSOLIDATED FINANCIAL STATEMENTS (Continued)
17. EMPLOYEE BENEFIT PLANS (Continued)
| |
Other Postretirement Benefit Plans | ||||||||||||||||||
|---|---|---|---|---|---|---|---|---|---|---|---|---|---|---|---|---|---|---|---|
| |
U.S. plans | Non-U.S. plans | |||||||||||||||||
| |
2012 | 2011 | 2010 | 2012 | 2011 | 2010 | |||||||||||||
Service cost |
$ | 4 | $ | 3 | $ | 3 | $ | — | $ | — | $ | — | |||||||
Interest cost |
7 | 7 | 7 | 1 | 1 | — | |||||||||||||
Amortization of prior service cost |
(3 | ) | (3 | ) | (3 | ) | — | — | — | ||||||||||
Amortization of actuarial loss |
2 | 2 | 1 | — | — | — | |||||||||||||
Net periodic benefit cost |
$ | 10 | $ | 9 | $ | 8 | $ | 1 | $ | 1 | $ | — | |||||||
The amounts recognized in net periodic benefit cost and other comprehensive loss as of December 31, 2012, 2011 and 2010 were as follows (dollars in millions):
| |
Defined Benefit Plans | ||||||||||||||||||
|---|---|---|---|---|---|---|---|---|---|---|---|---|---|---|---|---|---|---|---|
| |
U.S. plans | Non-U.S. plans | |||||||||||||||||
| |
2012 | 2011 | 2010 | 2012 | 2011 | 2010 | |||||||||||||
Current year actuarial loss |
$ | 103 | $ | 101 | $ | 16 | $ | 272 | $ | 182 | $ | 20 | |||||||
Amortization of actuarial gain |
(21 | ) | (16 | ) | (11 | ) | (28 | ) | (21 | ) | (19 | ) | |||||||
Current year prior service cost |
(26 | ) | — | — | — | (2 | ) | — | |||||||||||
Amortization of prior service cost |
6 | 4 | 4 | 1 | 2 | 1 | |||||||||||||
Curtailment effects |
— | — | — | — | (38 | ) | — | ||||||||||||
Settlements |
— | — | — | (13 | ) | — | — | ||||||||||||
Total recognized in other comprehensive loss |
62 | 89 | 9 | 232 | 123 | 2 | |||||||||||||
Net periodic benefit cost |
35 | 32 | 25 | 41 | 41 | 43 | |||||||||||||
Total recognized in net periodic benefit cost and other comprehensive loss |
$ | 97 | $ | 121 | $ | 34 | $ | 273 | $ | 164 | $ | 45 | |||||||
| |
Other Postretirement Benefit Plans | ||||||||||||||||||
|---|---|---|---|---|---|---|---|---|---|---|---|---|---|---|---|---|---|---|---|
| |
U.S. plans | Non-U.S. plans | |||||||||||||||||
| |
2012 | 2011 | 2010 | 2012 | 2011 | 2010 | |||||||||||||
Current year actuarial loss |
$ | 9 | $ | 1 | $ | 5 | $ | — | $ | — | $ | — | |||||||
Amortization of actuarial gain |
(2 | ) | (1 | ) | (2 | ) | — | — | — | ||||||||||
Amortization of prior service cost |
3 | 2 | 3 | — | — | — | |||||||||||||
Total recognized in other comprehensive loss |
10 | 2 | 6 | — | — | — | |||||||||||||
Net periodic benefit cost |
10 | 9 | 8 | 1 | 1 | — | |||||||||||||
Total recognized in net periodic benefit cost and other comprehensive loss |
$ | 20 | $ | 11 | $ | 14 | $ | 1 | $ | 1 | $ | — | |||||||
F-52
HUNTSMAN INTERNATIONAL LLC AND SUBSIDIARIES
NOTES TO CONSOLIDATED FINANCIAL STATEMENTS (Continued)
17. EMPLOYEE BENEFIT PLANS (Continued)
The following weighted-average assumptions were used to determine the projected benefit obligation at the measurement date and the net periodic pension cost for the year:
| |
Defined Benefit Plans | ||||||||||||||||||
|---|---|---|---|---|---|---|---|---|---|---|---|---|---|---|---|---|---|---|---|
| |
U.S. plans | Non U.S. plans | |||||||||||||||||
| |
2012 | 2011 | 2010 | 2012 | 2011 | 2010 | |||||||||||||
Projected benefit obligation |
|||||||||||||||||||
Discount rate |
4.18 | % | 5.30 | % | 5.70 | % | 3.38 | % | 4.39 | % | 4.69 | % | |||||||
Rate of compensation increase |
4.19 | % | 3.88 | % | 3.88 | % | 3.34 | % | 3.44 | % | 3.38 | % | |||||||
Net periodic pension cost |
|||||||||||||||||||
Discount rate |
5.30 | % | 5.70 | % | 5.90 | % | 4.39 | % | 4.69 | % | 4.94 | % | |||||||
Rate of compensation increase |
3.88 | % | 3.88 | % | 3.88 | % | 3.44 | % | 3.38 | % | 3.23 | % | |||||||
Expected return on plan assets |
8.00 | % | 8.19 | % | 8.20 | % | 6.52 | % | 6.62 | % | 6.65 | % | |||||||
| |
Other Postretirement Benefit Plans | ||||||||||||||||||
|---|---|---|---|---|---|---|---|---|---|---|---|---|---|---|---|---|---|---|---|
| |
U.S. plans | Non U.S. plans | |||||||||||||||||
| |
2012 | 2011 | 2010 | 2012 | 2011 | 2010 | |||||||||||||
Projected benefit obligation |
|||||||||||||||||||
Discount rate |
3.89 | % | 5.09 | % | 5.46 | % | 5.79 | % | 6.09 | % | 6.69 | % | |||||||
Net periodic pension cost |
|||||||||||||||||||
Discount rate |
5.09 | % | 5.46 | % | 5.59 | % | 6.09 | % | 6.69 | % | 7.47 | % | |||||||
In both 2012 and 2011, the health care trend rate used to measure the expected increase in the cost of benefits was assumed to be 7.5% decreasing to 5% after 2017. Assumed health care cost trend rates can have a significant effect on the amounts reported for the postretirement benefit plans. A one-percent point change in assumed health care cost trend rates would have the following effects (dollars in millions):
| |
Increase | Decrease | |||||
|---|---|---|---|---|---|---|---|
Asset category |
|||||||
Effect on total of service and interest cost |
$ | — | $ | — | |||
Effect on postretirement benefit obligation |
3.6 | (3.1 | ) | ||||
The projected benefit obligation and fair value of plan assets for the defined benefit plans with projected benefit obligations in excess of plan assets as of December 31, 2012 and 2011 were as follows (dollars in millions):
| |
U.S. plans | Non-U.S. plans | |||||||||||
|---|---|---|---|---|---|---|---|---|---|---|---|---|---|
| |
2012 | 2011 | 2012 | 2011 | |||||||||
Projected benefit obligation in excess of plan assets |
|||||||||||||
Projected benefit obligation |
$ | 958 | $ | 834 | $ | 2,742 | $ | 1,897 | |||||
Fair value of plan assets |
636 | 538 | 2,223 | 1,492 | |||||||||
F-53
HUNTSMAN INTERNATIONAL LLC AND SUBSIDIARIES
NOTES TO CONSOLIDATED FINANCIAL STATEMENTS (Continued)
17. EMPLOYEE BENEFIT PLANS (Continued)
The projected benefit obligation, accumulated benefit obligation and fair value of plan assets for the defined benefit plans with an accumulated benefit obligation in excess of plan assets as of December 31, 2012 and 2011 were as follows (dollars in millions):
| |
U.S. plans | Non-U.S. plans | |||||||||||
|---|---|---|---|---|---|---|---|---|---|---|---|---|---|
| |
2012 | 2011 | 2012 | 2011 | |||||||||
Accumulated benefit obligation in excess of plan assets |
|||||||||||||
Projected benefit obligation |
$ | 958 | $ | 834 | $ | 1,751 | $ | 1,618 | |||||
Accumulated benefit obligation |
925 | 789 | 1,603 | 1,500 | |||||||||
Fair value of plan assets |
636 | 538 | 1,266 | 1,251 | |||||||||
Expected future contributions and benefit payments are as follows (dollars in millions):
| |
U.S. Plans | Non-U.S. Plans | |||||||||||
|---|---|---|---|---|---|---|---|---|---|---|---|---|---|
| |
Defined Benefit Plans |
Other Postretirement Benefit Plans |
Defined Benefit Plans |
Other Postretirement Benefit Plans |
|||||||||
2013 expected employer contributions |
|||||||||||||
To plan trusts |
$ | 73 | $ | 11 | $ | 81 | $ | 1 | |||||
Expected benefit payments |
|||||||||||||
2013 |
58 | 11 | 175 | 1 | |||||||||
2014 |
54 | 11 | 98 | 1 | |||||||||
2015 |
53 | 11 | 103 | 1 | |||||||||
2016 |
55 | 11 | 105 | 1 | |||||||||
2017 |
59 | 11 | 107 | 1 | |||||||||
2018 - 2022 |
325 | 49 | 578 | 2 | |||||||||
Our investment strategy with respect to pension assets is to pursue an investment plan that, over the long term, is expected to protect the funded status of the plan, enhance the real purchasing power of plan assets, and not threaten the plan's ability to meet currently committed obligations. Additionally, our investment strategy is to achieve returns on plan assets, subject to a prudent level of portfolio risk. Plan assets are invested in a broad range of investments. These investments are diversified in terms of domestic and international equities, both growth and value funds, including small, mid and large capitalization equities; short-term and long-term debt securities; real estate; and cash and cash equivalents. The investments are further diversified within each asset category. The portfolio diversification provides protection against a single investment or asset category having a disproportionate impact on the aggregate performance of the plan assets.
Our pension plan assets are managed by outside investment managers. The investment managers value our plan assets using quoted market prices, other observable inputs or unobservable inputs. For certain assets, the investment managers obtain third-party appraisals at least annually, which use valuation techniques and inputs specific to the applicable property, market, or geographic location. During 2012, there was a net transfer out of Level 3 assets of $7 million due to a change in the significance of unobservable inputs for several investments, which are immaterial both individually and in the aggregate. These assets are all contained within the real estate/other category.
F-54
HUNTSMAN INTERNATIONAL LLC AND SUBSIDIARIES
NOTES TO CONSOLIDATED FINANCIAL STATEMENTS (Continued)
17. EMPLOYEE BENEFIT PLANS (Continued)
We have established target allocations for each asset category. Our pension plan assets are periodically rebalanced based upon our target allocations.
The fair value of plan assets for the pension plans was $2.9 billion and $2.6 billion at December 31, 2012 and 2011, respectively. The following plan assets are measured at fair value on a recurring basis (dollars in millions):
| |
|
Fair Value Amounts Using | |||||||||||
|---|---|---|---|---|---|---|---|---|---|---|---|---|---|
Asset category
|
December 31, 2012 |
Quoted prices in active markets for identical assets (Level 1) |
Significant other observable inputs (Level 2) |
Significant unobservable inputs (Level 3) |
|||||||||
U.S. pension plans: |
|||||||||||||
Equities |
$ | 340 | $ | 195 | $ | 145 | $ | — | |||||
Fixed income |
196 | 116 | 80 | — | |||||||||
Real estate/other |
89 | 48 | — | 41 | |||||||||
Cash |
11 | 11 | — | — | |||||||||
Total U.S. pension plan assets |
$ | 636 | $ | 370 | $ | 225 | $ | 41 | |||||
Non-U.S. pension plans: |
|||||||||||||
Equities |
$ | 862 | $ | 649 | $ | 213 | $ | — | |||||
Fixed income |
905 | 632 | 273 | — | |||||||||
Real estate/other |
357 | 27 | 303 | 27 | |||||||||
Cash |
113 | 112 | 1 | — | |||||||||
Total non-U.S. pension plan assets |
$ | 2,237 | $ | 1,420 | $ | 790 | $ | 27 | |||||
| |
|
Fair Value Amounts Using | |||||||||||
|---|---|---|---|---|---|---|---|---|---|---|---|---|---|
Asset category
|
December 31, 2011 |
Quoted prices in active markets for identical assets (Level 1) |
Significant other observable inputs (Level 2) |
Significant unobservable inputs (Level 3) |
|||||||||
U.S. pension plans: |
|||||||||||||
Equities |
$ | 294 | $ | 166 | $ | 128 | $ | — | |||||
Fixed income |
170 | 106 | 64 | — | |||||||||
Real estate/other |
72 | 45 | — | 27 | |||||||||
Cash |
2 | 2 | — | — | |||||||||
Total U.S. pension plan assets |
$ | 538 | $ | 319 | $ | 192 | $ | 27 | |||||
Non-U.S. pension plans: |
|||||||||||||
Equities |
$ | 771 | $ | 361 | $ | 410 | $ | — | |||||
Fixed income |
923 | 304 | 619 | — | |||||||||
Real estate/other |
316 | 1 | 281 | 34 | |||||||||
Cash |
16 | 16 | — | — | |||||||||
Total non-U.S. pension plan assets |
$ | 2,026 | $ | 682 | $ | 1,310 | $ | 34 | |||||
F-55
HUNTSMAN INTERNATIONAL LLC AND SUBSIDIARIES
NOTES TO CONSOLIDATED FINANCIAL STATEMENTS (Continued)
17. EMPLOYEE BENEFIT PLANS (Continued)
The following table reconciles the beginning and ending balances of plan assets measured at fair value using unobservable inputs (Level 3) (dollars in millions):
| |
Real Estate/Other | ||||||
|---|---|---|---|---|---|---|---|
Fair Value Measurements of Plan Assets Using Significant Unobservable Inputs (Level 3) |
Year ended December 31, 2012 |
Year ended December 31, 2011 |
|||||
Balance at beginning of period |
$ | 61 | $ | 52 | |||
Return on pension plan assets |
4 | (1 | ) | ||||
Purchases, sales and settlements |
10 | 10 | |||||
Transfers in (out) of Level 3 |
(7 | ) | — | ||||
Balance at end of period |
$ | 68 | $ | 61 | |||
| |
Fixed Income | ||||||
|---|---|---|---|---|---|---|---|
Fair Value Measurements of Plan Assets Using Significant Unobservable Inputs (Level 3) |
Year ended December 31, 2012 |
Year ended December 31, 2011 |
|||||
Balance at beginning of period |
$ | — | $ | 1 | |||
Purchases, sales and settlements |
— | (1 | ) | ||||
Balance at end of period |
$ | — | $ | — | |||
Based upon historical returns, the expectations of our investment committee and outside advisors, the expected long-term rate of return on the pension assets is estimated to be between 6.52% and 8.20%. The asset allocation for our pension plans at December 31, 2012 and 2011 and the target allocation for 2013, by asset category are as follows:
Asset category
|
Target Allocation 2013 |
Allocation at December 31, 2012 |
Allocation at December 31, 2011 |
|||||||
|---|---|---|---|---|---|---|---|---|---|---|
U.S. pension plans: |
||||||||||
Equities |
54 | % | 53 | % | 55 | % | ||||
Fixed income |
32 | % | 31 | % | 32 | % | ||||
Real estate/other |
14 | % | 14 | % | 13 | % | ||||
Cash |
— | 2 | % | — | ||||||
Total U.S. pension plans |
100 | % | 100 | % | 100 | % | ||||
Non-U.S. pension plans: |
||||||||||
Equities |
40 | % | 38 | % | 38 | % | ||||
Fixed income |
40 | % | 41 | % | 46 | % | ||||
Real estate/other |
19 | % | 20 | % | 15 | % | ||||
Cash |
1 | % | 1 | % | 1 | % | ||||
Total non-U.S. pension plans |
100 | % | 100 | % | 100 | % | ||||
Equity securities in our pension plans did not include any equity securities of our Company or our affiliates at the end of 2012.
F-56
HUNTSMAN INTERNATIONAL LLC AND SUBSIDIARIES
NOTES TO CONSOLIDATED FINANCIAL STATEMENTS (Continued)
17. EMPLOYEE BENEFIT PLANS (Continued)
DEFINED CONTRIBUTION PLANS
We have a money purchase pension plan covering substantially all of our domestic employees who were hired prior to January 1, 2004. Employer contributions are made based on a percentage of employees' earnings (ranging up to 8%).
We also have a salary deferral plan covering substantially all U.S. employees. Plan participants may elect to make voluntary contributions to this plan up to a specified amount of their compensation. We contribute an amount equal to one-half of the participant's contribution, not to exceed 2% of the participant's compensation.
Along with the introduction of the cash balance formula within our defined benefit pension plan, the money purchase pension plan was closed to new hires. At the same time, our match in the salary deferral plan was increased, for new hires, to a 100% match, not to exceed 4% of the participant's compensation, once the participant has achieved six years of service with our Company.
Our total combined expense for the above defined contribution plans for each of the years ended December 31, 2012, 2011 and 2010 was $14 million.
SUPPLEMENTAL SALARY DEFERRAL PLAN AND SUPPLEMENTAL EXECUTIVE RETIREMENT PLAN
The Huntsman Supplemental Savings Plan ("Huntsman SSP") is a non-qualified plan covering key management employees and allows participants to defer amounts that would otherwise be paid as compensation. The participant can defer up to 75% of their salary and bonus each year. This plan also provides benefits that would be provided under the Huntsman Salary Deferral Plan if that plan were not subject to legal limits on the amount of contributions that can be allocated to an individual in a single year. The Huntsman SSP was amended and restated effective as of January 1, 2005 to allow eligible executive employees to comply with Section 409A of the Internal Revenue Code of 1986.
The Huntsman Supplemental Executive Retirement Plan (the "SERP") is an unfunded non-qualified pension plan established to provide certain executive employees with benefits that could not be provided, due to legal limitations, under the Huntsman Defined Benefit Pension Plan, a qualified defined benefit pension plan, and the Huntsman Money Purchase Pension Plan, a qualified money purchase pension plan.
Assets of these plans are included in other noncurrent assets and as of December 31, 2012 and 2011 were $14 million and $12 million, respectively. During each of the years ended December 31, 2012, 2011 and 2010 we expensed a total of $1 million as contributions to the Huntsman SSP and the SERP.
STOCK-BASED INCENTIVE PLAN
In connection with the initial public offering of common and preferred stock on February 16, 2005, our parent adopted the Huntsman Stock Incentive Plan (the "Stock Incentive Plan"). The Stock Incentive Plan permits the grant of non-qualified stock options, incentive stock options, stock appreciation rights, nonvested stock, phantom stock, performance awards and other stock-based awards to our employees, directors and consultants and to employees and consultants of our subsidiaries, provided that incentive stock options may be granted solely to employees. As of December 31, 2012 we
F-57
HUNTSMAN INTERNATIONAL LLC AND SUBSIDIARIES
NOTES TO CONSOLIDATED FINANCIAL STATEMENTS (Continued)
17. EMPLOYEE BENEFIT PLANS (Continued)
are authorized to grant up to 32.6 million shares under the Stock Incentive Plan. See "Note 22. Stock-Based Compensation Plan."
INTERNATIONAL PLANS
International employees are covered by various post employment arrangements consistent with local practices and regulations. Such obligations are included in the consolidated financial statements in other long-term liabilities.
18. INCOME TAXES
The following is a summary of U.S. and non-U.S. provisions for current and deferred income taxes (dollars in millions):
| |
Year ended December 31, |
|||||||||
|---|---|---|---|---|---|---|---|---|---|---|
| |
2012 | 2011 | 2010 | |||||||
Income tax expense (benefit): |
||||||||||
U.S. |
||||||||||
Current |
$ | 52 | $ | 7 | $ | (23 | ) | |||
Deferred |
129 | 69 | 45 | |||||||
Non-U.S. |
||||||||||
Current |
51 | 63 | 41 | |||||||
Deferred |
(53 | ) | (26 | ) | (23 | ) | ||||
Total |
$ | 179 | $ | 113 | $ | 40 | ||||
The following schedule reconciles the differences between the U.S. federal income taxes at the U.S. statutory rate to our provision (benefit) for income taxes (dollars in millions):
| |
Year ended December 31, |
|||||||||
|---|---|---|---|---|---|---|---|---|---|---|
| |
2012 | 2011 | 2010 | |||||||
Income from continuing operations before income taxes |
$ | 559 | $ | 370 | $ | 184 | ||||
Expected tax expense at U.S. statutory rate of 35% |
$ | 196 | $ | 130 | $ | 64 | ||||
Change resulting from: |
||||||||||
State tax expense (benefit) net of federal benefit |
15 | 7 | (4 | ) | ||||||
Non-U.S. tax rate differentials |
1 | 6 | (16 | ) | ||||||
Effects of non-U.S. operations |
(1 | ) | 8 | 22 | ||||||
U.S. domestic manufacturing deduction |
(8 | ) | — | — | ||||||
Unrealized currency exchange gains and losses |
11 | (5 | ) | (6 | ) | |||||
Effect of tax holidays |
(12 | ) | (1 | ) | 2 | |||||
U.S. foreign tax credits, net of associated income and taxes |
(21 | ) | (4 | ) | — | |||||
Tax authority audits and dispute resolutions |
5 | 4 | (16 | ) | ||||||
Change in valuation allowance |
(14 | ) | (19 | ) | (22 | ) | ||||
Other, net |
7 | (13 | ) | 16 | ||||||
Total income tax expense |
$ | 179 | $ | 113 | $ | 40 | ||||
F-58
HUNTSMAN INTERNATIONAL LLC AND SUBSIDIARIES
NOTES TO CONSOLIDATED FINANCIAL STATEMENTS (Continued)
18. INCOME TAXES (Continued)
On September 8, 2009, we announced the closure of our Australia styrenics operations. U.S. tax law, under our relevant facts, provides for a deduction on investments that are "worthless" for U.S. tax purposes. Therefore, during 2012, 2011, and 2010, we recorded tax benefits of $3 million, $2 million and $28 million, respectively, in discontinued operations related to the closure of and the cumulative U.S. investments in our Australia styrenics business.
We operate in 42 non-U.S. tax jurisdictions, and there is no specific country where our operations earn a predominant amount of our off-shore earnings. While the vast majority of these countries have income tax rates that are lower than the U.S. statutory rate, the operating losses we incur in some of our non-U.S. jurisdictions mitigate the amount of tax rate benefit we would otherwise realize from these tax rate differentials.
During 2012, we were granted a tax holiday for the period from January 1, 2012 through December 31, 2016 with respect to certain income from products manufactured by our Pigments segment in Malaysia. We are required to make certain investments in order to enjoy the benefits of the tax holiday, and we intend to make these investments.
The components of income from continuing operations before income taxes were as follows (dollars in millions):
| |
Year ended December 31, |
|||||||||
|---|---|---|---|---|---|---|---|---|---|---|
| |
2012 | 2011 | 2010 | |||||||
U.S. |
$ | 494 | $ | 255 | $ | 38 | ||||
Non-U.S. |
65 | 115 | 146 | |||||||
Total |
$ | 559 | $ | 370 | $ | 184 | ||||
F-59
HUNTSMAN INTERNATIONAL LLC AND SUBSIDIARIES
NOTES TO CONSOLIDATED FINANCIAL STATEMENTS (Continued)
18. INCOME TAXES (Continued)
Components of deferred income tax assets and liabilities were as follows (dollars in millions):
| |
December 31, | ||||||
|---|---|---|---|---|---|---|---|
| |
2012 | 2011 | |||||
Deferred income tax assets: |
|||||||
Net operating loss and AMT credit carryforwards |
$ | 819 | $ | 895 | |||
Pension and other employee compensation |
288 | 254 | |||||
Property, plant and equipment |
69 | 77 | |||||
Intangible assets |
33 | 35 | |||||
Foreign tax credits |
113 | 82 | |||||
Other, net |
106 | 140 | |||||
Total |
$ | 1,428 | $ | 1,483 | |||
Deferred income tax liabilities: |
|||||||
Property, plant and equipment |
$ | (524 | ) | $ | (515 | ) | |
Pension and other employee compensation |
— | (25 | ) | ||||
Other, net |
(88 | ) | (107 | ) | |||
Total |
$ | (612 | ) | $ | (647 | ) | |
Net deferred tax asset before valuation allowance |
$ | 816 | $ | 836 | |||
Valuation allowance |
(745 | ) | (768 | ) | |||
Net deferred tax asset |
$ | 71 | $ | 68 | |||
Current deferred tax asset |
$ | 51 | $ | 40 | |||
Current deferred tax liability |
(39 | ) | (29 | ) | |||
Non-current deferred tax asset |
229 | 163 | |||||
Non-current deferred tax liability |
(170 | ) | (106 | ) | |||
Net deferred tax asset |
$ | 71 | $ | 68 | |||
We have net operating loss carryforwards ("NOLs") of $2,893 million in various non-U.S. jurisdictions. While the majority of the non-U.S. NOLs have no expiration date, $1,327 million have a limited life (of which $1,127 million are subject to a valuation allowance) and $17 million are scheduled to expire in 2013 (all of which are subject to a valuation allowance). We had no NOLs expire unused in 2012.
Included in the $2,893 million of non-U.S. NOLs is $860 million attributable to our Luxembourg entities. As of December 31, 2012, there is a valuation allowance of $222 million against these net tax-effected NOLs of $247 million. Due to the uncertainty surrounding the realization of the benefits of these losses, we have reduced substantially all of the related deferred tax asset with a valuation allowance.
Valuation allowances are reviewed each period on a tax jurisdiction by jurisdiction basis to analyze whether there is sufficient positive or negative evidence to support a change in judgment about the realizability of the related deferred tax assets. These conclusions require significant judgment. In evaluating the objective evidence that historical results provide, we consider the cyclicality of businesses and cumulative income or losses during the applicable period. Cumulative losses incurred over the period limits our ability to consider other subjective evidence such as our projections for the future.
F-60
HUNTSMAN INTERNATIONAL LLC AND SUBSIDIARIES
NOTES TO CONSOLIDATED FINANCIAL STATEMENTS (Continued)
18. INCOME TAXES (Continued)
During 2012, we released valuation allowances of $24 million on a portion of our net deferred tax assets in China, in certain U.S. states and in Luxembourg, and we established valuation allowances of $23 million on certain net deferred tax assets in the U.S., India and Indonesia.
Primarily as a result of a cumulative history of operating profits, we released certain valuation allowances in China and in certain U.S. state tax jurisdictions of $9 million and $2 million, respectively. Additionally, a partial valuation allowance release was recognized in Luxembourg for $12 million as a result of significant changes in estimated future taxable income resulting from changed circumstances.
During 2012, we amended certain prior year U.S. federal income tax filings and claimed $31 million of additional U.S. foreign tax credits. Due to uncertainty regarding our ability to actually utilize these credits before they expire in 2015, we established a partial valuation allowance of $21 million against the incremental deferred tax asset.
During 2011, we released valuation allowances of $27 million on certain net deferred tax assets in France and Spain (as a result of recent profitability in our Pigments business), Singapore (as a result of a cumulative history of operating profits), Australia (as a result of discontinuing the unprofitable portion of the business operations in that country) and Luxembourg (as a result of restructuring our internal treasury activities such that a portion of the deferred tax assets is more likely than not to be realized). During 2010, we released valuation allowances of $20 million on certain net deferred tax assets, principally in Australia (as a result of discontinuing the unprofitable portion of the business operations in that country) and Luxembourg (as a result of restructuring our internal treasury activities such that a portion of the deferred tax assets is more likely than not to be realized).
Uncertainties regarding expected future income in certain jurisdictions could affect the realization of deferred tax assets in those jurisdictions and result in additional valuation allowances in future periods.
The following is a summary of changes in the valuation allowance (dollars in millions):
| |
2012 | 2011 | 2010 | |||||||
|---|---|---|---|---|---|---|---|---|---|---|
Valuation allowance as of January 1 |
$ | 768 | $ | 813 | $ | 861 | ||||
Valuation allowance as of December 31 |
745 | 768 | 813 | |||||||
Net decrease |
23 | 45 | 48 | |||||||
Foreign currency movements |
7 | (30 | ) | 1 | ||||||
(Decrease) increase to deferred tax assets with an offsetting (decrease) increase to valuation allowances |
(16 | ) | 4 | (27 | ) | |||||
Change in valuation allowance per rate reconciliation |
$ | 14 | $ | 19 | $ | 22 | ||||
Components of change in valuation allowance affecting tax expense: |
||||||||||
Pre-tax income (losses) in jurisdictions with valuation allowances resulting in no tax expense or benefit |
$ | 13 | $ | (3 | ) | $ | 2 | |||
Releases of valuation allowances in various jurisdictions |
24 | 27 | 20 | |||||||
Establishments of valuation allowances in various jurisdictions |
(23 | ) | (5 | ) | — | |||||
Change in valuation allowance per rate reconciliation |
$ | 14 | $ | 19 | $ | 22 | ||||
F-61
HUNTSMAN INTERNATIONAL LLC AND SUBSIDIARIES
NOTES TO CONSOLIDATED FINANCIAL STATEMENTS (Continued)
18. INCOME TAXES (Continued)
The following is a reconciliation of our unrecognized tax benefits (dollars in millions):
| |
2012 | 2011 | |||||
|---|---|---|---|---|---|---|---|
Unrecognized tax benefits as of January 1 |
$ | 39 | $ | 43 | |||
Gross increases and decreases—tax positions taken during a prior period |
15 | (3 | ) | ||||
Gross increases and decreases—tax positions taken during the current period |
9 | 3 | |||||
Decreases related to settlements of amounts due to tax authorities |
(3 | ) | — | ||||
Reductions resulting from the lapse of statutes of limitation |
(3 | ) | (4 | ) | |||
Foreign currency movements |
— | — | |||||
Unrecognized tax benefits as of December 31 |
$ | 57 | $ | 39 | |||
As of December 31, 2012 and 2011, the amount of unrecognized tax benefits which, if recognized, would affect the effective tax rate is $37 million and $31 million, respectively.
In accordance with our accounting policy, we continue to recognize interest and penalties accrued related to unrecognized tax benefits in income tax expense.
| |
Year ended December 31, | |||||||||
|---|---|---|---|---|---|---|---|---|---|---|
| |
2012 | 2011 | 2010 | |||||||
Interest expense included in tax expense |
$ | (1 | ) | $ | 5 | $ | 1 | |||
Penalties expense included in tax expense |
— | — | — | |||||||
| |
December 31, | ||||||
|---|---|---|---|---|---|---|---|
| |
2012 | 2011 | |||||
Accrued liability for interest |
$ | 10 | $ | 13 | |||
Accrued liability for penalties |
1 | 2 | |||||
We conduct business globally and, as a result, we file income tax returns in U.S. federal, various U.S. state and various non-U.S. jurisdictions. The following table summarizes the tax years that remain subject to examination by major tax jurisdictions:
Tax Jurisdiction
|
Open Tax Years | |
|---|---|---|
China |
2001 and later | |
France |
2002 and later | |
India |
2004 and later | |
Italy |
2008 and later | |
Malaysia |
2003 and later | |
Switzerland |
2006 and later | |
The Netherlands |
2007 and later | |
United Kingdom |
2009 and later | |
United States federal |
2011 and later |
F-62
HUNTSMAN INTERNATIONAL LLC AND SUBSIDIARIES
NOTES TO CONSOLIDATED FINANCIAL STATEMENTS (Continued)
18. INCOME TAXES (Continued)
Certain of our U.S. and non-U.S. income tax returns are currently under various stages of audit by applicable tax authorities and the amounts ultimately agreed upon in resolution of the issues raised may differ materially from the amounts accrued.
We estimate that it is reasonably possible that certain of our non-U.S. unrecognized tax benefits could change within 12 months of the reporting date with a resulting decrease in the unrecognized tax benefits within a reasonably possible range of $1 million to $19 million. For the 12-month period from the reporting date, we would expect that a substantial portion of the decrease in our unrecognized tax benefits would result in no corresponding benefit to our income tax expense.
During 2012, we concluded and settled tax examinations in the U.S. (both federal and various states) and various non-U.S. jurisdictions including, but not limited to, Hong Kong, Thailand and Japan. During 2011, we concluded and effectively settled tax examinations in the U.S. (both federal and various states) and various non-U.S. jurisdictions including, but not limited to, Australia, China, France and Germany. During 2010, we concluded and settled tax examinations in the U.S. (both federal and various states) and various non-U.S. jurisdictions including, but not limited to, Belgium, Spain, Indonesia, Thailand and the U.K.
For non-U.S. entities that were not treated as branches for U.S. tax purposes, we do not provide for income taxes on the undistributed earnings of these subsidiaries as earnings are reinvested and, in the opinion of management, will continue to be reinvested indefinitely. The undistributed earnings of foreign subsidiaries that are deemed to be permanently invested were approximately $215 million at December 31, 2012. It is not practicable to determine the unrecognized deferred tax liability on those earnings. We have material inter-company debt obligations owed by our non-U.S. subsidiaries to the U.S. We do not intend to repatriate earnings to the U.S. via dividend based on estimates of future domestic cash generation and our ability to return cash to the U.S. through payments of inter-company debt owned by our non-U.S. subsidiaries to the U.S. To the extent that cash is required in the U.S., rather than repatriate earnings to the U.S. via dividend, we expect to utilize our inter-company debt. If any earnings were repatriated via dividend, we would need to accrue and pay taxes on the distributions.
19. COMMITMENTS AND CONTINGENCIES
PURCHASE COMMITMENTS
We have various purchase commitments extending through 2023 for materials, supplies and services entered into in the ordinary course of business. Included in the purchase commitments table below are contracts which require minimum volume purchases that extend beyond one year or are renewable annually and have been renewed for 2012. Certain contracts allow for changes in minimum required purchase volumes in the event of a temporary or permanent shutdown of a facility. To the extent the contract requires a minimum notice period, such notice period has been included in the table below. The contractual purchase prices for substantially all of these contracts are variable based upon market prices, subject to annual negotiations. We have estimated our contractual obligations by using the terms of our 2012 pricing for each contract. We also have a limited number of contracts which require a minimum payment even if no volume is purchased. We believe that all of our purchase obligations will be utilized in our normal operations. For each of the years ended December 31, 2012, 2011 and 2010, we made minimum payments of nil under such take or pay contracts without taking the property.
F-63
HUNTSMAN INTERNATIONAL LLC AND SUBSIDIARIES
NOTES TO CONSOLIDATED FINANCIAL STATEMENTS (Continued)
19. COMMITMENTS AND CONTINGENCIES (Continued)
Total purchase commitments as of December 31, 2012 are as follows (dollars in millions):
Year ending December 31
|
|
|||
|---|---|---|---|---|
2013 |
$ | 1,138 | ||
2014 |
435 | |||
2015 |
237 | |||
2016 |
59 | |||
2017 |
59 | |||
Thereafter |
30 | |||
|
$ | 1,958 | ||
OPERATING LEASES
We lease certain railcars, aircraft, equipment and facilities under long-term lease agreements. The total expense recorded under operating lease agreements in the accompanying consolidated statements of operations is approximately $79 million, $83 million and $62 million for 2012, 2011 and 2010, respectively, net of sublease rentals of approximately $4 million for each of 2012, 2011 and 2010, respectively.
Future minimum lease payments under operating leases as of December 31, 2012 are as follows (dollars in millions):
Year ending December 31
|
|
|||
|---|---|---|---|---|
2013 |
$ | 79 | ||
2014 |
68 | |||
2015 |
53 | |||
2016 |
45 | |||
2017 |
40 | |||
Thereafter |
60 | |||
|
$ | 345 | ||
Future minimum lease payments have not been reduced by minimum sublease rentals of $57 million due in the future under noncancelable subleases.
LEGAL MATTERS
Asbestos Litigation
We have been named as a "premises defendant" in a number of asbestos exposure cases, typically claims by nonemployees of exposure to asbestos while at a facility. In the past, these cases typically have involved multiple plaintiffs bringing actions against multiple defendants, and the complaints have not indicated which plaintiffs were making claims against which defendants, where or how the alleged injuries occurred or what injuries each plaintiff claimed. These facts, which would be central to any estimate of probable loss, generally have been learned only through discovery.
F-64
HUNTSMAN INTERNATIONAL LLC AND SUBSIDIARIES
NOTES TO CONSOLIDATED FINANCIAL STATEMENTS (Continued)
19. COMMITMENTS AND CONTINGENCIES (Continued)
Where a claimant's alleged exposure occurred prior to our ownership of the relevant "premises," the prior owners generally have contractually agreed to retain liability for, and to indemnify us against, asbestos exposure claims. This indemnification is not subject to any time or dollar amount limitations. Upon service of a complaint in one of these cases, we tender it to the prior owner. Rarely do the complaints in these cases state the amount of damages being sought. The prior owner accepts responsibility for the conduct of the defense of the cases and payment of any amounts due to the claimants. In our nineteen-year experience with tendering these cases, we have not made any payment with respect to any tendered asbestos cases. We believe that the prior owners have the intention and ability to continue to honor their indemnity obligations, although we cannot assure you that they will continue to do so or that we will not be liable for these cases if they do not.
The following table presents for the periods indicated certain information about cases for which service has been received that we have tendered to the prior owner, all of which have been accepted.
| |
Year ended December 31, 2012 |
Year ended December 31, 2011 |
Year ended December 31, 2010 |
|||||||
|---|---|---|---|---|---|---|---|---|---|---|
Unresolved at beginning of period |
1,080 | 1,116 | 1,138 | |||||||
Tendered during period |
3 | 10 | 24 | |||||||
Resolved during period(1) |
3 | 46 | 46 | |||||||
Unresolved at end of period |
1,080 | 1,080 | 1,116 | |||||||
We have never made any payments with respect to these cases. As of December 31, 2012, we had an accrued liability of approximately $10 million relating to these cases and a corresponding receivable of approximately $10 million relating to our indemnity protection with respect to these cases. We cannot assure you that our liability will not exceed our accruals or that our liability associated with these cases would not be material to our financial condition, results of operations or liquidity; accordingly, we are not able to estimate the amount or range of loss in excess of our accruals. Additional asbestos exposure claims may be made against us in the future, and such claims could be material. However, because we are not able to estimate the amount or range of losses associated with such claims, we have made no accruals with respect to unasserted asbestos exposure claims as of December 31, 2012.
Certain cases in which we are a premises defendant are not subject to indemnification by prior owners or operators. However, we may be entitled to insurance or other recoveries in some of these cases. The following table presents for the periods indicated certain information about these cases.
F-65
HUNTSMAN INTERNATIONAL LLC AND SUBSIDIARIES
NOTES TO CONSOLIDATED FINANCIAL STATEMENTS (Continued)
19. COMMITMENTS AND CONTINGENCIES (Continued)
Cases include all cases for which service has been received by us. Certain prior cases that were filed in error against us have been dismissed.
| |
Year ended December 31, 2012 |
Year ended December 31, 2011 |
Year ended December 31, 2010 |
|||||||
|---|---|---|---|---|---|---|---|---|---|---|
Unresolved at beginning of period |
36 | 37 | 39 | |||||||
Filed during period |
21 | 11 | 5 | |||||||
Resolved during period |
7 | 12 | 7 | |||||||
Unresolved at end of period |
50 | 36 | 37 | |||||||
We paid gross settlement costs for asbestos exposure cases that are not subject to indemnification of $559,000, $584,000 and $201,000 during the years ended December 31, 2012, 2011 and 2010, respectively. As of December 31, 2012, we had no accrual relating to these cases. We cannot assure you that our liability will not exceed our accruals or that our liability associated with these cases would not be material to our financial condition, results of operations or liquidity; accordingly, we are not able to estimate the amount or range of loss in excess of our accruals. Additional asbestos exposure claims may be made against us in the future, and such claims could be material. However, because we are not able to estimate the amount or range of losses associated with such claims, we have made no accruals with respect to unasserted asbestos exposure claims as of December 31, 2012.
Antitrust Matters
We have been named as a defendant in two class action civil antitrust suits filed on February 9 and 12, 2010 in the U.S. District Court for the District of Maryland alleging that we and our co-defendants and other co-conspirators conspired to fix prices of titanium dioxide sold in the U.S. between at least March 1, 2002 and the present. The suits were subsequently consolidated. The other defendants named in this matter are DuPont, Kronos and Millennium. On August 28, 2012, the court certified a class consisting of all U.S. customers who purchased titanium dioxide directly from defendants since February 1, 2003, and notice was given to putative class members the week of January 14, 2013 after the Court of Appeals for the Fourth Circuit denied our petition to appeal the order certifying the class. Trial is set to begin September 9, 2013.
The plaintiffs seek to recover on behalf of the class injunctive relief, treble damages, costs of suit and attorneys fees. We are not aware of any illegal conduct by us or any of our employees. Nevertheless, we have incurred costs relating to these claims and could incur additional costs in amounts material to us. Because of the overall complexity of these cases, we are unable to reasonably estimate any possible loss or range of loss with respect to these claims.
Product Delivery Claim
We have been notified by a customer of potential claims related to our allegedly delivering a different product from that which it had ordered. Our customer claims that it was unaware that the different product had been delivered until after it had been used to manufacture materials which were subsequently sold. Originally, the customer stated that it had been notified of claims of up to an aggregate of €153 million (approximately $202 million) relating to this matter and believed that we may be responsible for all or a portion of these potential claims. Our customer has since resolved some of these claims and the aggregate amount of the current claims is now approximately €113 million
F-66
HUNTSMAN INTERNATIONAL LLC AND SUBSIDIARIES
NOTES TO CONSOLIDATED FINANCIAL STATEMENTS (Continued)
19. COMMITMENTS AND CONTINGENCIES (Continued)
(approximately $149 million). Based on the facts currently available to us, we believe that we are insured for any liability we may ultimately have in excess of $10 million. However, no assurance can be given regarding our ultimate liability or costs to us. We believe the range of possible loss to our Company in this matter to be between €0 and €113 million and have made no accrual with respect to this matter.
Indemnification Matter
On July 3, 2012, Deutsche Bank Securities Inc. and Credit Suisse Securities (USA) LLC demanded that our parent indemnify them for claims brought by certain MatlinPatterson entities that were formerly our parent's shareholders in litigation filed June 19, 2012 in the 9th District Court in Montgomery County, Texas. The Banks assert that they are entitled to indemnification pursuant to the Agreement of Compromise and Settlement between the Banks and our parent, dated June 22, 2009, wherein the Banks and our parent settled claims that we brought relating to the failed merger with Hexion. Plaintiffs claim that the Banks knowingly made materially false representations about the nature of the financing for the acquisition of our parent by Hexion and that they suffered substantial losses to their 19 million shares of our parent's common stock as a result of the Banks' misrepresentations. Plaintiffs are asserting statutory fraud, common law fraud and aiding and abetting statutory fraud and are seeking actual damages, exemplary damages, costs and attorney's fees, pre-judgment and post-judgment interest. Our parent has denied the Banks' indemnification demand. On December 21, 2012, the court dismissed Plaintiffs' claims. Plaintiffs subsequently filed a motion for reconsideration and could still appeal the court's dismissal of their claims.
Other Proceedings
We are a party to various other proceedings instituted by private plaintiffs, governmental authorities and others arising under provisions of applicable laws, including various environmental, products liability and other laws. Except as otherwise disclosed in this report, we do not believe that the outcome of any of these matters will have a material effect on our financial condition, results of operations or liquidity.
20. ENVIRONMENTAL, HEALTH AND SAFETY MATTERS
ENVIRONMENTAL, HEALTH AND SAFETY MATTERS
General
We are subject to extensive federal, state, local and international laws, regulations, rules and ordinances relating to safety, pollution, protection of the environment, product management and distribution, and the generation, storage, handling, transportation, treatment, disposal and remediation of hazardous substances and waste materials. In the ordinary course of business, we are subject to frequent environmental inspections and monitoring and occasional investigations by governmental enforcement authorities. In addition, our production facilities require operating permits that are subject to renewal, modification and, in certain circumstances, revocation. Actual or alleged violations of safety laws, environmental laws or permit requirements could result in restrictions or prohibitions on plant operations or product distribution, substantial civil or criminal sanctions, as well as, under some environmental laws, the assessment of strict liability and/or joint and several liability. Moreover, changes in environmental regulations could inhibit or interrupt our operations, or require us to modify our facilities or operations. Accordingly, environmental or regulatory matters may cause us to incur significant unanticipated losses, costs or liabilities.
F-67
HUNTSMAN INTERNATIONAL LLC AND SUBSIDIARIES
NOTES TO CONSOLIDATED FINANCIAL STATEMENTS (Continued)
20. ENVIRONMENTAL, HEALTH AND SAFETY MATTERS (Continued)
Environmental, Health and Safety Systems
We are committed to achieving and maintaining compliance with all applicable EHS legal requirements, and we have developed policies and management systems that are intended to identify the multitude of EHS legal requirements applicable to our operations, enhance compliance with applicable legal requirements, ensure the safety of our employees, contractors, community neighbors and customers and minimize the production and emission of wastes and other pollutants. Although EHS legal requirements are constantly changing and are frequently difficult to comply with, these EHS management systems are designed to assist us in our compliance goals while also fostering efficiency and improvement and reducing overall risk to us.
EHS Capital Expenditures
We may incur future costs for capital improvements and general compliance under EHS laws, including costs to acquire, maintain and repair pollution control equipment. For the years ended December 31, 2012, 2011 and 2010, our capital expenditures for EHS matters totaled $105 million, $92 million, and $85 million, respectively. Because capital expenditures for these matters are subject to evolving regulatory requirements and depend, in part, on the timing, promulgation and enforcement of specific requirements, our capital expenditures for EHS matters have varied significantly from year to year and we cannot provide assurance that our recent expenditures are indicative of future amounts we may spend related to EHS and other applicable laws.
Remediation Liabilities
We have incurred, and we may in the future incur, liability to investigate and clean up waste or contamination at our current or former facilities or facilities operated by third parties at which we may have disposed of waste or other materials. Similarly, we may incur costs for the cleanup of waste that was disposed of prior to the purchase of our businesses. Under some circumstances, the scope of our liability may extend to damages to natural resources.
Under CERCLA and similar state laws, a current or former owner or operator of real property may be liable for remediation costs regardless of whether the release or disposal of hazardous substances was in compliance with law at the time it occurred, and a current owner or operator may be liable regardless of whether it owned or operated the facility at the time of the release. Outside the U.S., analogous contaminated property laws, such as those in effect in France and Australia, can hold past owners and/or operators liable for remediation at former facilities. Currently, there are approximately 10 former facilities or third-party sites in the U.S. for which we have been notified of potential claims against us for cleanup liabilities, including, but not limited to, sites listed under CERCLA. Based on current information and past experiences at other CERCLA sites, we do not expect these third-party claims to have a material impact on our consolidated financial statements.
One of these sites, the North Maybe Canyon Mine site, involves a former phosphorous mine near Soda Springs, Idaho, which is believed to have been operated by a predecessor company to us. In 2004, the U.S. Forest Service notified us that we are a CERCLA PRP for contaminated surface water at the site. In February 2010, we and Wells Cargo (another PRP) agreed to conduct a Remedial Investigation/Feasibility Study of a portion of the site and are currently engaged in that process. At this time, we are unable to reasonably estimate our potential liabilities at this site.
F-68
HUNTSMAN INTERNATIONAL LLC AND SUBSIDIARIES
NOTES TO CONSOLIDATED FINANCIAL STATEMENTS (Continued)
20. ENVIRONMENTAL, HEALTH AND SAFETY MATTERS (Continued)
In addition, under RCRA and similar state laws, we may be required to remediate contamination originating from our properties as a condition to our hazardous waste permit. Some of our manufacturing sites have an extended history of industrial chemical manufacturing and use, including on-site waste disposal. We are aware of soil, groundwater or surface contamination from past operations at some of our sites, and we may find contamination at other sites in the future. For example, our Port Neches, Texas, and Geismar, Louisiana, facilities are the subject of ongoing remediation requirements imposed under RCRA. Similar laws exist in a number of locations in which we currently operate, or previously operated, manufacturing facilities, such as Australia, India, France, Hungary and Italy.
By letter dated March 7, 2006, our former Base Chemicals and Polymers facility in West Footscray, Australia, was issued a clean-up notice by EPA Victoria due to concerns about soil and groundwater contamination emanating from the site. On August 23, 2010, EPA Victoria revoked the second clean-up notice and issued a revised notice that included a requirement for financial assurance for the remediation. We have reached agreement with the agency that a mortgage on the land will be held by the agency as financial surety during the period covered by the current clean-up notice, which ends on July 30, 2014. As of December 31, 2012, we had an accrued liability of $29 million related to estimated environmental remediation costs at this site. We can provide no assurance that the agency will not seek to institute additional requirements for the site or that additional costs will not be associated with the clean up.
Environmental Reserves
We have accrued liabilities relating to anticipated environmental cleanup obligations, site reclamation and closure costs and known penalties. Liabilities are recorded when potential liabilities are either known or considered probable and can be reasonably estimated. Our liability estimates are calculated using present value techniques as appropriate and are based upon requirements placed upon us by regulators, available facts, existing technology and past experience. The environmental liabilities do not include amounts recorded as asset retirement obligations. We had accrued $34 million and $36 million for environmental liabilities as of December 31, 2012 and 2011, respectively. Of these amounts, $10 million and $7 million were classified as accrued liabilities in our consolidated balance sheets as of December 31, 2012 and 2011, respectively, and $24 million and $29 million were classified as other noncurrent liabilities in our consolidated balance sheets as of December 31, 2012 and 2011, respectively. In certain cases, our remediation liabilities may be payable over periods of up to 30 years. We may incur losses for environmental remediation in excess of the amounts accrued; however, we are not able to estimate the amount or range of such potential excess.
REGULATORY DEVELOPMENTS
The EU regulatory framework for chemicals, called "REACH", became effective in 2007 and is designed to be phased in gradually over 11 years. As a REACH-regulated company that manufactures in or imports more than one metric ton per year of a chemical substance into the European Economic Area, we were required to pre-register with the ECHA, such chemical substances and isolated intermediates to take advantage of the 11 year phase-in period. To meet our compliance obligations, a cross-business REACH team was established, through which we were able to fulfill all required pre-registrations and our first phase registrations by the November 30, 2010 deadline. While we continue our registration efforts to meet the next registration deadline of May 31, 2013, our REACH
F-69
HUNTSMAN INTERNATIONAL LLC AND SUBSIDIARIES
NOTES TO CONSOLIDATED FINANCIAL STATEMENTS (Continued)
20. ENVIRONMENTAL, HEALTH AND SAFETY MATTERS (Continued)
implementation team is now strategically focused on the authorization phase of the REACH process, directing its efforts to address "Substances of Very High Concern" and evaluating potential business implications. Where warranted, evaluation of substitute chemicals will be an important element of our ongoing manufacturing sustainability efforts. As a chemical manufacturer with global operations, we are also actively monitoring and addressing analogous regulatory regimes being considered or implemented outside of the EU, e.g. Korea and Taiwan.
Although the total long-term cost for REACH compliance is unknown at this time, we spent approximately $8 million, $5 million and $9 million in 2012, 2011 and 2010, respectively, to meet the initial REACH requirements. We cannot provide assurance that these recent expenditures are indicative of future amounts that we may be required to spend for REACH compliance.
GREENHOUSE GAS REGULATION
Globally, our operations are increasingly subject to regulations that seek to reduce emissions of GHGs, such as carbon dioxide and methane, which may be contributing to changes in the Earth's climate. At the most recent negotiations of the Conference of the Parties to the Kyoto Protocol, a limited group of nations, including the EU, agreed to a second commitment period for the Kyoto Protocol, an international treaty that provides for reductions in GHG emissions. More significantly, the European Union GHG Emissions Trading System, established pursuant to the Kyoto Protocol to reduce GHG emissions in the EU, has just entered its third phase and ongoing reforms at the EU level—including measures to prop up carbon credit prices and ban the use of certain types of certified emission reductions—may increase our operating costs. Australia has also adopted a carbon trading system that has been recognized for formal linkage with the EU trading system by 2018. Australia's GHG cap-and-trade program may impose compliance obligations upon our operations that may increase our operating costs. In the United States, California has commenced the first compliance period of its cap-and-trade program.
Federal climate change legislation in the United States appears unlikely in the near-term. As a result, domestic efforts to curb GHG emissions will be led by the EPA's GHG regulations and the efforts of states. To the extent that our domestic operations are subject to the EPA's GHG regulations, we may face increased capital and operating costs associated with new or expanded facilities. Expansions of our existing facilities or construction of new facilities may be subject to the Clean Air Act's Prevention of Significant Deterioration requirements under the EPA's GHG "Tailoring Rule." Our facilities are also subject to the EPA's Mandatory Reporting of Greenhouse Gases rule, and the collection and reporting of GHG data may increase our operational costs.
Under a consent decree with states and environmental groups, the EPA is due to propose new source performance standards (NSPS) for GHG emissions from refineries. These standards could significantly increase the costs of constructing or adding capacity to refineries and may ultimately increase the costs or decrease the supply of refined products. Either of these events could have an adverse effect on our business.
We are already managing and reporting GHG emissions, to varying degrees, as required by law for our sites in locations subject to Kyoto Protocol obligations and/or EU emissions trading scheme requirements. Although these sites are subject to existing GHG legislation, few have experienced or anticipate significant cost increases as a result of these programs, although it is possible that GHG emission restrictions may increase over time. Potential consequences of such restrictions include capital
F-70
HUNTSMAN INTERNATIONAL LLC AND SUBSIDIARIES
NOTES TO CONSOLIDATED FINANCIAL STATEMENTS (Continued)
20. ENVIRONMENTAL, HEALTH AND SAFETY MATTERS (Continued)
requirements to modify assets to meet GHG emission restrictions and/or increases in energy costs above the level of general inflation, as well as direct compliance costs. Currently, however, it is not possible to estimate the likely financial impact of potential future regulation on any of our sites.
Finally, it should be noted that some scientists have concluded that increasing concentrations of GHG in the earth's atmosphere may produce climate changes that have significant physical effects, such as increased frequency and severity of storms, droughts, and floods and other climatic events. If any of those effects were to occur, they could have an adverse effect on our assets and operations.
PORT NECHES FLARING MATTER
As part of the EPA's national enforcement initiative on flaring operations and by letter dated October 12, 2012, the DOJ notified us that we were in violation of the CAA based on our response to a 2010 CAA Section 114 Information Request. The EPA has used the enforcement initiative to bring similar actions against refiners and other chemical manufacturers. Specifically, the EPA alleged violations of flare operations at our Port Neches, Texas facility from 2007-2012 against us that were not consistent with good pollution control practice and not in compliance with certain flare-related regulations. As a result of these findings, EPA referred this matter to the DOJ. We have been engaged in discussions with the DOJ and the EPA regarding these violations and are in the process of reviewing their allegations and assessing their claims. We are currently unable to determine the likelihood or magnitude of potential penalty or injunctive relief that may be incurred in resolving this matter.
21. [RESERVED]
22. STOCK-BASED COMPENSATION PLAN
Under our parent's Stock Incentive Plan, a plan approved by the Huntsman Corporation stockholders, our parent may grant non-qualified stock options, incentive stock options, stock appreciation rights, restricted stock, phantom stock, performance awards and other stock-based awards to our employees, directors and consultants and to employees and consultants of our subsidiaries, provided that incentive stock options may be granted solely to employees. The terms of the grants are fixed at the grant date. As of December 31, 2012, our parent was authorized to grant up to 32.6 million shares under the Stock Incentive Plan. As of December 31, 2012, our parent had 8 million shares remaining under the Stock Incentive Plan available for grant. Option awards have a maximum contractual term of 10 years and generally must have an exercise price at least equal to the market price of our parent's common stock on the date the option award is granted. Stock- based awards generally vest over a three-year period.
The compensation cost from continuing operations under the Stock Incentive Plan for our Company was as follows (dollars in millions):
| |
Year ended December 31, |
|||||||||
|---|---|---|---|---|---|---|---|---|---|---|
| |
2012 | 2011 | 2010 | |||||||
Compensation cost |
26 | 22 | 24 | |||||||
F-71
HUNTSMAN INTERNATIONAL LLC AND SUBSIDIARIES
NOTES TO CONSOLIDATED FINANCIAL STATEMENTS (Continued)
22. STOCK-BASED COMPENSATION PLAN (Continued)
The total income tax benefit recognized in the statement of operations for stock-based compensation arrangements was $6 million, $6 million and $8 million for the years ended December 31, 2012, 2011 and 2010, respectively.
The fair value of each stock option award is estimated on the date of grant using the Black-Scholes valuation model that uses the assumptions noted in the following table. Expected volatilities are based on the historical volatility of our parent's common stock through the grant date. The expected term of options granted was estimated based on the contractual term of the instruments and employees' expected exercise and post-vesting employment termination behavior. The risk-free rate for periods within the contractual life of the option was based on the U.S. Treasury yield curve in effect at the time of grant. The assumptions noted below represent the weighted averages of the assumptions utilized for all stock options granted during the year.
| |
Year ended December 31, | |||||||||
|---|---|---|---|---|---|---|---|---|---|---|
| |
2012 | 2011 | 2010 | |||||||
Dividend yield |
3.0 | % | 2.3 | % | 3.0 | % | ||||
Expected volatility |
65.3 | % | 65.6 | % | 69.0 | % | ||||
Risk-free interest rate |
1.3 | % | 2.8 | % | 3.1 | % | ||||
Expected life of stock options granted during the period |
6.6 years | 6.6 years | 6.6 years | |||||||
STOCK OPTIONS
A summary of stock option activity under the Stock Incentive Plan as of December 31, 2012 and changes during the year then ended is presented below:
Option Awards
|
Shares | Weighted Average Exercise Price |
Weighted Average Remaining Contractual Term |
Aggregate Intrinsic Value |
|||||||||
|---|---|---|---|---|---|---|---|---|---|---|---|---|---|
| |
(in thousands) |
|
(years) |
(in millions) |
|||||||||
Outstanding at January 1, 2012 |
10,345 | $ | 13.83 | ||||||||||
Granted |
1,363 | 13.41 | |||||||||||
Exercised |
(902 | ) | 3.37 | ||||||||||
Forfeited |
(289 | ) | 19.48 | ||||||||||
Outstanding at December 31, 2012 |
10,517 | 14.52 | 5.4 | $ | 42 | ||||||||
Exercisable at December 31, 2012 |
8,390 | 14.56 | 4.5 | 39 | |||||||||
The weighted-average grant-date fair value of stock options granted during 2012, 2011 and 2010 was $6.36, $9.17 and $6.97 per option, respectively. As of December 31, 2012, there was $9 million of total unrecognized compensation cost related to nonvested stock option arrangements granted under the Stock Incentive Plan. That cost is expected to be recognized over a weighted-average period of approximately 1.4 years.
During the years ended December 31, 2012, 2011 and 2010, the total intrinsic value of stock options exercised was $10 million, $19 million and $14 million, respectively.
F-72
HUNTSMAN INTERNATIONAL LLC AND SUBSIDIARIES
NOTES TO CONSOLIDATED FINANCIAL STATEMENTS (Continued)
22. STOCK-BASED COMPENSATION PLAN (Continued)
NONVESTED SHARES
Nonvested shares granted under the Stock Incentive Plan consist of restricted stock, which is accounted for as an equity award, and phantom stock, which is accounted for as a liability award because it can be settled in either stock or cash. A summary of the status of our nonvested shares as of December 31, 2011 and changes during the year then ended is presented below:
| |
Equity Awards | Liability Awards | |||||||||||
|---|---|---|---|---|---|---|---|---|---|---|---|---|---|
| |
Shares | Weighted Average Grant-Date Fair Value |
Shares | Weighted Average Grant-Date Fair Value |
|||||||||
| |
(in thousands) |
|
(in thousands) |
|
|||||||||
Nonvested at January 1, 2012 |
2,287 | $ | 9.92 | 1,100 | $ | 9.42 | |||||||
Granted |
934 | 13.41 | 383 | 13.41 | |||||||||
Vested |
(1,402 | )(1) | 7.09 | (760 | ) | 6.53 | |||||||
Forfeited |
(30 | ) | 15.27 | (85 | ) | 15.16 | |||||||
Nonvested at December 31, 2012 |
1,789 | 13.87 | 638 | 14.50 | |||||||||
As of December 31, 2012, there was $18 million of total unrecognized compensation cost related to nonvested share compensation arrangements granted under the Stock Incentive Plan. That cost is expected to be recognized over a weighted-average period of approximately 1.5 years. The value of share awards that vested during the years ended December 31, 2012, 2011 and 2010 was $21 million, $23 million and $18 million, respectively.
F-73
HUNTSMAN INTERNATIONAL LLC AND SUBSIDIARIES
NOTES TO CONSOLIDATED FINANCIAL STATEMENTS (Continued)
23. OTHER COMPREHENSIVE LOSS
Other comprehensive (loss) income consisted of the following (dollars in millions):
| |
December 31, | |||||||||||||||
|---|---|---|---|---|---|---|---|---|---|---|---|---|---|---|---|---|
| |
2012 | 2011 | 2010 | |||||||||||||
| |
Accumulated loss |
Loss | Accumulated loss |
Loss | Loss | |||||||||||
Foreign currency translation adjustments, net of tax of $7 and $11 as of December 31, 2012 and 2011, respectively |
$ | 268 | $ | 51 | $ | 217 | $ | (79 | ) | $ | 23 | |||||
Pension and other postretirement benefits adjustments, net of tax of $228 and $155 as of December 31, 2012 and 2011, respectively |
(1,076 | ) | (231 | ) | (845 | ) | (182 | ) | (28 | ) | ||||||
Other comprehensive income (loss) of unconsolidated affiliates |
7 | (1 | ) | 8 | 1 | — | ||||||||||
Other, net |
(3 | ) | — | (3 | ) | (2 | ) | (2 | ) | |||||||
Total |
(804 | ) | (181 | ) | (623 | ) | (262 | ) | (7 | ) | ||||||
Amounts attributable to noncontrolling interests |
13 | 1 | 12 | 5 | 1 | |||||||||||
Amounts attributable to Huntsman International LLC |
$ | (791 | ) | $ | (180 | ) | $ | (611 | ) | $ | (257 | ) | $ | (6 | ) | |
Items of other comprehensive loss of our Company and our consolidated affiliates have been recorded net of tax, with the exception of the foreign currency translation adjustments related to subsidiaries with earnings permanently reinvested. The tax effect is determined based upon the jurisdiction where the income or loss was recognized and is net of valuation allowances.
24. [RESERVED]
25. DISCONTINUED OPERATIONS
AUSTRALIA STYRENICS BUSINESS SHUTDOWN
During the first quarter of 2010, we ceased operation of our former Australian styrenics business. During 2010, we recorded additional closure costs of $6 million. Also during 2010, we recorded a $19 million loss from the recognition of cumulative currency translation losses upon the liquidation and substantial liquidation of foreign entities related to this business. Furthermore, we recorded an additional tax benefit of $28 million in 2010 related to the closure of this business. The following
F-74
HUNTSMAN INTERNATIONAL LLC AND SUBSIDIARIES
NOTES TO CONSOLIDATED FINANCIAL STATEMENTS (Continued)
25. DISCONTINUED OPERATIONS (Continued)
results of operations of our former Australian styrenics business have been presented as discontinued operations in the accompanying consolidated statements of operations (dollars in millions):
| |
Year ended December 31, | |||||||||
|---|---|---|---|---|---|---|---|---|---|---|
| |
2012 | 2011 | 2010 | |||||||
Revenues |
$ | 37 | $ | 38 | $ | 52 | ||||
Operating costs and expenses, net of credits |
(47 | ) | (44 | ) | (85 | ) | ||||
Nonoperating expenses |
— | (19 | ) | |||||||
Operating loss |
(10 | ) | (6 | ) | (52 | ) | ||||
Income tax benefit |
3 | 2 | 28 | |||||||
Loss from discontinued operations, net of tax |
$ | (7 | ) | $ | (4 | ) | $ | (24 | ) | |
In 2006, product defect actions were filed against HCCA in Australian courts relating to the sale and supply of vinyl ester resins that were used in the manufacture of fiberglass swimming pools. HCCA ceased manufacturing these specific resin formulations by 2004 and sold the business that manufactured and sold these resins in 2007.
During the first quarter of 2011, HCCA increased its estimate of probable loss related to these claims and recorded a liability for the full estimated value of the claims and a corresponding receivable relating to our indemnity protection with a net charge to discontinued operations for any potential shortfall in insurance coverage. Following mediation held in August 2011, HCCA and its insurers reached an agreement with two claimants to settle their claims for amounts within our insurance coverage after our self-insured retention was satisfied. Accordingly, during the third quarter of 2011, HCCA reduced its estimate of probable loss proportionately and reversed a portion of the liability related to this matter. The settlements were paid in the fourth quarter of 2011.
The results of our former Australian styrenics business were previously included in our Corporate and other segment and have been presented as discontinued operations in the accompanying consolidated statements of operations for all periods presented.
U.S. BASE CHEMICALS BUSINESS
On November 5, 2007, we completed a disposition of our U.S. base chemicals businesses, which included our former olefins manufacturing assets located at Port Arthur, Texas. A captive ethylene unit at the retained Port Neches, Texas site of our Performance Products segment operations was not included in the sale. This asset, along with a long-term post-closing arrangement for the supply of ethylene and propylene from Flint Hills Resources to us, will continue to provide feedstock for our downstream derivative units.
F-75
HUNTSMAN INTERNATIONAL LLC AND SUBSIDIARIES
NOTES TO CONSOLIDATED FINANCIAL STATEMENTS (Continued)
25. DISCONTINUED OPERATIONS (Continued)
The following results of our former U.S base chemicals business have been presented as discontinued operations in the accompanying consolidated statements of operations (dollars in millions):
| |
Year ended December 31, | |||||||||
|---|---|---|---|---|---|---|---|---|---|---|
| |
2012 | 2011 | 2010 | |||||||
Other expenses |
$ | — | $ | (1 | ) | $ | (6 | ) | ||
Gain on insurance settlements, net |
— | — | 110 | |||||||
(Loss) income before income taxes |
— | (1 | ) | 104 | ||||||
Income tax expense |
— | — | (38 | ) | ||||||
(Loss) income from discontinued operations, net of tax |
$ | — | $ | (1 | ) | $ | 66 | |||
During 2010, we recorded a $110 million pretax gain in connection with the final settlement of insurance claims related to the 2006 fire at our former Port Arthur, Texas plant and a pretax gain of $7 million from the settlement of insurance claims related to the 2005 gulf coast storms. Of the $110 million payment, $34 million was reflected within the statement of cash flows as cash flows from investing activities and the remaining $76 million was reflected as cash flows from operating activities. The results of our former U.S. base chemicals business are included in discontinued operations for all periods presented. These 2010 insurance settlement gains were offset in part by income taxes and legal fees related to the arbitration of the fire insurance claim.
26. RELATED PARTY TRANSACTIONS
Our accompanying consolidated financial statements include the following transactions with our affiliates not otherwise disclosed (dollars in millions):
| |
Year ended December 31, | |||||||||
|---|---|---|---|---|---|---|---|---|---|---|
| |
2012 | 2011 | 2010 | |||||||
Sales to: |
||||||||||
Unconsolidated affiliates |
$ | 223 | $ | 180 | $ | 201 | ||||
Inventory purchases from: |
||||||||||
Unconsolidated affiliates |
565 | 465 | 369 | |||||||
Pursuant to an agreement entered into in 2001, our subsidiary Airstar Corporation ("Airstar") subleases a Gulfstream IV-SP Aircraft (the "Aircraft") from Jstar Corporation ("Jstar"), a corporation wholly owned by Jon M. Huntsman. Jon M. Huntsman is the Executive Chairman and the father of our Chief Executive Officer, Peter R. Huntsman, and our director, Jon M. Huntsman, Jr. In 2011, this arrangement was extended for an additional 10 year period. In connection with this extension, monthly sublease payments from Airstar to Jstar were reduced from approximately $193,000 to approximately $115,000 and an aggregate of $13.8 million is payable through the end of the current 10 year lease term. These monthly sublease payments are used to fund financing costs paid by Jstar to a leasing company. An unrelated third party pays $2.4 million per year to our subsidiary for such third party's part-time use of the Aircraft (or an alternate owned by us if the Aircraft is unavailable), subject to an annual adjustment, which typically has been at least fair market value for the number of flight hours used by such third party. We bear all other costs of operating the Aircraft. In accordance with our
F-76
HUNTSMAN INTERNATIONAL LLC AND SUBSIDIARIES
NOTES TO CONSOLIDATED FINANCIAL STATEMENTS (Continued)
26. RELATED PARTY TRANSACTIONS (Continued)
Aircraft Use Policy, we have entered into aircraft time-sharing agreements with certain members of the Huntsman family, pursuant to which these persons pay for the costs of any personal use of the Aircraft by them.
An agreement was reached prior to the initial public offering of our parent's common stock in February 2005 with the Huntsman Foundation, a private charitable foundation established by Jon M. and Karen H. Huntsman, to further the charitable interests of the Huntsman family, that we would donate our Salt Lake City office building and our option to acquire an adjacent undeveloped parcel of land to the foundation free of debt. On March 24, 2010, we completed this donation. At the time of the donation, the building had an appraised value of approximately $10 million. We continue to occupy and use a portion of the building under a lease pursuant to which we make annual lease payments of approximately $2 million to the Huntsman Foundation. During both 2012 and 2011, we made payments of approximately $2 million to the Huntsman Foundation under the lease. The lease expires on December 31, 2013, subject to two five-year extensions, at our option.
Through May 2002, we paid the premiums on various life insurance policies for Jon M. Huntsman. These policies have been liquidated, and the cash values have been paid to Mr. Huntsman. Mr. Huntsman is indebted to us in the amount of approximately $2 million, which represents the insurance premiums paid on his behalf through May 2002. This amount is included in other noncurrent assets on the accompanying consolidated balance sheets.
27. OPERATING SEGMENT INFORMATION
We derive our revenues, earnings and cash flows from the manufacture and sale of a wide variety of differentiated and commodity chemical products. We have reported our operations through five segments: Polyurethanes, Advanced Materials, Textile Effects, Performance Products and Pigments. We have organized our business and derived our operating segments around differences in product lines.
The major products of each reportable operating segment are as follows:
Segment
|
Products | |
|---|---|---|
| Polyurethanes | MDI, PO, polyols, PG, TPU, aniline and MTBE | |
| Performance Products | amines, surfactants, LAB, maleic anhydride, other performance chemicals, EG, olefins and technology licenses | |
| Advanced Materials | epoxy resin compounds and formulations; cross-linking, matting and curing agents; epoxy, acrylic and polyurethane-based adhesives and tooling resin formulations | |
| Textile Effects | textile chemicals and dyes | |
| Pigments | titanium dioxide |
Sales between segments are generally recognized at external market prices and are eliminated in consolidation. We use EBITDA to measure the financial performance of our global business units and for reporting the results of our operating segments. This measure includes all operating items relating to the businesses. The EBITDA of operating segments excludes items that principally apply to our
F-77
HUNTSMAN INTERNATIONAL LLC AND SUBSIDIARIES
NOTES TO CONSOLIDATED FINANCIAL STATEMENTS (Continued)
27. OPERATING SEGMENT INFORMATION (Continued)
Company as a whole. The revenues and EBITDA for each of our reportable operating segments are as follows (dollars in millions):
| |
Year ended December 31, | |||||||||
|---|---|---|---|---|---|---|---|---|---|---|
| |
2012 | 2011 | 2010 | |||||||
Revenues: |
||||||||||
Polyurethanes |
$ | 4,894 | $ | 4,434 | $ | 3,605 | ||||
Performance Products |
3,065 | 3,301 | 2,659 | |||||||
Advanced Materials |
1,325 | 1,372 | 1,244 | |||||||
Textile Effects |
752 | 737 | 787 | |||||||
Pigments |
1,436 | 1,642 | 1,213 | |||||||
Eliminations |
(285 | ) | (265 | ) | (258 | ) | ||||
Total |
$ | 11,187 | $ | 11,221 | $ | 9,250 | ||||
| |
Year ended December 31, | |||||||||
|---|---|---|---|---|---|---|---|---|---|---|
| |
2012 | 2011 | 2010 | |||||||
Segment EBITDA(1): |
||||||||||
Polyurethanes |
$ | 726 | $ | 469 | $ | 319 | ||||
Performance Products |
360 | 385 | 363 | |||||||
Advanced Materials |
54 | 125 | 143 | |||||||
Textile Effects |
(49 | ) | (199 | ) | 1 | |||||
Pigments |
352 | 501 | 205 | |||||||
Corporate and other(2) |
(251 | ) | (236 | ) | (224 | ) | ||||
Subtotal |
1,192 | 1,045 | 807 | |||||||
Discontinued Operations(3) |
(5 | ) | (6 | ) | 53 | |||||
Total |
1,187 | 1,039 | 860 | |||||||
Interest expense, net |
(238 | ) | (262 | ) | (248 | ) | ||||
Income tax expense—continuing operations |
(179 | ) | (113 | ) | (40 | ) | ||||
Income tax benefit (expense)—discontinued operations |
3 | 5 | (10 | ) | ||||||
Depreciation and amortization |
(408 | ) | (416 | ) | (382 | ) | ||||
Net income attributable to |
||||||||||
Huntsman International LLC |
$ | 365 | $ | 253 | $ | 180 | ||||
Depreciation and Amortization: |
||||||||||
Polyurethanes |
$ | 152 | $ | 160 | $ | 155 | ||||
Performance Products |
113 | 110 | 92 | |||||||
Advanced Materials |
31 | 33 | 33 | |||||||
Textile Effects |
23 | 27 | 26 | |||||||
Pigments |
69 | 74 | 67 | |||||||
Corporate and other(2) |
15 | 12 | 8 | |||||||
Subtotal |
403 | 416 | 381 | |||||||
Discontinued Operations |
5 | — | 1 | |||||||
Total |
$ | 408 | $ | 416 | $ | 382 | ||||
F-78
HUNTSMAN INTERNATIONAL LLC AND SUBSIDIARIES
NOTES TO CONSOLIDATED FINANCIAL STATEMENTS (Continued)
27. OPERATING SEGMENT INFORMATION (Continued)
| |
Year ended December 31, | |||||||||
|---|---|---|---|---|---|---|---|---|---|---|
| |
2012 | 2011 | 2010 | |||||||
Capital Expenditures: |
||||||||||
Polyurethanes |
$ | 107 | $ | 85 | $ | 59 | ||||
Performance Products |
117 | 96 | 66 | |||||||
Advanced Materials |
41 | 39 | 24 | |||||||
Textile Effects |
27 | 34 | 23 | |||||||
Pigments |
98 | 57 | 49 | |||||||
Corporate and other |
22 | 19 | 15 | |||||||
Total |
$ | 412 | $ | 330 | $ | 236 | ||||
| |
December 31, | ||||||
|---|---|---|---|---|---|---|---|
| |
2012 | 2011 | |||||
Total Assets: |
|||||||
Polyurethanes |
$ | 3,221 | $ | 3,086 | |||
Performance Products |
2,449 | 2,340 | |||||
Advanced Materials |
1,366 | 1,307 | |||||
Textile Effects |
745 | 686 | |||||
Pigments |
1,562 | 1,384 | |||||
Corporate and other |
(473 | ) | (473 | ) | |||
Total |
$ | 8,870 | $ | 8,330 | |||
F-79
HUNTSMAN INTERNATIONAL LLC AND SUBSIDIARIES
NOTES TO CONSOLIDATED FINANCIAL STATEMENTS (Continued)
27. OPERATING SEGMENT INFORMATION (Continued)
| |
Year ended December 31, | |||||||||
|---|---|---|---|---|---|---|---|---|---|---|
| |
2012 | 2011 | 2010 | |||||||
By Geographic Area Revenues(1): |
||||||||||
United States |
$ | 3,347 | $ | 3,470 | $ | 2,777 | ||||
China |
1,040 | 944 | 881 | |||||||
Mexico |
954 | 723 | 485 | |||||||
Germany |
600 | 638 | 519 | |||||||
Italy |
465 | 558 | 474 | |||||||
Other nations |
4,781 | 4,888 | 4,114 | |||||||
Total |
$ | 11,187 | $ | 11,221 | $ | 9,250 | ||||
| |
December 31, | ||||||
|---|---|---|---|---|---|---|---|
| |
2012 | 2011 | |||||
Long-lived assets(2): |
|||||||
United States |
$ | 1,299 | $ | 1,278 | |||
The Netherlands |
351 | 310 | |||||
United Kingdom |
314 | 306 | |||||
Saudi Arabia |
231 | 243 | |||||
Germany |
201 | 205 | |||||
China |
169 | 162 | |||||
Italy |
164 | 152 | |||||
Switzerland |
163 | 166 | |||||
France |
154 | 126 | |||||
Spain |
147 | 157 | |||||
Other nations |
463 | 405 | |||||
Total |
$ | 3,656 | $ | 3,510 | |||
28. CONDENSED CONSOLIDATING FINANCIAL INFORMATION
The following condensed consolidating financial statements present, in separate columns, financial information for the following: Huntsman International (on a parent only basis), with its investment in subsidiaries recorded under the equity method; the Guarantors on a combined, and where appropriate, consolidated basis; and the nongurantors on a combined, and where appropriate, consolidated basis. Additional columns present eliminating adjustments and consolidated totals as of December 31, 2012 and 2011 and for the years ended December 31, 2012, 2011 and 2010. There are no contractual restrictions limiting transfers of cash from Guarantor subsidiaries to our Company. Each of the Guarantors is 100% owned by us and has fully and unconditionally guaranteed our outstanding notes on a joint and several basis.
F-80
HUNTSMAN INTERNATIONAL LLC AND SUBSIDIARIES
NOTES TO CONSOLIDATED FINANCIAL STATEMENTS (Continued)
28. CONDENSED CONSOLIDATING FINANCIAL INFORMATION (Continued)
HUNTSMAN INTERNATIONAL LLC AND SUBSIDIARIES
CONDENSED CONSOLIDATING BALANCE SHEETS
AS OF DECEMBER 31, 2012
(Dollars in Millions)
| |
Parent Company |
Guarantors | Nonguarantors | Eliminations | Consolidated Huntsman International LLC |
|||||||||||
|---|---|---|---|---|---|---|---|---|---|---|---|---|---|---|---|---|
ASSETS |
||||||||||||||||
Current assets: |
||||||||||||||||
Cash and cash equivalents |
$ | 7 | $ | 2 | $ | 201 | $ | — | $ | 210 | ||||||
Restricted cash |
— | — | 9 | — | 9 | |||||||||||
Accounts and notes receivable, net |
16 | 182 | 1,336 | — | 1,534 | |||||||||||
Accounts receivable from affiliates |
1,733 | 3,907 | 101 | (5,442 | ) | 299 | ||||||||||
Inventories |
111 | 309 | 1,404 | (5 | ) | 1,819 | ||||||||||
Prepaid expenses |
10 | 7 | 43 | (12 | ) | 48 | ||||||||||
Deferred income taxes |
7 | — | 57 | (13 | ) | 51 | ||||||||||
Other current assets |
203 | 5 | 225 | (211 | ) | 222 | ||||||||||
Total current assets |
2,087 | 4,412 | 3,376 | (5,683 | ) | 4,192 | ||||||||||
Property, plant and equipment, net |
371 | 898 | 2,386 | 1 | 3,656 | |||||||||||
Investment in unconsolidated affiliates |
5,413 | 1,360 | 159 | (6,694 | ) | 238 | ||||||||||
Intangible assets, net |
27 | 2 | 42 | (1 | ) | 70 | ||||||||||
Goodwill |
(18 | ) | 82 | 53 | — | 117 | ||||||||||
Deferred income taxes |
248 | — | 224 | (243 | ) | 229 | ||||||||||
Notes receivable from affiliates |
21 | 941 | 2 | (962 | ) | 2 | ||||||||||
Other noncurrent assets |
72 | 139 | 156 | (1 | ) | 366 | ||||||||||
Total assets |
$ | 8,221 | $ | 7,834 | $ | 6,398 | $ | (13,583 | ) | $ | 8,870 | |||||
LIABILITIES AND EQUITY |
||||||||||||||||
Current liabilities: |
||||||||||||||||
Accounts payable |
$ | 87 | $ | 280 | $ | 734 | $ | — | $ | 1,101 | ||||||
Accounts payable to affiliates |
2,987 | 1,111 | 1,406 | (5,442 | ) | 62 | ||||||||||
Accrued liabilities |
87 | 342 | 518 | (224 | ) | 723 | ||||||||||
Deferred income taxes |
— | 45 | 9 | (15 | ) | 39 | ||||||||||
Note payable to affiliate |
100 | — | — | — | 100 | |||||||||||
Current portion of debt |
15 | — | 273 | — | 288 | |||||||||||
Total current liabilities |
3,276 | 1,778 | 2,940 | (5,681 | ) | 2,313 | ||||||||||
Long-term debt |
3,026 | — | 388 | — | 3,414 | |||||||||||
Notes payable to affiliates |
595 | — | 965 | (961 | ) | 599 | ||||||||||
Deferred income taxes |
14 | 169 | 49 | (62 | ) | 170 | ||||||||||
Other noncurrent liabilities |
216 | 190 | 751 | — | 1,157 | |||||||||||
Total liabilities |
7,127 | 2,137 | 5,093 | (6,704 | ) | 7,653 | ||||||||||
Equity |
||||||||||||||||
Huntsman International LLC members' equity |
||||||||||||||||
Members' equity |
3,109 | 4,689 | 2,262 | (6,951 | ) | 3,109 | ||||||||||
Accumulated deficit |
(1,224 | ) | (243 | ) | (354 | ) | 597 | (1,224 | ) | |||||||
Accumulated other comprehensive (loss) income |
(791 | ) | 1,251 | (692 | ) | (559 | ) | (791 | ) | |||||||
Total Huntsman International LLC members' equity |
1,094 | 5,697 | 1,216 | (6,913 | ) | 1,094 | ||||||||||
Noncontrolling interests in subsidiaries |
— | — | 89 | 34 | 123 | |||||||||||
Total equity |
1,094 | 5,697 | 1,305 | (6,879 | ) | 1,217 | ||||||||||
Total liabilities and equity |
$ | 8,221 | $ | 7,834 | $ | 6,398 | $ | (13,583 | ) | $ | 8,870 | |||||
F-81
HUNTSMAN INTERNATIONAL LLC AND SUBSIDIARIES
NOTES TO CONSOLIDATED FINANCIAL STATEMENTS (Continued)
28. CONDENSED CONSOLIDATING FINANCIAL INFORMATION (Continued)
HUNTSMAN INTERNATIONAL LLC AND SUBSIDIARIES
CONDENSED CONSOLIDATING BALANCE SHEETS
AS OF DECEMBER 31, 2011
(Dollars in Millions)
| |
Parent Company | Guarantors | Nonguarantors | Eliminations | Consolidated Huntsman International LLC |
|||||||||||
|---|---|---|---|---|---|---|---|---|---|---|---|---|---|---|---|---|
ASSETS |
||||||||||||||||
Current assets: |
||||||||||||||||
Cash and cash equivalents |
$ | 4 | $ | — | $ | 227 | $ | — | $ | 231 | ||||||
Restricted cash |
— | — | 8 | — | 8 | |||||||||||
Accounts and notes receivable, net |
13 | 151 | 1,365 | — | 1,529 | |||||||||||
Accounts receivable from affiliates |
1,105 | 3,041 | 93 | (4,091 | ) | 148 | ||||||||||
Inventories |
105 | 271 | 1,167 | (4 | ) | 1,539 | ||||||||||
Prepaid expenses |
9 | 7 | 43 | (13 | ) | 46 | ||||||||||
Deferred income taxes |
6 | — | 49 | (15 | ) | 40 | ||||||||||
Other current assets |
90 | 9 | 222 | (101 | ) | 220 | ||||||||||
Total current assets |
1,332 | 3,479 | 3,174 | (4,224 | ) | 3,761 | ||||||||||
Property, plant and equipment, net |
393 | 868 | 2,247 | 2 | 3,510 | |||||||||||
Investment in unconsolidated affiliates |
5,286 | 1,460 | 147 | (6,691 | ) | 202 | ||||||||||
Intangible assets, net |
42 | 2 | 52 | (3 | ) | 93 | ||||||||||
Goodwill |
(16 | ) | 82 | 48 | — | 114 | ||||||||||
Deferred income taxes |
154 | — | 191 | (182 | ) | 163 | ||||||||||
Notes receivable from affiliates |
20 | 920 | 5 | (940 | ) | 5 | ||||||||||
Other noncurrent assets |
81 | 137 | 264 | — | 482 | |||||||||||
Total assets |
$ | 7,292 | $ | 6,948 | $ | 6,128 | $ | (12,038 | ) | $ | 8,330 | |||||
LIABILITIES AND EQUITY |
||||||||||||||||
Current liabilities: |
||||||||||||||||
Accounts payable |
$ | 53 | $ | 205 | $ | 604 | $ | — | $ | 862 | ||||||
Accounts payable to affiliates |
2,244 | 822 | 1,089 | (4,091 | ) | 64 | ||||||||||
Accrued liabilities |
117 | 204 | 487 | (114 | ) | 694 | ||||||||||
Deferred income taxes |
— | 39 | 7 | (17 | ) | 29 | ||||||||||
Note payable to affiliate |
100 | — | — | — | 100 | |||||||||||
Current portion of debt |
33 | — | 179 | — | 212 | |||||||||||
Total current liabilities |
2,547 | 1,270 | 2,366 | (4,222 | ) | 1,961 | ||||||||||
Long-term debt |
3,128 | — | 602 | — | 3,730 | |||||||||||
Notes payable to affiliates |
435 | — | 944 | (940 | ) | 439 | ||||||||||
Deferred income taxes |
9 | 79 | 98 | (80 | ) | 106 | ||||||||||
Other noncurrent liabilities |
196 | 163 | 644 | — | 1,003 | |||||||||||
Total liabilities |
6,315 | 1,512 | 4,654 | (5,242 | ) | 7,239 | ||||||||||
Equity |
||||||||||||||||
Huntsman International LLC members' |
||||||||||||||||
equity: |
||||||||||||||||
Members' equity |
3,081 | 4,754 | 2,343 | (7,097 | ) | 3,081 | ||||||||||
Accumulated deficit |
(1,493 | ) | (820 | ) | (396 | ) | 1,216 | (1,493 | ) | |||||||
Accumulated other comprehensive (loss) income |
(611 | ) | 1,502 | (546 | ) | (956 | ) | (611 | ) | |||||||
Total Huntsman International LLC members' equity |
977 | 5,436 | 1,401 | (6,837 | ) | 977 | ||||||||||
Noncontrolling interests in subsidiaries |
— | — | 73 | 41 | 114 | |||||||||||
Total equity |
977 | 5,436 | 1,474 | (6,796 | ) | 1,091 | ||||||||||
Total liabilities and equity |
$ | 7,292 | $ | 6,948 | $ | 6,128 | $ | (12,038 | ) | $ | 8,330 | |||||
F-82
HUNTSMAN INTERNATIONAL LLC AND SUBSIDIARIES
NOTES TO CONSOLIDATED FINANCIAL STATEMENTS (Continued)
28. CONDENSED CONSOLIDATING FINANCIAL INFORMATION (Continued)
HUNTSMAN INTERNATIONAL LLC AND SUBSIDIARIES
CONDENSED CONSOLIDATING STATEMENTS OF OPERATIONS
YEAR ENDED DECEMBER 31, 2012
(Dollars in Millions)
| |
Parent Company |
Guarantors | Nonguarantors | Eliminations | Consolidated Huntsman International LLC |
|||||||||||
|---|---|---|---|---|---|---|---|---|---|---|---|---|---|---|---|---|
Revenues: |
||||||||||||||||
Trade sales, services and fees, net |
$ | 932 | $ | 3,443 | $ | 6,589 | $ | — | $ | 10,964 | ||||||
Related party sales |
745 | 447 | 1,161 | (2,130 | ) | 223 | ||||||||||
Total revenues |
1,677 | 3,890 | 7,750 | (2,130 | ) | 11,187 | ||||||||||
Cost of goods sold |
1,424 | 3,003 | 6,849 | (2,130 | ) | 9,146 | ||||||||||
Gross profit |
253 | 887 | 901 | — | 2,041 | |||||||||||
Selling, general and administrative |
191 | 120 | 623 | — | 934 | |||||||||||
Research and development |
47 | 36 | 69 | — | 152 | |||||||||||
Other operating (income) expense |
(5 | ) | 2 | (3 | ) | — | (6 | ) | ||||||||
Restructuring, impairment and plant closing costs |
4 | 7 | 81 | — | 92 | |||||||||||
Operating income |
16 | 722 | 131 | — | 869 | |||||||||||
Interest (expense) income, net |
(207 | ) | 42 | (73 | ) | — | (238 | ) | ||||||||
Equity in income of investment in affiliates and subsidiaries |
503 | 40 | 9 | (545 | ) | 7 | ||||||||||
Loss on early extinguishment of debt |
(80 | ) | — | — | — | (80 | ) | |||||||||
Other (expense) income |
(12 | ) | 14 | (1 | ) | — | 1 | |||||||||
Income from continuing operations before income taxes |
220 | 818 | 66 | (545 | ) | 559 | ||||||||||
Income tax benefit (expense) |
141 | (243 | ) | 1 | (78 | ) | (179 | ) | ||||||||
Income from continuing operations |
361 | 575 | 67 | (623 | ) | 380 | ||||||||||
Income (loss) from discontinued operations, net of tax |
4 | 1 | (12 | ) | — | (7 | ) | |||||||||
Income before extraordinary gain |
365 | 576 | 55 | (623 | ) | 373 | ||||||||||
Extraordinary gain on the acquisition of a business, net of tax of nil |
— | — | 2 | — | 2 | |||||||||||
Net income |
365 | 576 | 57 | (623 | ) | 375 | ||||||||||
Net income attributable to noncontrolling interests |
— | — | (16 | ) | 6 | (10 | ) | |||||||||
Net income attributable to Huntsman International LLC |
$ | 365 | $ | 576 | $ | 41 | $ | (617 | ) | $ | 365 | |||||
Net income |
$ | 365 | $ | 576 | $ | 57 | $ | (623 | ) | $ | 375 | |||||
Other comprehensive loss |
(180 | ) | (250 | ) | (148 | ) | 397 | (181 | ) | |||||||
Comprehensive income attributable to noncontrolling interests |
— | — | (16 | ) | 7 | (9 | ) | |||||||||
Comprehensive income (loss) attributable to Huntsman International LLC |
$ | 185 | $ | 326 | $ | (107 | ) | $ | (219 | ) | $ | 185 | ||||
F-83
HUNTSMAN INTERNATIONAL LLC AND SUBSIDIARIES
NOTES TO CONSOLIDATED FINANCIAL STATEMENTS (Continued)
28. CONDENSED CONSOLIDATING FINANCIAL INFORMATION (Continued)
HUNTSMAN INTERNATIONAL LLC AND SUBSIDIARIES
CONDENSED CONSOLIDATING STATEMENTS OF OPERATIONS
YEAR ENDED DECEMBER 31, 2011
(Dollars in Millions)
| |
Parent Company |
Guarantors | Nonguarantors | Eliminations | Consolidated Huntsman International LLC |
|||||||||||
|---|---|---|---|---|---|---|---|---|---|---|---|---|---|---|---|---|
Revenues: |
||||||||||||||||
Trade sales, services and fees, net |
$ | 885 | $ | 3,349 | $ | 6,807 | $ | — | $ | 11,041 | ||||||
Related party sales |
453 | 493 | 1,098 | (1,864 | ) | 180 | ||||||||||
Total revenues |
1,338 | 3,842 | 7,905 | (1,864 | ) | 11,221 | ||||||||||
Cost of goods sold |
1,178 | 3,160 | 6,855 | (1,830 | ) | 9,363 | ||||||||||
Gross profit |
160 | 682 | 1,050 | (34 | ) | 1,858 | ||||||||||
Selling, general and administrative |
182 | 97 | 637 | — | 916 | |||||||||||
Research and development |
50 | 34 | 82 | — | 166 | |||||||||||
Other operating expense (income) |
35 | (18 | ) | (37 | ) | — | (20 | ) | ||||||||
Restructuring, impairment and plant closing costs |
1 | — | 166 | — | 167 | |||||||||||
Operating (loss) income |
(108 | ) | 569 | 202 | (34 | ) | 629 | |||||||||
Interest (expense) income, net |
(216 | ) | 43 | (89 | ) | — | (262 | ) | ||||||||
Equity in income of investment in affiliates and subsidiaries |
381 | 77 | 9 | (459 | ) | 8 | ||||||||||
Loss on early extinguishment of debt |
(7 | ) | — | — | — | (7 | ) | |||||||||
Other (expense) income |
(35 | ) | — | 1 | 36 | 2 | ||||||||||
Income from continuing operations before income taxes |
15 | 689 | 123 | (457 | ) | 370 | ||||||||||
Income tax benefit (expense) |
232 | (210 | ) | (35 | ) | (100 | ) | (113 | ) | |||||||
Income from continuing operations |
247 | 479 | 88 | (557 | ) | 257 | ||||||||||
Income (loss) from discontinued operations, net of tax |
6 | (1 | ) | (6 | ) | — | (1 | ) | ||||||||
Income before extraordinary gain |
253 | 478 | 82 | (557 | ) | 256 | ||||||||||
Extraordinary gain on the acquisition of a business, net of tax of nil |
— | — | 4 | — | 4 | |||||||||||
Net income |
253 | 478 | 86 | (557 | ) | 260 | ||||||||||
Net income attributable to noncontrolling interests |
— | (2 | ) | (6 | ) | 1 | (7 | ) | ||||||||
Net income attributable to Huntsman International LLC |
$ | 253 | $ | 476 | $ | 80 | $ | (556 | ) | $ | 253 | |||||
Net income |
$ | 253 | $ | 478 | $ | 86 | $ | (557 | ) | $ | 260 | |||||
Other comprehensive loss |
(257 | ) | (98 | ) | (232 | ) | 325 | (262 | ) | |||||||
Comprehensive income attributable to noncontrolling interests |
— | (3 | ) | (1 | ) | 2 | (2 | ) | ||||||||
Comprehensive (loss) income attributable to Huntsman International LLC |
$ | (4 | ) | 377 | $ | (147 | ) | $ | (230 | ) | $ | (4 | ) | |||
F-84
HUNTSMAN INTERNATIONAL LLC AND SUBSIDIARIES
NOTES TO CONSOLIDATED FINANCIAL STATEMENTS (Continued)
28. CONDENSED CONSOLIDATING FINANCIAL INFORMATION (Continued)
HUNTSMAN INTERNATIONAL LLC AND SUBSIDIARIES
CONDENSED CONSOLIDATING STATEMENTS OF OPERATIONS
YEAR ENDED DECEMBER 31, 2010
(Dollars in Millions)
| |
Parent Company |
Guarantors | Nonguarantors | Eliminations | Consolidated Huntsman International LLC |
|||||||||||
|---|---|---|---|---|---|---|---|---|---|---|---|---|---|---|---|---|
Revenues: |
||||||||||||||||
Trade sales, services and fees, net |
$ | 790 | $ | 2,514 | $ | 5,745 | $ | — | $ | 9,049 | ||||||
Related party sales |
262 | 513 | 958 | (1,532 | ) | 201 | ||||||||||
Total revenues |
1,052 | 3,027 | 6,703 | (1,532 | ) | 9,250 | ||||||||||
Cost of goods sold |
869 | 2,594 | 5,815 | (1,506 | ) | 7,772 | ||||||||||
Gross profit |
183 | 433 | 888 | (26 | ) | 1,478 | ||||||||||
Operating expenses: |
||||||||||||||||
Selling, general and administrative |
185 | 88 | 582 | — | 855 | |||||||||||
Research and development |
52 | 30 | 69 | — | 151 | |||||||||||
Other operating (income) expense |
(34 | ) | 11 | 23 | — | — | ||||||||||
Restructuring, impairment and plant closing costs |
1 | 3 | 25 | — | 29 | |||||||||||
Operating income |
(21 | ) | 301 | 189 | (26 | ) | 443 | |||||||||
Interest (expense) income, net |
(215 | ) | 38 | (71 | ) | — | (248 | ) | ||||||||
Equity in (loss) income of investment in affiliates and subsidiaries |
(1,199 | ) | 91 | 24 | 1,108 | 24 | ||||||||||
Loss on early extinguishment of debt |
(37 | ) | — | — | — | (37 | ) | |||||||||
Dividends income |
1,569 | — | — | (1,569 | ) | — | ||||||||||
Other (expense) income |
(25 | ) | — | 2 | 25 | 2 | ||||||||||
Income from continuing operations before income taxes |
72 | 430 | 144 | (462 | ) | 184 | ||||||||||
Income tax benefit (expense) |
101 | (127 | ) | (14 | ) | — | (40 | ) | ||||||||
Income from continuing operations |
173 | 303 | 130 | (462 | ) | 144 | ||||||||||
Income (loss) from discontinued operations, net of tax |
7 | 68 | (33 | ) | — | 42 | ||||||||||
Income before extraordinary loss |
180 | 371 | 97 | (462 | ) | 186 | ||||||||||
Extraordinary loss on the acquisition of a business, net of tax of nil |
— | — | (1 | ) | — | (1 | ) | |||||||||
Net income |
180 | 371 | 96 | (462 | ) | 185 | ||||||||||
Net income attributable to noncontrolling interests |
— | (2 | ) | (4 | ) | 1 | (5 | ) | ||||||||
Net income attributable to Huntsman International LLC |
$ | 180 | $ | 369 | $ | 92 | $ | (461 | ) | $ | 180 | |||||
Net income |
$ | 180 | $ | 371 | $ | 96 | $ | (462 | ) | $ | 185 | |||||
Other comprehensive (loss) income |
(7 | ) | 1,539 | — | (1,539 | ) | (7 | ) | ||||||||
Comprehensive income attributable to noncontrolling interests |
— | (1 | ) | (5 | ) | 2 | (4 | ) | ||||||||
Comprehensive income attributable to Huntsman International LLC |
$ | 173 | 1,909 | $ | 91 | $ | (1,999 | ) | $ | 174 | ||||||
F-85
HUNTSMAN INTERNATIONAL LLC AND SUBSIDIARIES
NOTES TO CONSOLIDATED FINANCIAL STATEMENTS (Continued)
28. CONDENSED CONSOLIDATING FINANCIAL INFORMATION (Continued)
HUNTSMAN INTERNATIONAL LLC AND SUBSIDIARIES
CONDENSED CONSOLIDATING STATEMENTS OF CASH FLOWS
YEAR ENDED DECEMBER 31, 2012
(Dollars in Millions)
| |
Parent Company |
Guarantors | Nonguarantors | Eliminations | Consolidated Huntsman International LLC |
|||||||||||
|---|---|---|---|---|---|---|---|---|---|---|---|---|---|---|---|---|
Net cash provided by operating activities |
$ | 85 | 269 | $ | 508 | $ | (2 | ) | $ | 860 | ||||||
Investing activities: |
||||||||||||||||
Capital expenditures |
(23 | ) | (111 | ) | (278 | ) | — | (412 | ) | |||||||
Acquisition of businesses, net of cash acquired and post-closing adjustments |
— | — | (18 | ) | — | (18 | ) | |||||||||
Proceeds from sale of businesses/assets |
— | — | 6 | — | 6 | |||||||||||
Increase in receivable from affiliate |
(108 | ) | — | — | — | (108 | ) | |||||||||
Investment in affiliate |
225 | (62 | ) | 48 | (211 | ) | — | |||||||||
Investment in unconsolidated affiliates |
(3 | ) | (100 | ) | (24 | ) | — | (127 | ) | |||||||
Cash received from unconsolidated affiliates |
— | 80 | 2 | — | 82 | |||||||||||
Other, net |
— | 1 | (1 | ) | (1 | ) | (1 | ) | ||||||||
Net cash provided by (used in) investing activities |
91 | (192 | ) | (265 | ) | (212 | ) | (578 | ) | |||||||
Financing activities: |
||||||||||||||||
Net repayments under revolving loan facilities |
— | — | (15 | ) | — | (15 | ) | |||||||||
Net borrowings on overdraft facilities |
— | — | 2 | — | 2 | |||||||||||
Repayments of short-term debt |
— | — | (53 | ) | — | (53 | ) | |||||||||
Repayments of long-term debt |
(625 | ) | — | (69 | ) | — | (694 | ) | ||||||||
Proceeds from issuance of long-term debt |
400 | — | 5 | — | 405 | |||||||||||
Repayments of notes payable to affiliate |
(139 | ) | — | — | — | (139 | ) | |||||||||
Proceeds from notes payable to affiliate |
299 | — | — | — | 299 | |||||||||||
Repayments of notes payable |
(33 | ) | — | (4 | ) | — | (37 | ) | ||||||||
Borrowings on notes payable |
33 | — | 1 | — | 34 | |||||||||||
Debt issuance costs paid |
(11 | ) | — | — | — | (11 | ) | |||||||||
Call premiums related to early extinguishment of debt |
(2 | ) | — | — | — | (2 | ) | |||||||||
Contribution from parent |
— | 14 | — | (14 | ) | — | ||||||||||
Distribution to parent |
— | (87 | ) | (138 | ) | 225 | — | |||||||||
Dividends paid to parent |
(96 | ) | (2 | ) | (1 | ) | 3 | (96 | ) | |||||||
Excess tax benefit related to stock-based compensation |
4 | — | — | — | 4 | |||||||||||
Other, net |
(3 | ) | — | — | — | (3 | ) | |||||||||
Net cash used in financing activities |
(173 | ) | (75 | ) | (272 | ) | 214 | (306 | ) | |||||||
Effect of exchange rate changes on cash |
— | — | 3 | — | 3 | |||||||||||
Increase (decrease) in cash and cash equivalents |
3 | 2 | (26 | ) | — | (21 | ) | |||||||||
Cash and cash equivalents at beginning of period |
4 | — | 227 | — | 231 | |||||||||||
Cash and cash equivalents at end of period |
$ | 7 | 2 | $ | 201 | $ | — | $ | 210 | |||||||
F-86
HUNTSMAN INTERNATIONAL LLC AND SUBSIDIARIES
NOTES TO CONSOLIDATED FINANCIAL STATEMENTS (Continued)
28. CONDENSED CONSOLIDATING FINANCIAL INFORMATION (Continued)
HUNTSMAN INTERNATIONAL LLC AND SUBSIDIARIES
CONDENSED CONSOLIDATING STATEMENTS OF CASH FLOWS
YEAR ENDED DECEMBER 31, 2011
(Dollars in Millions)
| |
Parent Company |
Guarantors | Nonguarantors | Eliminations | Consolidated Huntsman International LLC |
|||||||||||
|---|---|---|---|---|---|---|---|---|---|---|---|---|---|---|---|---|
Net cash provided by operating activities |
$ | 304 | $ | 99 | $ | 34 | $ | (5 | ) | $ | 432 | |||||
Investing activities: |
||||||||||||||||
Capital expenditures |
(21 | ) | (70 | ) | (239 | ) | — | (330 | ) | |||||||
Proceeds from settlements treated as reimbursement of capital expenditures |
— | — | 3 | — | 3 | |||||||||||
Acquisition of businesses, net of cash acquired and post-closing adjustments |
— | — | (34 | ) | — | (34 | ) | |||||||||
Cash assumed in connection with the initial consolidation of a variable interest entity |
— | — | 28 | — | 28 | |||||||||||
Proceeds from sale of businesses/assets |
— | 8 | 40 | — | 48 | |||||||||||
Increase in receivable from affiliate |
(57 | ) | — | — | — | (57 | ) | |||||||||
Investment in affiliates |
(56 | ) | (16 | ) | — | 72 | — | |||||||||
Investment in unconsolidated affiliate |
— | (26 | ) | — | — | (26 | ) | |||||||||
Cash received from unconsolidated affiliates |
— | 30 | 2 | — | 32 | |||||||||||
Other, net |
— | — | (4 | ) | 3 | (1 | ) | |||||||||
Net cash used in investing activities |
(134 | ) | (74 | ) | (204 | ) | 75 | (337 | ) | |||||||
Financing activities: |
||||||||||||||||
Net repayments under revolving loan facilities |
— | — | (2 | ) | — | (2 | ) | |||||||||
Net borrowings on overdraft facilities |
— | — | 9 | — | 9 | |||||||||||
Repayments of short-term debt |
— | — | (187 | ) | — | (187 | ) | |||||||||
Borrowings on short-term debt |
— | — | 162 | — | 162 | |||||||||||
Repayments of long-term debt |
(305 | ) | — | (103 | ) | — | (408 | ) | ||||||||
Proceeds from issuance of long-term debt |
— | — | 98 | — | 98 | |||||||||||
Repayments of notes payable to affiliate |
(105 | ) | — | — | — | (105 | ) | |||||||||
Proceeds from notes payable to affiliate |
105 | — | — | — | 105 | |||||||||||
Repayments of notes payable |
(32 | ) | — | (2 | ) | — | (34 | ) | ||||||||
Borrowings on notes payable |
33 | — | 2 | — | 35 | |||||||||||
Debt issuance costs paid |
(7 | ) | — | — | — | (7 | ) | |||||||||
Call premiums related to early extinguishment of debt |
(6 | ) | — | — | — | (6 | ) | |||||||||
Contribution from parent |
— | (32 | ) | 104 | (72 | ) | — | |||||||||
Dividends paid to parent |
(79 | ) | (2 | ) | — | 2 | (79 | ) | ||||||||
Dividends paid to noncontrolling interests |
— | — | (9 | ) | — | (9 | ) | |||||||||
Excess tax benefit related to stock-based compensation |
10 | — | — | — | 10 | |||||||||||
Other, net |
— | — | — | — | — | |||||||||||
Net cash (used in) provided by financing activities |
(386 | ) | (34 | ) | 72 | (70 | ) | (418 | ) | |||||||
Effect of exchange rate changes on cash |
— | — | (7 | ) | — | (7 | ) | |||||||||
Decrease in cash and cash equivalents |
(216 | ) | (9 | ) | (105 | ) | — | (330 | ) | |||||||
Cash and cash equivalents at beginning of period |
220 | 9 | 332 | — | 561 | |||||||||||
Cash and cash equivalents at end of period |
$ | 4 | $ | — | $ | 227 | $ | — | $ | 231 | ||||||
F-87
HUNTSMAN INTERNATIONAL LLC AND SUBSIDIARIES
NOTES TO CONSOLIDATED FINANCIAL STATEMENTS (Continued)
28. CONDENSED CONSOLIDATING FINANCIAL INFORMATION (Continued)
HUNTSMAN INTERNATIONAL LLC AND SUBSIDIARIES
CONDENSED CONSOLIDATING STATEMENTS OF CASH FLOWS
YEAR ENDED DECEMBER 31, 2010
(Dollars in Millions)
| |
Parent Company |
Guarantors | Nonguarantors | Eliminations | Consolidated Huntsman International LLC |
|||||||||||
|---|---|---|---|---|---|---|---|---|---|---|---|---|---|---|---|---|
Net cash (used in) provided by operating activities |
$ | (241 | ) | $ | 15 | $ | 182 | $ | (2 | ) | $ | (46 | ) | |||
Investing activities: |
||||||||||||||||
Capital expenditures |
(26 | ) | (51 | ) | (159 | ) | — | (236 | ) | |||||||
Proceeds from settlements treated as reimbursement of capital expenditures |
— | 34 | — | — | 34 | |||||||||||
Cash assumed in connection with the initial consolidation of a variable interest entity |
— | — | 14 | — | 14 | |||||||||||
Proceeds from sale of businesses/assets |
— | — | 2 | — | 2 | |||||||||||
Increase in receivable from affiliate |
(57 | ) | — | — | — | (57 | ) | |||||||||
Investment in affiliate |
(65 | ) | (13 | ) | — | 78 | — | |||||||||
Investment in unconsolidated affiliates |
— | (24 | ) | (3 | ) | — | (27 | ) | ||||||||
Cash received from unconsolidated affiliates |
— | 26 | 5 | — | 31 | |||||||||||
Other, net |
— | — | 1 | — | 1 | |||||||||||
Net cash used in investing activities |
(148 | ) | (28 | ) | (140 | ) | 78 | (238 | ) | |||||||
Financing activities: |
||||||||||||||||
Net repayments under revolving loan facilities |
— | — | (6 | ) | — | (6 | ) | |||||||||
Revolving loan facility from A/R Programs |
254 | — | — | — | 254 | |||||||||||
Net borrowings on overdraft facilities |
— | — | (2 | ) | — | (2 | ) | |||||||||
Repayments of short-term debt |
— | — | (175 | ) | — | (175 | ) | |||||||||
Borrowings on short-term debt |
— | — | 212 | — | 212 | |||||||||||
Repayments of long-term debt |
(1,154 | ) | — | (53 | ) | — | (1,207 | ) | ||||||||
Proceeds from issuance of long-term debt |
894 | — | 29 | — | 923 | |||||||||||
Repayments of note payable to affiliate |
(125 | ) | — | — | — | (125 | ) | |||||||||
Proceeds from notes payable to affiliate |
110 | — | — | — | 110 | |||||||||||
Intercompany repayments |
— | — | (5 | ) | 5 | — | ||||||||||
Repayments of notes payable |
(38 | ) | — | (15 | ) | — | (53 | ) | ||||||||
Borrowings on notes payable |
33 | — | 13 | — | 46 | |||||||||||
Debt issuance costs paid |
(29 | ) | — | — | — | (29 | ) | |||||||||
Call premiums paid related to early extinguishment of debt |
(28 | ) | — | — | — | (28 | ) | |||||||||
Contribution from parent |
— | — | 83 | (83 | ) | — | ||||||||||
Dividends paid to parent |
— | (2 | ) | — | 2 | — | ||||||||||
Excess tax benefit related to stock-based compensation |
4 | — | — | — | 4 | |||||||||||
Other, net |
— | — | (2 | ) | — | (2 | ) | |||||||||
Net cash (used in) provided by financing activities |
(79 | ) | (2 | ) | 79 | (76 | ) | (78 | ) | |||||||
Effect of exchange rate changes on cash |
— | — | 4 | — | 4 | |||||||||||
(Decrease) increase in cash and cash equivalents |
(468 | ) | (15 | ) | 125 | — | (358 | ) | ||||||||
Cash and cash equivalents at beginning of period |
688 | 24 | 207 | — | 919 | |||||||||||
Cash and cash equivalents at end of period |
$ | 220 | $ | 9 | $ | 332 | $ | — | $ | 561 | ||||||
F-88
HUNTSMAN INTERNATIONAL LLC AND SUBSIDIARIES
NOTES TO CONSOLIDATED FINANCIAL STATEMENTS (Continued)
29. SELECTED UNAUDITED QUARTERLY FINANCIAL DATA
A summary of selected unaudited quarterly financial data for the years ended December 31, 2012 and 2011 is as follows (dollars in millions):
| |
Three months ended | ||||||||||||
|---|---|---|---|---|---|---|---|---|---|---|---|---|---|
| |
March 31, 2012(1) |
June 30, 2012 |
September 30, 2012(1) |
December 31, 2012(1)(2) |
|||||||||
Revenues |
$ | 2,913 | $ | 2,914 | $ | 2,741 | $ | 2,619 | |||||
Gross profit |
554 | 532 | 542 | 413 | |||||||||
Restructuring, impairment and plant closing costs |
— | 5 | 47 | 40 | |||||||||
Income (loss) from continuing operations |
170 | 133 | 121 | (44 | ) | ||||||||
Income (loss) before extraordinary gain |
166 | 131 | 120 | (44 | ) | ||||||||
Net income (loss) |
166 | 131 | 121 | (43 | ) | ||||||||
Net income (loss) attributable to Huntsman International LLC |
166 | 127 | 117 | (45 | ) | ||||||||
| |
Three months ended | ||||||||||||
|---|---|---|---|---|---|---|---|---|---|---|---|---|---|
| |
March 31, 2011 |
June 30, 2011 |
September 30, 2011(3) |
December 31, 2011(4) |
|||||||||
Revenues |
$ | 2,679 | $ | 2,934 | $ | 2,976 | $ | 2,632 | |||||
Gross profit |
465 | 505 | 495 | 393 | |||||||||
Restructuring, impairment and plant closing costs |
7 | 9 | 155 | (4 | ) | ||||||||
Income (loss) from continuing operations |
81 | 127 | (39 | ) | 88 | ||||||||
Income (loss) before extraordinary gain |
67 | 126 | (29 | ) | 92 | ||||||||
Net income (loss) |
68 | 127 | (29 | ) | 94 | ||||||||
Net income (loss) attributable to Huntsman International LLC |
63 | 117 | (31 | ) | 104 | ||||||||
Also during the fourth quarter of 2012, we recorded a loss on early extinguishment of debt of $77 million in connection with the redemption of $400 million of our 2016 Senior Notes.
F-89
HUNTSMAN INTERNATIONAL LLC AND SUBSIDIARIES
NOTES TO CONSOLIDATED FINANCIAL STATEMENTS (Continued)
29. SELECTED UNAUDITED QUARTERLY FINANCIAL DATA (Continued)
* * * * * *
F-90
HUNTSMAN INTERNATIONAL LLC AND SUBSIDIARIES
Schedule II—Valuation and Qualifying Accounts
(Dollars in Millions)
Column A
|
Column B | Column C | |
Column D | Column E | |||||||||||
|---|---|---|---|---|---|---|---|---|---|---|---|---|---|---|---|---|
| |
|
Additions | |
|
|
|||||||||||
Description
|
Balance at Beginning of Period |
Charges (Credits) to cost and expenses |
Charged to other accounts |
Deductions | Balance at End of Period |
|||||||||||
Allowance for Doubtful Accounts: |
||||||||||||||||
Year ended December 31, 2012 |
$ | 46 | $ | 4 | $ | (3 | ) | $ | — | $ | 47 | |||||
Year ended December 31, 2011 |
52 | (4 | ) | (2 | ) | — | 46 | |||||||||
Year ended December 31, 2010 |
56 | 6 | (10 | ) | — | 52 | ||||||||||
F-91
No dealer, sales representative or any other person has been authorized to give any information or to make any representations in connection with this exchange offer other than those contained in this prospectus and, if given or made, the information or representations must not be relied upon as having been authorized by Huntsman International LLC. This prospectus does not constitute an offer to sell or a solicitation of any offer to buy any securities other than the notes to which it relates or an offer to, or a solicitation of, any person in any jurisdiction where such an offer or solicitation would be unlawful. Neither the delivery of this prospectus nor any sale made under this prospectus shall, under any circumstances, create an implication that there has been no change in the affairs of Huntsman International LLC or that information contained herein is correct as of any time subsequent to the date hereof. Until July 5, 2013, all dealers that effect transactions in these securities, whether or not participating in this exchange offer, may be required to deliver a prospectus. This is in addition to the dealers' obligation to deliver a prospectus when acting as underwriters and with respect to their unsold allotments or subscriptions.
PROSPECTUS
Huntsman International LLC
Exchange Offer for
$250,000,000 4.875% Senior Notes due 2020
![]()
April 5, 2013